

Translate this page into:
Fourier transform near infrared spectroscopy as a tool for predicting antioxidant activity of propolis
⁎Corresponding author. matheus_augustocalegari@hotmail.com (Matheus Augusto Calegari)
-
Received: ,
Accepted: ,
This article was originally published by Elsevier and was migrated to Scientific Scholar after the change of Publisher.
Peer review under responsibility of King Saud University.
Abstract
The propolis chemical composition is complex, varied, and closely related to characteristics of the vegetation and location where the hives are located. The objective of this work was to determine the antioxidant activity through FRAP methodology in propolis (raw, macerated, ethanolic extract and concentrated ethanolic extract) using a rapid and non-destructive method namely Fourier transform near-infrared (FTNIR) spectroscopy. By the results obtained for the antioxidant activity it can be verified that the samples of propolis present a very diversified chemical profile, for the FRAP methodology the samples of propolis collected in Três Barras – SC and Campo Magro – PR showed the highest activities: 1.8 × 10³ and 1.6 × 10³ μmol of Fe2+ g−1 respectively. It was possible to conclude that the macerated propolis presented the best multivariate calibration model established with the Savitzky-Golay (SG) + Constant Offset Elimination (COE) preprocessed spectra, where the R2 and 0.95 and 113 for FRAP determination. The error values RMSEC, RMSECV and RMSEE were 73, 1.3 × 10² and 81 μmol Fe2+ g−1, respectively. The FRAP model for macerated propolis was validated and can be used for quantification of antioxidant activity of new extracts of propolis, being useful as an alternative to rapid analysis, reducing waste generation and cost.
Keywords
FRAP
Chemometrics
Potential
Savitzky-Golay + Constant Offset Elimination

1 Introduction
Biodiversity in ecosystems depends directly on pollination of bees, that is, a crucial factor, the world production of agriculture is maintained mainly by these insects, as they act as “service providers” (Michener, 2000; Garófalo, 2004; Greenleaf and Kremen, 2006; Winfree, Gross and Kremen, 2011). Bees provide various products to humans, the most important and known are honey, propolis, royal jelly, wax and bee venom (Apitoxin). Nowadays, the use of insecticides has a very large consequence, because it can lead to the extinction of the bees, in addition, this extinction may also be associated to ecosystem degradation, habitat fragmentation, plant species depletion and global warming (Michener, 2000; Madras-Majewska and Majewski, 2016).
The propolis is a bee product which has vegetable resin, beeswax and secretions of workers' head glands (Barth, 2004; Salatino et al., 2005; Fernandes Junior et al., 2006). The chemical composition of propolis is complex and varies according to the flora of the region where hives are located, the seasonality and bee species (Bankova et al., 2000; Kumazawa et al., 2004; Calegari et al., 2017). The main phenolic compounds identified in samples of propolis are hydroxybenzoic and hydroxycinnamic acids (Calegari et al., 2017; de Xavier et al., 2017), flavones, flavonols, flavanones, pinocembrin, chrysin, galangin, luteolin (Cao et al., 2017; Peter et al., 2017), and acid phenylethyl ester (Ciftci-Yilmaz et al., 2017; Oruç et al., 2017).
The phenolic compounds presents biological activities as antioxidant potential because they have in their chemical structures aromatic compounds and hydroxyl groups that shown redox potential (Angelo and Jorge, 2007; Gülçin, 2012). Antioxidants are compounds that acts as defense agents against free radicals that are naturally produced in aerobic organisms during cellular metabolism (Kumar, 2015), which are beneficial at moderate levels but at higher concentrations can damage tissues by oxidative stress resulting in chronic diseases such as cancer and metabolic disorders (Pham-Huy et al., 2008; Kumar, 2015; Kocot et al., 2018).
Several in vitro assays are used to evaluate the antioxidant capacity, among which are methods based in HAT (Hydrogen Atom Transfer) and SET (Single Electron Transfer) (Huang et al., 2005; Gülçin, 2012). The methods of 2,2′-azinobis-(3-ethylbenzothiazoline-6-sulfonic acid) (ABTS) and diphenyl-2-picrylhydrazyl (DPPH) radical scavenging, ferric reducing ability of plasma (FRAP assay) and oxygen radical absorbance capacity (ORAC) are used to determine the antioxidant activity in many matrices (Kumar, 2015). In ABTS method are involved HAT and SET (Gülçin, 2012) mechanisms, the DPPH and FRAP assays are based in SET (Huang et al., 2005), and ORAC methodology is based only in HAT (Huang et al., 2005; Payne et al., 2013).
The quality of propolis can be evaluated by in vitro antioxidant assays (Lee et al., 2014; Akhir, Bakar and Sanusi, 2017; Andrade et al., 2017; Calegari et al., 2017; El-Guendouz et al., 2017; Narimane et al., 2017; de Francisco et al., 2018), and the FRAP methodology highlight in several works (Salgueiro and Castro, 2016; Andrade et al., 2017; Kunrath et al., 2017; da Silva et al., 2018; de Francisco et al., 2018; Zhang et al., 2018;). In this methodology no free radicals are involved, but the reduction of ferric iron (Fe3+) to ferrous iron (Fe2+) by electron transfer is present. Ferrous ions are found in foods, and it is known as an effective pro oxidizer because of its high reactivity. The FRAP methodology is performed to determine the ability of a substance to bind to the ferrous ion of oxidation (Kumar, 2015).
Infrared spectroscopy (IR) is a powerful instrumental technique that assists researchers from a wide range of fields to elucidate chemical structures since the vast majority of compounds and elements absorb infrared radiation (Skoog et al., 2004). FTNIR equipment is highly used in many industries, from agricultural to petrochemical, for being simple, versatile, fast and above all non-destructive. A FTNIR can verify n constituents and more effectively quantify these constituents of a matrix simultaneously, and matrices in most cases do not want a preparation (Skoog, 2009; Sun et al., 2009; Christian et al., 2014).
Through multivariate calibration analysis techniques such as PLS (Partial Least Squares) regression, models can be constructed for a variety of purposes, since these methods are essences for the FTNIR (Balabin et al., 2007). Because the spectra used in the construction of the models generate a large amount of information, many of them are sometimes not relevant to the construction of the calibration models, and are not related to the information that actually represents the samples. Thus, a polishing (pre-processing) of the spectroscopic data is required for the construction of the models (Rinnan et al., 2009; de Souza and Poppi, 2012; de Souza et al., 2013).
Within this context the objectives of this work were to determine the antioxidant activity by reduction of Fe3+ to Fe2+ (FRAP methodology) of propolis produced in South of Brazil and to determine the type of propolis (raw, macerated, ethanolic extract of propolis - EEP and concentrated extract of propolis - CEP) coupled to the best preprocessing shows the finest multivariate calibration model for the FRAP by statistical parameters.
2 Materials and methods
2.1 Sample collection and preparation
The samples of propolis were donated by Breyer & Cia Ltda company, located in the União da Vitória city, Paraná, Brazil. A total of 33 samples of propolis from Parana (PR) and Santa Catarina (SC) states were evaluated (Table 1).
Cities
Code
Cities
Code
Campo Largo – PR
1 – CLP
2 – CLP
3 – CLP
4 – CLP
5 - CLPCruz Machado- PR
1 - CMP
Prudentópolis - PR
1 – PRP
2 – PRP
3 - PRP
Pitanga - PR
1 – PTP
2 - PTP
Canoinhas – SC
1 – CNS
2 – CNS
3 - CNS
Pinhão - PR
1 – PNP
2 - PNP
Palmital – PR
1 – PMP
2 - PMPUnião da Vitória - PR
1 – UVP
2 - UVP
Arapoti – PR
1 – ARP
2 - ARPTrês Barras - SC
1 – TBS
2 - TBS
General Carneiro – PR
1 – GCP
2 – GCP
3 – GCP
4 – GCPCampo Magro - PR
1 – CMP
2 - CMP
Santa Terezinha - SC
1 – STS
2 - STS
Mato Rico – PR
1 - MRP
The raw propolis (raw) samples were crushed with liquid nitrogen and homogenized, yielding the macerated propolis (macerated) that was stored at (−6 °C) until analysis. In the next step was prepared the Ethanolic Extract of Propolis (EEP) as described by Oldoni et al. (2015). Fifty milliliters of ethanol:water (80:20 v v−1) were added to 4 g aliquot of sample, and the extraction was subsequently carried out in a water bath at 70 °C for 45 min then the mixture was cooled and filtered through Whatman grade No. 4 filter paper. The EEP was concentrated on a rotary evaporator under the conditions of 120 mbar at 40 °C and residual water was freeze-dried. After concentration, standardized extracts were prepared at 1000 µg mL−1 with ethanol:water (80:20 v v-1), giving the concentrated extract of propolis (CEP). Due to heterogeneity of samples, for each raw sample of propolis were prepared extracts in duplicate, measurements and spectrum acquisition were performed in triplicate.
2.2 Antioxidant activity using the iron reduction method (FRAP)
Antioxidant activity by iron reducing power (FRAP) was initially proposed by Benzie and Strain (1996). The FRAP reagent was obtained from the mixture of 25 mL of 0.3 mol L−1 acetate buffer, 2.5 mL of a 10 mmol L−1 TPTZ solution and 2.5 mL of iron chloride 20 mmol L−1. The reaction consists of 100 μL CEP (250 μg mL−1) with 3 mL reagent. The mixture was homogenized and kept in a thermostatic bath at 37 °C for 30 min. The absorbance was then measured at 595 nm in a spectrophotometer (UV-VIS model Lambda 25, Perkin Elmer). The FRAP reagent was used as a blank and the quantification was carried out by the calibration curve prepared with ferrous sulfate and the results were expressed as μmol of Fe2+ per gram of propolis (μmol Fe2+ g−1).
2.3 FTNIR measurements
The spectra were acquired between 12500 and 4000 cm−1 using a Bruker MPATM Fourier transform NIR instrument (Bruker Optics, Germany). For the solid samples of propolis (raw and macerated) was used an optical resolution of 32 cm−1 and 64 accumulations by using a support for solids (quartz glass) with rotation while for liquid propolis extracts (EEP and CEP) the equipment was configured with a resolution of 8 cm−1 with 32 accumulations, using a flow quartz cuvette.
2.4 Data preprocessing
The spectral data were analyzed using software Opus 7.2 quant 2 (Bruker Optics, Germany). Validation of the models will be performed by leave-one-out cross-validation and test group by internal validation. The performances of models were evaluated by statistical parameters reported in Table 2.
Parameters
Values
Quality of models
Refs.
R2
Determination coefficient
> 0.83
Good Robustness of Prediction
Elfadl et al. (2010)
RPD
Residual prediction deviation
1.5 to 2.0
Model discriminates between minors and the highest values of the responses
Williams and Norris (2001), Kumar (2015)
2.5 to 3.0
Good prediction accuracy
> 3.0
Excellent prediction accuracy
RER
Range error ratio
>10
Good prevision estimate
Páscoa et al. (2013)
RMSEP/RMSECV
Root mean square error of prediction/ Root mean square error of cross validation
≈ 1.0
Robustness
Li et al. (2011)
< 1.2
Robustness
Lu et al. (2014), Alves et al. (2012), Wang et al. (2017)
RMSEP
–
The lower the better
Validation analysis error
Conzen (2006)
RMSEC
Root mean square error of calibration
The lower the better
Calibration analysis error
Oliveira et al. (2015)
RMSECV
–
The lower the better
Previson error
Kumar (2015)
RMSEE
Root mean square error of estimation
The lower the better
Calibration analysis error
Conzen (2006)
The equations used to calculate RMSECV (Eq. (1)), RMSEP (Eq. (2)), R2 (Eq. (3)) and RER (Eq. (4)) were:
In this study, several preprocessing were tested on the spectral dataset, as Standard Normal Variate, Savitzky–Golay, Multiplicative Scatter Correction, First (1D) and Second derivatives (2D), Constant Offset Elimination and Minimum and Maximum normalization. To all models, the data were first mean centered and submitted to at least one of pre-treatments above mentioned.
3 Results and discussion
3.1 Results for antioxidant activity using the iron reduction method (FRAP)
The samples of propolis collected in the states of PR and SC were evaluated as antioxidant activity by FRAP method (Table 3). The samples were divided into two data sets, that of calibration (70% of samples) and that of external validation (30% of samples) and table 3 shows the minimum, maximum, mean, standard deviations and coefficient of variation for both groups. The observed range obtained by the FRAP method ranged from 61.9 to 1770 μmol FeSO4 g−1. The samples of propolis collected in Três Barras – SC (1 – TBS) and Campo Magro – PR (2 – CMP) showed the highest activities: 1.8 × 10³ and 1.6 × 10³ μmol of Fe2+ g−1 respectively. Source: Research data. Notes: s.d .: standard deviation. C.V.: Coefficient of variation (%). n = 6.
Calibration (70% of samples)
Validation (30% of samples)
Method
Min
Max
Mean
s.d.
CV(%)
Min
Max
Mean
s.d.
CV(%)
FRAP (µmol de Fe2+ g−1)
61.90
1.8 × 10³
534
365
68.30
74.60
1.8 × 10³
586
450
76.70
Salgueiro and Castro (2016) studied propolis from Rio de Janeiro, São Paulo and Minas Gerais and values ranging from 60 to 650 mmol Fe2+ 100 mg−1 were obtained for FRAP method. With samples of propolis from Paraná, Calegari et al. (2017) obtained values for the reduction of FRAP iron between 8.0 × 101 and 2.8 × 10² μmol Fe2+ g−1. In da Silva et al. (2018) developed PLS multivariate calibration models by FT-IR-ATR spectroscopy to quantify phenolic compounds and antioxidant activity in propolis samples from southern Brazil and values ranged from 66.74 to 1164 μmol of Fe2+ g−1. The results reported above corroborate with our results highlighting the quality of the propolis used.
3.2 Development of calibration and validation models
The construction of the PLS models were carried out on the basis described in items 2.3 and 2.4, where the software correlates all the results obtained with the reference analyzes with the generated spectra of the equipment. The software used to construct the models helps us to reduce errors, which implies directly in a better quality of these, some preprocesses and errors are suggested, as well as, number of latent variables, value of RMSECV, removal of outliers, spectral region, because spectra do not contain important information in some regions. The calibration models must be evaluated so that they can present certain reliability and validity, this is verified through the verification of some parameters such as correlation coefficient (R2), standard errors of calibration, validation and internal cross prediction (Ferreira et al., 1999; Konzen et al., 2003).
The software Opus 7.2 quant 2 was used to compare preprocessing (Table 4) and the best models were that presented low values for RMSECV, RMSEC, RMSEP, RMSEE, high values for RPD, RER and R2, as well as ratio RMSEP/RMSECV. These measurements are made to quantitatively verify the average precision of the predictive capacity of the chemometric models (Conzen, 2006). Source: Research data. Notes: unit for RMSECV is given in μmol Fe2+ g−1.
FRAP
RAW
SG + COE
SG + 2D
SG + MSC
SG
Spectral Band (cm−1)
R2
RMSECV
RPD
L
R2
RMSECV
RPD
L
R2
RMSECV
RPD
L
R2
RMSECV
RPD
L
R2
RMSECV
RPD
L
Raw
7513.9 – 6094.0 to 5461.9 – 4597.9
−0.060
3.8 × 10²
0.98
10
0.51
2.6 × 10²
1.4
10
0.78
1.7 × 10²
2.2
10
0.52
2.5 × 10²
1.5
10
0.46
2.7 × 10²
1.4
10
RAW
SG + COE
SG + 2D
SG + MSC
SG
Macerated
9411.7 – 6094.5 to 5461.9 – 4243.0
0.72
1.9 × 10²
1.8
9
0.87
1.3 × 10²
2.8
9
0.63
2.1 × 10²
1.6
9
0.23
3.1 × 10²
1.1
9
0.72
1.9 × 10²
1.9
9
RAW
COE
2D
MSC
SG
EEP
9400.0 – 5446.4 to 4601.7 – 4424.2
0.55
2.4 × 10²
1.5
10
0.57
2.3 × 10²
1.5
10
0.85
1.4 × 10²
2.6
10
0.69
2.0 × 10²
1.8
10
0.77
1.7 × 10²
2.1
10
RAW
COE
2D
MSC
SG
CEP
6102.1 – 4597.8
0.65
2.2 × 10²
1.7
10
0.73
1.9 × 10²
1.9
10
0.53
2.6 × 10²
1.4
10
0.80
1.7 × 10²
2.2
10
0.65
2.3 × 10²
1.6
10
The best model for raw propolis was obtained by using SG smoothing + 2D preprocessing (Table 4). These preprocessing methods are good for aplication to analytical signals that presents narrow peaks among them SG and are able to remove the effects of addition in models, adjust baseline and eliminate the linear trend of this 2D (Rinnan et al., 2009). The region used for construction of this model was 7513.9–6094.0 to 5461.9–4597.9 cm−1 and this model showed high value of R2: 0.78 when compared to others models (−0.06 < R2 < 0.52). The RMSECV value was 1.7 × 10² µmol de Fe2+ g−1 with RPD value of 2.2 and 10 latent variables.
For macerated propolis the preprocessing SG + COE presented good values for evaluated parameters. The COE preprocessing linearly moves the spectra, in order to define that minimum values of Y are equal to zero (Tripathi and Mishra, 2009; Kumar, 2015). The selected spectral region of this model was 9411.7–6094.5 to 5461.9–4243.0 cm−1 and the value obtained for R2 was the largest (0.87) when compared to other preprocessing. The RMSECV value was 1.2 × 10² µmol de Fe2+ g−1 with 9 latent variables and RPD of 2.8.
When extracts of propolis were evaluated and the spectra obtained (EEP), the lowest RMSECV value (1.4 × 10² µmol de Fe2+ g−1) was found when it was used 2D preprocessing and obtained values for R2 and RPD were 0.85 and 2.6 respectively while the latent variables was equal to 10. The selected spectral region was of 9400.0–5446.4 to 4601.7–4424.2 cm−1.
When the spectra were obtained from EEPC, the preprocessing SG + MSC showed the better model. The MSC (Multiplicative Scatter Correction) is widely used for the correction of data in NIR (Rinnan et al., 2009) therefore, helps to remove baseline fluctuations, imperfections, physical aspects of samples (size and shape of particles) from the data matrix, so that only chemical information is used (de Souza and Poppi, 2012; de Souza et al., 2013). The values for R2: 0.80, RMSECV: 1.7 × 10² µmol de Fe2+ g−1, RPD: 2.2 and latent variables of 10. This model was constructed with the lower spectral region (6102.1–4597.8 cm−1) compared to others, where at least two regions were selected from each spectrum.
In general, it can be seen that the preprocesses improve the quality of the models, due to the fact that they have tools capable of correcting, smoothing, adjusting, removing undesirable effects in the spectra, allowing only spectral information of interest to be included in the model.
Table 5 below presents the parameters (R2, RMSEC, RMSECV, RMSEP, RMSEE, RPD, RER and RMSEP/RMSECV) for the types of propolis. The preprocessing employed in PLS models for raw, macerated, EEP and CEP were SG + 2D; SG + COE; 2D and MSC respectively. The values of internal validation errors and calibration errors are presents in Table 5. The parameters should be checked and analyzed according to the literature (Table 2). Source: Research data.
Raw
Macerated
EEP
CEP
Cal.
Validation
Cal.
Validation
Cal.
Validation
Cal.
Validation
Cross
Test Set
Cross
Test Set
Cross
Test Set
Cross
Test Set
R2
0.96
0.78
0.82
0.95
0.87
0.89
0.93
0.85
0.90
0.86
0.80
0.79
RMSEC
64
–
–
73
–
–
90
–
–
1.4 × 10²
–
–
RMSECV
–
1.7 × 10²
–
–
1.2 × 10²
–
–
1.4 × 10²
–
–
1.7 × 10²
–
RMSEP
–
–
1.1 × 10²
–
–
1.1 × 10²
–
–
1.0 × 10²
–
–
1.8 × 10²
RMSEE
74
–
–
81
–
–
94
–
–
1.4 × 10²
–
–
RPD
5.7
2.2
2.4
4.9
2.9
3.1
4.0
2.6
3.3
2.7
2.2
2.2
RER
–
15
9.2
13
13
–
16
15
–
9.7
9.3
RMSEP/RMSECV
0.64
0.87
0.75
1.0
The models for macerated propolis and EEP showed similar values for quality parameters. The values for the R2 were very close to 1, since according to Elfadl et al. (2010) models with R2 > 0.83 already present a good robustness of prediction. For the RMSEC errors, RMSECV, RMSEP and RMSEE, the lower the error values, the better the models (Conzen, 2006; Kumar, 2015; Oliveira et al., 2015a,b). Table 5 shows that the lowest values of RMSEC, RMSECV and RMSEE were obtained for the propolis macerated (73 μmol Fe2+ g−1; 1.2 × 10² and 81 μmol Fe2+ g−1 respectively).
The RPD value is a very important parameter when it comes to calibration models for indicating the prediction precision of the model. RPD values ranging from 1.5 to 2.0 can discriminate from the smallest to the largest values of the variables responses, values between 2.5 and 3.0, indicate a prediction accuracy of the model, and finally values above 3 indicate an excellent prediction accuracy (Williams and Norris, 2001; Kumar, 2015). It is possible to verify through Table 5 that the higher RPD value was obtained for macerated propolis.
The RER parameter should also be checked and values above 10 indicate a good estimate of the multivariate calibration model (Páscoa et al., 2013). The macerated propolis and EEP are in agreement with the literature and Cross and Test Set validation shows values of 16 and 15 respectively (Table 5) for RER. However, considering the value of the RMSEP/RMSEC ratio, the value for macerated propolis is higher, indicating a more robust model. Thus, the best PLS model for FRAP was obtained for macerated propolis.
Figs. 1 and 2 show the NIR spectra obtained for the macerated propolis. Fig. 1 shows the original spectrum without preprocessing in the selected region and Fig. 2 shows the spectrum with the preprocessing SG + COE applied in the selected region.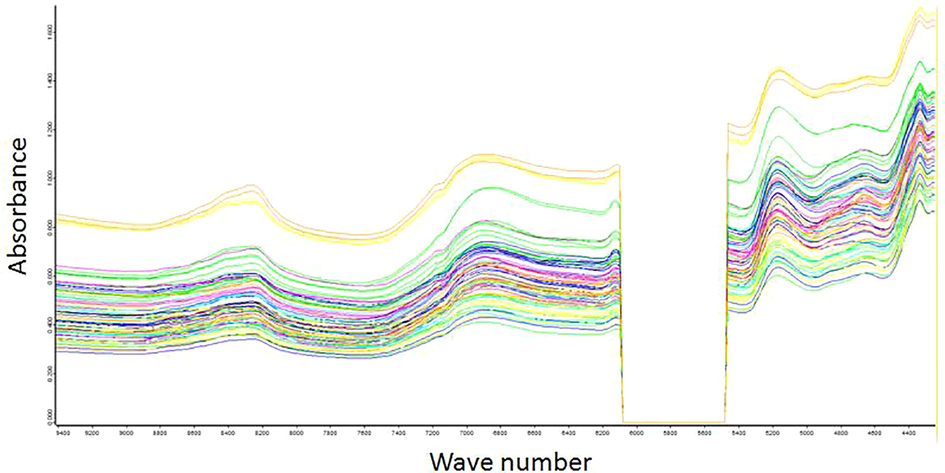
FTNIR spectra of macerated propolis without preprocessing (selected region).
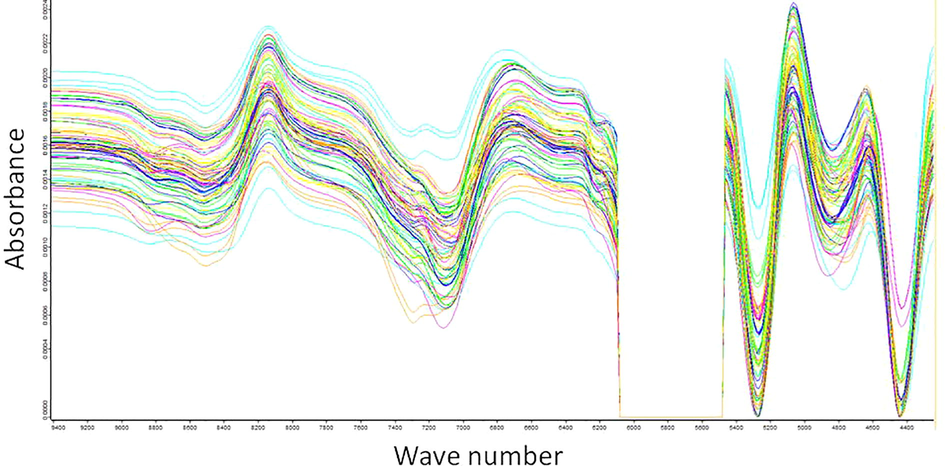
FTNIR spectra of macerated propolis with SG + COE (selected region).
It is possible to conclude that the preprocessing modifies the spectra, giving more intensity to the spectra as well as shifting them.
Fig. 3 shows the correlation of the values obtained in the laboratory (reference) with regard to those predicted by the FTNIR for FRAP method. This curve showed R2 of 0.87 indicating a positive correlation between the values and a good probability that FTNIR predicted value is related to the reference analysis. Fig. 4 shows the calibration curve of the model, through the actual values vs. the predicted values used in the calibration and the R2 value was 0.96 indicating a higher positive correlation between the values.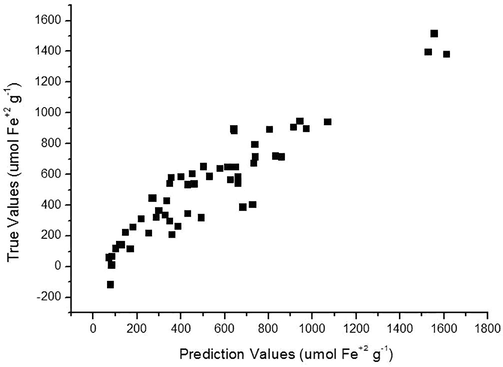
Cross validation curve of the actual values vs. values predicted for FRAP.
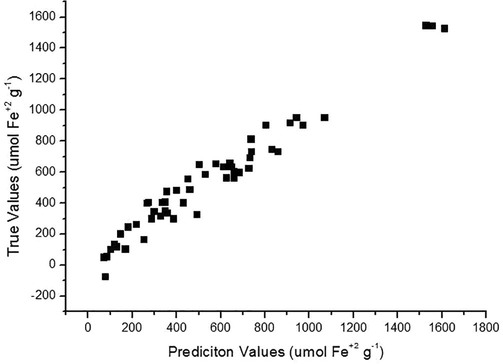
Calibration curve of the actual values vs. predicted values for FRAP.
4 Conclusions
The determination of the antioxidant activity of the propolis samples through the FRAP methodology indicated that the propolis produced and collected in the Southern region of Brazil are very promising for further studies for of their high antioxidant potential. For the first time, FTNIR results, evaluated by PLS, of propolis showed that the best model was constructed using macerated samples of propolis and applying the SG + COE preprocessing. Thus the results shown that antioxidant activity of propolis can be successfully estimated by a rapid and non-destructive technique, without any sample preparation.
Acknowledgements
This work was supported by Coordenação de Aperfeiçoamento de Pessoal de Nivel Superior (CAPES) Brazil. We thank the Universidade Tecnológica Federal do Paraná (UTFPR), Pato Branco, Paraná, Brazil, for the support on chemical analyzes and Central de Análises of UTFPR (Pato Branco, Paraná, Brazil), for the support on spectroscopic analyzes. We thank Breyer & Cia Ltda company for the propolis samples.
References
- Antioxidant and antimicrobial activity of stingless bee bread and propolis extracts. In: AIP Conference Proceedings. AIP Publishing LLC; 2017. pp. 20090
- [CrossRef] [Google Scholar]
- A common near infrared-based partial least squares regression model for the prediction of wood density of Pinus pinaster and Larix × eurolepis. Wood Sci. Technol.. 2012;46:157-175.
- [CrossRef] [Google Scholar]
- Evaluation of bioactive compounds potential and antioxidant activity of brown, green and red propolis from Brazilian northeast region. Food Res. Int.. 2017;101:129-138.
- [CrossRef] [Google Scholar]
- Phenolic compounds in foods – A brief review. Revista do Instituto Adolfo Lutz (Impresso). 2007;66:1-9.
- [Google Scholar]
- Comparison of linear and nonlinear calibration models based on near infrared (NIR) spectroscopy data for gasoline properties prediction. Chemom. Intell. Lab. Syst.. 2007;88:183-188.
- [CrossRef] [Google Scholar]
- Propolis: recent advances in chemistry and plant origin. Apidologie. 2000;31:3-15.
- [CrossRef] [Google Scholar]
- Melissopalynology in Brazil: a review of pollen analysis of honeys, propolis and pollen loads of bees. Sci. Agric.. 2004;61:342-350.
- [CrossRef] [Google Scholar]
- The ferric reducing ability of plasma (FRAP) as a measure of ‘‘antioxidant power’’: the FRAP assay. Analyt. Biochem.. 1996;239:70-76.
- [Google Scholar]
- Propolis from southwest of parana produced by selected bees: influence of seasonality and food supplementation on antioxidant activity and phenolic profile. An. Acad. Bras. Cienc.. 2017;89:45-55.
- [CrossRef] [Google Scholar]
- Mechanisms underlying the wound healing potential of propolis based on its in vitro antioxidant activity. Elsevier 2017
- [CrossRef] [Google Scholar]
- Christian, G.D., Dasgupta, P.K., Schug, K.A., 2014. Analytical chemistry. 7th ed., Wiley: New York.
- Ciftci-Yilmaz, S., Azman, Z.N., Kosem, K., Gunduz, E., Grenman, R.G., 2017. Evaluating Antioxidant Capacity of Different Propolis Samples from Konya, Turkey and Their Inhibitory Effect on Head and Neck Cancer Cells. bioRxiv, 183913. doi: 10.1101/183913.
- Multivariate calibration: a practical guide for developing methods in the quantitative analytical chemistry. BRUKER 2006:1.
- [Google Scholar]
- Determination of total phenolic compounds and antioxidant activity of ethanolic extracts of propolis using ATR–FT-IR spectroscopy and chemometrics. Food Anal. Methods. 2018;1–9
- [CrossRef] [Google Scholar]
- Evaluation of radical scavenging activity, intestinal cell viability and antifungal activity of Brazilian propolis by-product. Food Res. Int.. 2018;105:537-547.
- [CrossRef] [Google Scholar]
- E. Elfadl C. Reinbrechta W. Claupein (NIRS), calibration model for estimation of oil content in a worldwide safflower germplasm collection 4 2010 259–270.
- Antioxidant and diuretic activity of co-administration of Capparis spinosa honey and propolis in comparison to furosemide. Asian Pac. J. Trop. Med.. 2017;10:974-980.
- [CrossRef] [Google Scholar]
- Atividade antimicrobiana de própolis de Apis mellifera obtidas em três regiões do Brasil. Ciência Rural. 2006;36:294-297.
- [CrossRef] [Google Scholar]
- Quimiometria i: Calibração multivariada, um tutorial. Quim. Nova. 1999;22:724-731.
- [CrossRef] [Google Scholar]
- Garófalo, C.A., 2004. Diversidade e abundância de abelhas solitárias: viabilidade e utilização como polinizadores na agricultura. II Encuentro colombiano sobre abejas silvestres.
- Wild bees enhance honey bees’ pollination of hybrid sunflower. Proc. Natl. Acad. Sci.. 2006;103:13890-13895.
- [CrossRef] [Google Scholar]
- Antioxidant activity of food constituents: an overview. Arch. Toxicol.. 2012;86:345-391.
- [CrossRef] [Google Scholar]
- The chemistry behind antioxidant capacity assays. J. Agric. Food Chem.. 2005;53:1841-1856.
- [CrossRef] [Google Scholar]
- Antioxidant potential of propolis, bee pollen, and royal jelly: possible medical application. Oxidat. Med. Cell. Longev. 2018
- [CrossRef] [Google Scholar]
- Otimização de métodos de controle de qualidade de fármacos usando algoritmo genético e busca tabu. Pesq. Op.. 2003;23(1):189-207.
- [Google Scholar]
- Kumar, S., 2015. Analytical Techniques for Natural Product Research. CABI.
- Antioxidant activity of propolis of various geographic origins. Food Chem.. 2004;84:329-339.
- [CrossRef] [Google Scholar]
- Application and evaluation of propolis, the natural antioxidant in Italian-type salami Brazilian. J. Food Technol.. 2017;20
- [CrossRef] [Google Scholar]
- Phenylpropanoid acid esters from Korean propolis and their antioxidant activities. Bioorg. Med. Chem. Lett.. 2014;24:3503-3505.
- [CrossRef] [Google Scholar]
- Classification and quantification analysis of Radix scutellariae from different origins with near infrared diffuse reflection spectroscopy. Vib. Spectrosc.. 2011;55:58-64.
- [CrossRef] [Google Scholar]
- Fast and nondestructive determination of protein content in rapeseeds (Brassica napus L.) using Fourier transform infrared photoacoustic spectroscopy (FTIR-PAS) J. Sci. Food Agric.. 2014;94
- [CrossRef] [Google Scholar]
- Importance of bees in pollination of crops in the european union countries. Eco. Sci. Rur. Devel. Conf.. 2016;Proc:42.
- [Google Scholar]
- The bees of the world. The Johns Hopkins University Press; 2000. doi: 10.1653/0015-4040(2002)085[0290:FMBLZH]2.0.CO;2
- Correlation between antioxidant activity and phenolic acids profile and content of Algerian propolis: Influence of solvent. Pak. J. Pharm. Sci. 2017;30:1417-1423.
- [Google Scholar]
- Chemical characterization and optimization of the extraction process of bioactive compounds from propolis produced by selected bees Apis mellifera. J. Braz. Chem. Soc.. 2015;28:2054-2062.
- [Google Scholar]
- Discrimination between similar woods by molecular fluorescence and partial least squares. Quim. Nova. 2015;38:1176-1180.
- [CrossRef] [Google Scholar]
- Effects of season and altitude on biological active certain phenolic compounds levels and partial standardization of propolis. Ankara Üniv. Vet. Fak. Derg.. 2017;64:13-20.
- [Google Scholar]
- FT-NIR spectroscopy as a tool for valorization of spent coffee grounds: application to assessment of antioxidant properties. Food Res. Int.. 2013;51:579-586.
- [CrossRef] [Google Scholar]
- Antioxidant assays - consistent findings from FRAP and ORAC reveal a negative impact of organic cultivation on antioxidant potential in spinach but not watercress or rocket leaves. Food Sci. Nutr.. 2013;1:439-444.
- [CrossRef] [Google Scholar]
- Antiviral and virucidal activity of hydroalcoholic extracts of propolis brown, green and jataí bees (Tetragonisca angustula) against Bovine Herpesvirus Type-1. SciELO Bras 2017
- [CrossRef] [Google Scholar]
- Free radicals, antioxidants in disease and health. Int. J. Biomed. Sci.. 2008;4:89-96.
- [Google Scholar]
- Engelsen Review of the most common pre-processing techniques for near-infrared spectra. Chem. TrAC – Trends Anal. 2009
- [CrossRef] [Google Scholar]
- Origin and chemical variation of Brazilian propolis. Evidence-based Complement. Altern. Med. 2005
- [CrossRef] [Google Scholar]
- Comparação entre a composição química e capacidade antioxidante de diferentes extratos de própolis verde. Quim. Nova. 2016;39:1192-1199.
- [CrossRef] [Google Scholar]
- Princípios de Analise Instrumental. Porto Alegre: Bookman; 2009.
- Experimento didático de quimiometria para calibração multivariada na determinação de paracetamol em comprimidos comerciais utilizando espectroscopia no infravermelho próximo: um tutorial, parte II. Quim. Nova. 2013;36:1057-1065.
- [CrossRef] [Google Scholar]
- Experimento didático de quimiometria para análise exploratória de óleos vegetais comestíveis por espectroscopia no infravermelho médio e análise de componentes principais: um tutorial, parte I. Quim. Nova. 2012;35:223-229.
- [CrossRef] [Google Scholar]
- Infrared spectroscopy for food quality analysis and control. Infrared Spectrosc. Food Quality Anal. Control 2009
- [CrossRef] [Google Scholar]
- A rapid FT-NIR method for estimation of aflatoxin B1 in red chili powder. Food Control. 2009;20:840-846.
- [CrossRef] [Google Scholar]
- Determination of quality attributes in wax jambu fruit using NIRS and PLS. Food Chem.. 2016;190:1-4.
- [CrossRef] [Google Scholar]
- UV–Vis and ATR–FTIR spectroscopic investigations of postmortem interval based on the changes in rabbit plasma. PLoS One. 2017;12 e0182161
- [CrossRef] [Google Scholar]
- Williams, P., Norris, K., 2001. Near Infrared Technology in the Agricultural and Food Industries, Near-infrared technology in the agricultural and food industries, second edition.
- Valuing pollination services to agriculture. Ecol. Econ.. 2011;71:80-88.
- [CrossRef] [Google Scholar]
- Polyphenol profile by UHPLC-MS/MS, anti-glycation, antioxidant and cytotoxic activities of several samples of propolis from the northeastern semi-arid region of Brazil. Pharm. Biol.. 2017;55:1884-1893.
- [CrossRef] [Google Scholar]
- Enhanced antioxidant activity and in vitro release of propolis by acid-induced aggregation using heat-denatured zein and carboxymethyl chitosan. Food Hydrocoll.. 2018;81:104-112.
- [CrossRef] [Google Scholar]


