

Translate this page into:
Fish as bio indicators to determine the effects of pollution in river by using the micronucleus and alkaline single cell gel electrophoresis assay
⁎Corresponding author at: Department of Zoology, College of Science, King Saud University, PO Box 2455, Riyadh 11451, Saudi Arabia. aalidaoud@ksu.edu.sa (Daoud Ali)
-
Received: ,
Accepted: ,
This article was originally published by Elsevier and was migrated to Scientific Scholar after the change of Publisher.
Peer review under responsibility of King Saud University.
Abstract
Objectives
The unpolluted freshwater is an essential ingredient for the healthy life of animals and humans. Aquatic pollution is the most important problem for living organisms. The main source of water pollution is industrial sewages. In the current study bioaccumulation and genotoxic effects of different metals e.g. Pb, Cd, Cr, Cu were determined in various tissues of Puntius sophore (P. sophore).
Methods
The water sample and fish P. sophore were brought from different sites of the Gomati river (coordinates: 25°30′29″N 83°10′11″E), India. The heavy metals in water and fish tissues were determined by using ICP-MS. The mutagenic and genotoxic potential of the river water in P. sophore were evaluated using micronucleus and single-cell gel electrophoresis techniques.
Results
We have observed that the concentration of heavy metals (Pb, Cd, Cr, Cu) in the river water and bioaccumulation of these metals in P. sophore are equal in order. Thus it was confirmed that fish act as a sentinel indicator of metal pollution of the surrounding environment. The formation of micronuclei, as well as fragmentation of DNA, were significantly increased (p < 0.05, 0.01) in river fish as compared to the control.
Conclusions
Thus we might consider the fish for biomonitoring of aquatic ecosystems. Also, these findings confirmed that water of the Gomati river was contaminated with heavy metals. So, it is important to prevent the inflow of domestic and industrial sewage in the river.
Keywords
ICP-MS
Puntius sophore
Heavy metals
DNA Damage
Micronucleus assay

1 Introduction
The water of rivers is contaminated due to anthropogenic activities, domestic waste, industrial effluents, and other pollutants which adversely impacted the aquatic biotas, human and animal healths. Nowadays the main source of pollution is wastewater form plastic, tanneries, mining, and cement industries (Lahiry, 2017). As a consequence, these industrial pollutants enter into the aquatic ecosystem (Environment Agency, 2013). Many types of pollutants showed mutagenic and clastogenic properties (Waters et al., 1999; Tchounwou et al., 2012). The toxic heavy metals discharged in the environment are zinc, copper, nickel, mercury, cadmium, lead, and chromium (Fu and Wang, 2011). Heavy metals pollution is considered to be a serious world problem (Islam et al., 2014) due to bioaccumulation and bio magnifications in the food web and trophic level (Zhou et al., 2004; Sharma et al., 2007). Fish act as a biological indicator of water quality (Al-Ghanim et al., 2016) because of their affinity to accumulate the metals in their muscles (Zhao et al., 2012) that cause alterations in physiological, biochemical and genetic parameters in their body (Javed and Usmani, 2017). Andrade.
The river Gomati is a branch of the largest river Ganges of the Indian sub-continent (Welcomme, 1985). The Gomati rivers are the main source of water in Lucknow metro city. Recently some researchers reported bioaccumulation of metals in flora and fauna, contamination waters exerted dangerous effects on aquatic biota and human health (Gupta et al., 2009; Vaseem and Banerjee, 2013). Heavy metals (Cr, Cd, Pb, As) pollution was a many-fold increase in river Ganga water (Paul, 2017). The consumption of contaminated fish can pose harmful effects on human health (Puel et al., 1987). Andrade et al. (2004) documented that fish could be as a biological demonstrator for contamination of river water using the genotoxic test. Comet and micronucleus tests are simple and sensitive biomarkers to detect the genotoxic and mutagenic characteristics of pollutants (Ali et al., 2008). The present situation demands to investigate the current status of heavy metals accumulation in water and fish of the river Gomati. Therefore, freshwater fish P. sophore was used as a bioindicator/ biomarker for aquatic pollution to detect the genotoxic potential of river water.
2 Materials and methods
2.1 Collection of fish
We have collected the total 30 specimens of Puntius sophore (Hamilton, 1822)] striped dwarf catfish using cast and drag nets with the help of fisherman form five locations of Gomati rivers at Lucknow region (26°52′N 80°07′E), during the period of May-June 2019. The samplings were done twice in a month. A total of 30 specimens were collected at a rate of 5 fish from each site. The details of the river are given in Fig. 1 (Tangri et al., 2018), and Table 1 (Gupta and Tripathi, 2017). The collected fish were washed with water; total length (cm) and body weight (g) of the fish were taken using scale and electronic balance respectively Table 3. The fish were dissected out with the help of a sharp knife to take out the 3 g of dorsal muscle tissue from each individual of sample fish and placed in polythene bags which were properly marked with the specimen number and stored in the freezer at −80 °C for further analysis.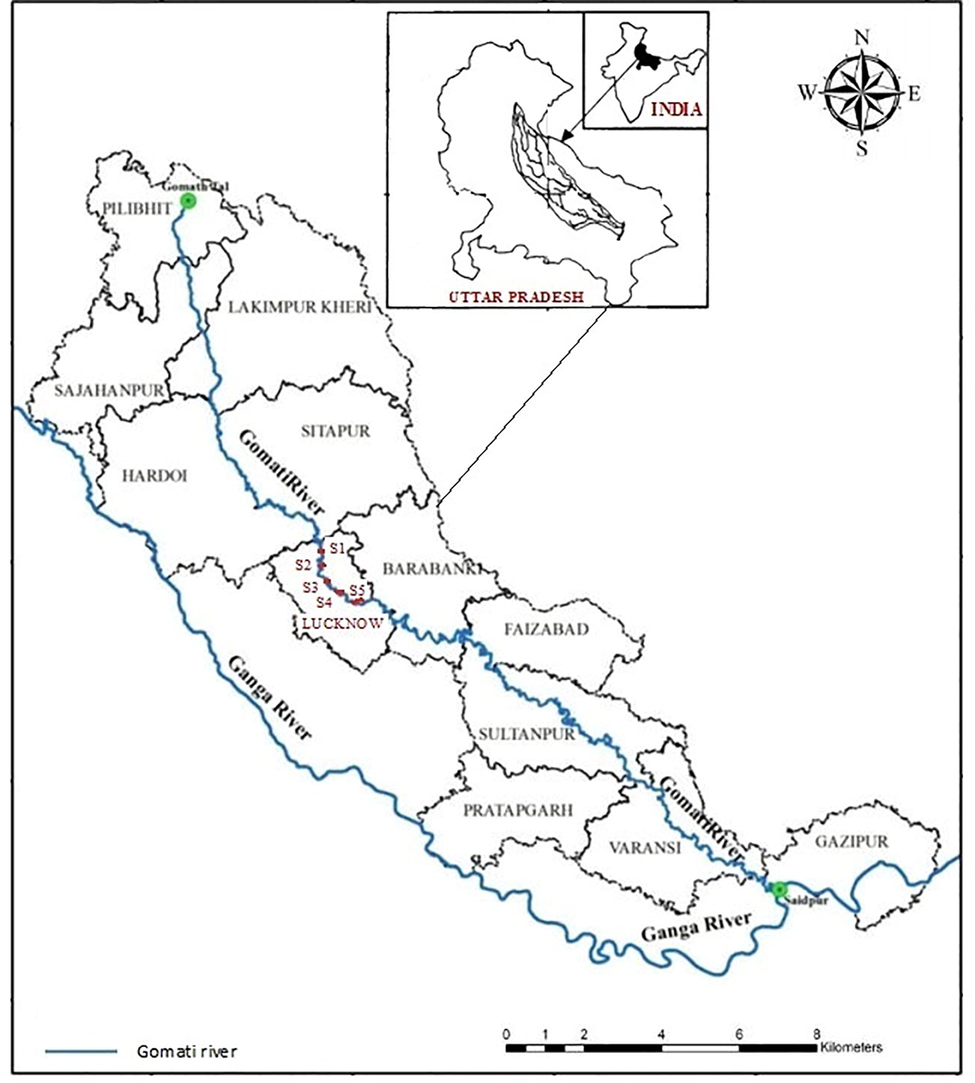
Sampling sites of water, fish P. sophore in river Gomti in Lucknow metro city. The figure was taken and redrawn from Map of India.
Sampling sites
Sampling sites
Latitude and longitude of the sampling sites
S1
Pipa pul ghat
26.8871°N 80.9006°E
S2
Kuriyan Ghat
26.8741°N 80.9119°E
S3
Pakka Pul Ghat
26.8727°N 80.9162°E
S4
Saheed Smarak Ghat
26.8634°N 80.9286°E
S5
Gomati Barrage
26.8555°N 80.9694°E
2.2 Determination of physicochemical parameters
The fishes and water were collected all together at the time of sampling. The water was collected from five sites of the river such as S1, S2, S3, S4, and S5 (Table 1) (35 cm below the surface of the water) in a brown color dark bottle for DO analysis and transparent glass bottles for other parameters and the metal analysis. The physicochemical parameters such as conductivity (µmho/cm), pH, dissolved oxygen (DO) (mg/l), hardness (mg/l), total dissolved solids (TDS) (mg/l) were examined using standard methods as described by APHA (2005).
2.3 Tissue preparation for metal analysis
The tissue was homogenized, weighed, and dried at 80 °C in Petri-plate for 48 hrs, and after cooling it was homogenized into a very fine powder. The tissue 500 mg were digested using HNO3 (2.0 ml), H2O2 (1.0 ml), and H2O (3.0 ml). The clear solution obtained was cooled and diluted with Milli-Q water.
2.4 Estimation of heavy metals by ICP-MS
These metals such as cadmium (Cd), lead (Pb), chromium (Cr) and copper (Cu) in water and tissue samples were determined by ICP-MS (Optima 8000, Perkin Elmer) in triplicates. The standards were prepared from stock solutions of considered elements at the rate of 1000 mg/l concentration procured from Perkin Elmer (USA). Simultaneously the blanks were used in each set of analyses for confirmation. The used absorption wavelengths (λ) for analysis of Pb, Cu, Cr, and Cd were 220.35 nm, 327.39 nm, 267.71, and 214.43 nm respectively and the minimum detection limit was 0.5 ppb for all the elements. The results obtained were quantified using calibration curves of different elements. The concentrations of the above metals were expressed as milligrams per liter (mg/l) and milligrams per kilogram (mg/kg) for water and tissue respectively.
2.5 Micronucleus (MN) assay
After sampling the specimens, the MN assay was carried out as described by Ali et al. (2009).
The formula for calculation of MN:
2.6 Geno toxicity assay
The genotoxicity of the effect of heavy metal in polluted water was evaluated by determining DNA damage in lymphocytes, gills, and muscle fish samples by comet technique as described by Ali et al. (2009).
2.7 Statistical analysis
The data was statistically calculated using ANOVA for the average concentration of metals in water and fish and fragmentation of DNA of different sites of river. The significant probability level was set as less than 0.05 and 0.01.
3 Results
3.1 Physico-chemical parameters and concentration of heavy metals
The physicochemical parameters such as pH, DO, hardness, conductivity, and TDS of experimental river water pf different sites were analyzed and details are listed in Table 2.
Site name
Physicochemical parameters
Values
S1
Temperature
24 ± 2 °C
pH
7.90 ± 1.0
DO
6.8 ± 1.80 mg/l
TDS
232.5 ± 3.20 mg/l
Total Hardness
252.0 ± 3.0 mg/l
Total Conductivity
441 ± 4.0 µmho/cm
S2
Temperature
23.5 ± 1.5 °C
pH
7.80 ± 1.20
DO
5.60 ± 2.40 mg/l
TDS
238.42 ± 4.20 mg/l
Total Hardness
255.0 ± 5.0 mg/l
Total Conductivity
440 ± 2.0 µmho/cm
S3
Temperature
24 ± 1 °C
pH
7.87 ± 1.6
DO
4.80 ± 1.60 mg/l
TDS
242.7 ± 5.40 mg/l
Total Hardness
265.0 ± 6.0 mg/l
Total Conductivity
438 ± 5.0 µmho/cm
S4
Temperature
23.8 ± 2.4 °C
pH
7.88 ± 1.2
DO
5.10 ± 2.20 mg/l
TDS
241.4 ± 3.90 mg/l
Total Hardness
255.0 ± 2.0 mg/l
Total Conductivity
440 ± 3.0 µmho/cm
S5
Temperature
24.2 ± 1 °C
pH
7.90 ± 1.0
DO
4.55 ± 1.40 mg/l
TDS
244.5 ± 7.10 mg/l
Total Hardness
261.0 ± 4.0 mg/l
Total Conductivity
437 ± 4.0 µmho/cm
The metals bioaccumulation in muscle tissue of P. sophore fish and water from different sites of river Gomati are listed in Table 3. The Cd was present in less concentration in all sites of water samples in the present study (Table 4). The concentrations sequence of heavy metals fish muscles and in water were found as Pb > Cr > Cu > Cd (Table 4). Metals concentrations in fish tissue and water sample procured from different sites were observed as significant (p < 0.05) among sites (Table 4). The bioaccumulation of Pb and Cd were also highest and lowest respectively from the samples of the fish collected from different sites and the same sequence (Pb > Cr > Cu > Cd) of metal accumulation was detected out as found in the water samples Table 4. Symbol: L = length, W = weight.
Sites
Sample quantity
L (cm)
W (g)
Regression equation
Gomati river
50
5–17
10–50
−1.471 ± 2.378 Log L
Sampling sites
Heavy metals
Concentration of metals in water sample (mg/L)
Concentration metals in muscle tissue (mg/kg)
S1
Pb
0.34 ± 0.10
0.28 ± 0.21
Cd
0.018 ± 0.05
0.014 ± 0.07
Cr
0.22 ± 0.78
0.20 ± 0.40
Cu
0.201 ± 0.75
0.18 ± 0.12
S2
Pb
0.40 ± 0.19
0.35 ± 0.20
Cd
0.027 ± 0.20
0.016 ± 0.22
Cr
0.34 ± 0.26
0.35 ± 0.80
Cu
0.111 ± 0.38
0.098 ± 0.26
S3
Pb
0.36 ± 0.72
0.31 ± 0.40
Cd
0.020 ± 0.13
0.011 ± 0.40
Cr
0.25 ± 0.11
0.23 ± 0.36
Cu
0.107 ± 0.17
0.41 ± 0.30
S4
Pb
0.38 ± 0.12
0.34 ± 0.10
Cd
0.023 ± 0.17
0.014 ± 0.22
Cr
0.29 ± 0.09
0.30 ± 0.28
Cu
0.110 ± 0.62
0.46 ± 0.24
S5
Pb
0.49 ± 0.29
0.44 ± 0.39
Cd
0.030 ± 0.52
0.022 ± 0.31
Cr
0.35 ± 0.08
0.33 ± 0.29
Cu
0.113 ± 0.18
0.52 ± 0.20
3.2 Mutagenicity
MN production in erythrocytes was observed and induction of MN was found more in fish of highly metal-contaminated sites (Fig. 2 a). The effect of contamination of metals on MN production was according to sampling sites. The frequency of MNi obtained in this study is shown in Fig. 2 a. The correlation of frequency of MNi induction and DNA damage in collected fish is shown in Fig. 2 b.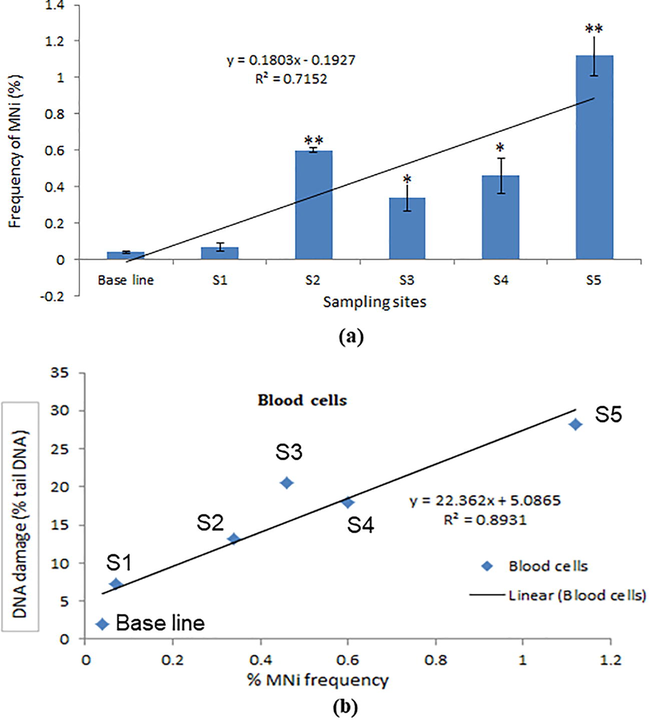
(a) Induction of MNi (%) in erythrocyte cells of freshwater P. sophore fish at different sampling sites. (b) Correlation of induction of DNA damage and MN for different sampling sites. Each value represents the mean ±SE of three experiments. *p < 0.05, **p < 0.01 vs. control.
3.3 Genotoxicity
After collecting fish from different sites of Gomati rivers the fragmentation of DNA was determined in selected tissues of P.sophore using comet assay and DNA fragmentation was found in fish according to metal bioaccumulated fish tissues (Fig. 3 a,b,c,d). We have observed the higher fragmentation of DNA was occurred in gill cells (Fig. 3a, d). A significant effect on genotoxicity was observed in metal bioaccumulated in fish (Fig. 3a-d).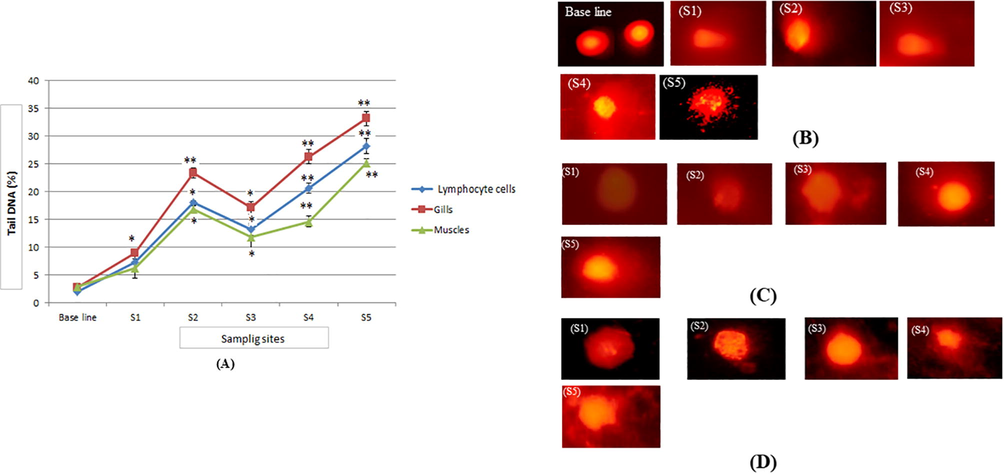
(A) DNA fragmentation in different tissues of freshwater fish P. sophore (B) Images of DNA fragmentation in lymphocyte cells (C) Images of DNA fragmentationin muscles cells (D) Images of DNA fragmentation in gills cells of P. sophore of different sampling sites. Each value represents the mean ±SE of three experiments. *p < 0.05, **p < 0.01 vs. control.
4 Discussion
Nowadays the development of rivers water pollution is increased by runoff of sewage and agricultural production into the river system (Javier et al., 2017). We have determined the concentration of metals (Pb, Cr, Cu, Cd) in inhabiting fish P.sophore and water samples of the Gomati river. The metal concentrations in muscle were lower than the consumption limit (FAO, 1983). The sequence of accumulated metals was established as Pb > Cr > Cu > Cd and it was accordance in both water samples and fish muscles collected from the same sites of river. Hashim et al. (2014) reported that metals accumulation was depended upon fish species. Also, the accumulation of metals is governed by topography, hydrology, geology, local climate, anthropogenic influence, pH, alkalinity, water hardness, season, sex, and locality in the aquatic organism (Monikh et al., 2013). There was no remarkable variation in pH of water samples but it was slightly alkaline while conductivity, DO, TDS showed variations in the water samples along with the various sites in the present study. The concentration of Pb, Cr, Cu, Cd in organism tissue, and water were found more at site S5 in comparison to other sites. Out of four metals (Pb, Cr, Cu, Cd) in water samples, Pb metals were higher to other metals at different sampling sites. Cu was highly accumulated in muscles of P. sophore and its concentration was more at site S1, S5. Cd was least accumulated heavy metal but its concentration was higher in different sites of the river. Some researchers reported that heavy metals are accumulated in river fish (Gupta et al., 2009). Generally, the mean concentration of all metals present in fish of all sites was below the permissible limit (FAO, 1983, Table 5). The mean concentration of heavy metals obtained from fish and water samples indicated that serious attention should be taken because the concentration of these metals was approaching the permissible limits. Pb is a non-essential element and can be toxic to humans when ingested or inhaled in high concentrations. Pb level in the present findings ranged from 0.28 ± 0.21 to 0.44 ± 0.39 mg/kg which is within the recommended permissible food consumption limits of hazardous substances for aquatic products. Fish being sensitive to Pb (Lagerwerff, 1972), its concentration increased in the fish muscle with the increase in concentration in the surrounding water as recorded at different sites in the river in the present study. According to Pb can cause an extreme nuisance in fish because it is responsible for the formation of mucus and cause low metabolism resulting in decreased growth and survival rate (Burger et al. (2002).
Heavy metals
Concentration (mg/kg)
Pb
2.0
Cu
50
Cr
2
Cd
0.1
Cd is a serious contaminant, highly toxic element, and the permissible limit for human consumption is 0.1 mg/kg. However, in the present study, mean concentrations of Cd ranged from 0.014 ± 0.07 to 0.022 ± 0.21 mg/kg and it was below the maximum permissible limit. Cr is a hazardous metal notified by the USFDA (1993) and the maximum permissible food consumption limits for Cr is 2 mg/kg. In this study, the Cr level is very low (0.20 ± 0.34 to 0.33 ± 0.29 mg/kg) and it due to the quick elimination of Cr through faeces from the fish body (Mishra and Mohanty, 2008). Cr is an imperative element that helps the body to use sugar, protein, and fat although excess amounts encompass adverse effects on the fish body (Akan et al., 2009). Cu is an important part of several enzymes and important for the synthesis of hemoglobin mainly in marine organisms which contains appropriate mechanisms to standardize its concentrations in their tissues (Thiyagarajan et al., 2012). The permissible food consumption limits of hazardous substances for aquatic products established a limit for Cu as 50.0 mg/kg (Table 5) and in the current study, the concentration of Cu varied between 0.18 ± 0.12–0.52 ± 0.20 mg/kg which is very low to the permissible limit. The present result is found to be in line with Stokes (1979) who pointed out that the high Cu exposure to fish in the external environment hardly shows its accumulation in the body.
The micronucleus test was an important parameter to assess the mutagenic properties of contaminants in water bodies (Dourado et al., 2017). The induction of micronuclei in river fish might be a mutagenic effect of metals of contaminated water. The micronucleus assay is a more sensitive and simple technique because it takes less time and not dependent on the karyotyping of the chromosome (Heddle et al., 1991). The induction of MNi in an aquatic organism and fish indicates the mutagenic damage and scoring of MNi is a more reliable and faster method in comparison of chromosomal aberration counting (Hartwell et al., 2000). Researchers have been reported that the genotoxic effect of environmental pollutants; pharmaceuticals could be measured by comet technique and this technique is thought of as a reliable, highly sensitive method for determining genotoxicity in prokaryotic and eukaryotic cells (Ali et al., 2008; Ullah and Zorriehzahra, 2015). So, in the current study, MNi and alkaline single cell gel electrophoresis were applied to detect a mutagenic and genotoxic effect of environmental pollutants (Andrade et al., 2004). The contamination of metals in the fish body cause alterations in condition factor and this parameter used as a biomarker of environmental pollution (Yi and Zhang, 2012; El-Serafy et al., 2013).
The present finding demonstrated Pb, Cr, Cu, Cd concentrations in fish and water may cause a dangerous effect on human’s health due to their excessive consumption. Heavy metals of polluted river water-induced mutagenic and genotoxic effects in aquatic organisms. Hence, there is an urgent need to enhance information broadcasting, monitoring programs to improve environmental protection awareness for sustainable management of river water.
Acknowledgments
The authors would like to extend their sincere appreciation to the Deanship of scientific research at King Saud University for its funding of this research through the Research Group Project no RG-1435-076.
Declaration of Competing Interest
The authors declare that they have no known competing financial interests or personal relationships that could have appeared to influence the work reported in this paper.
References
- Bioaccumulationof some heavy metals of six fresh water fishes caught from Lake Chad in Doron Buhari, Borno State, Nigeria. J. Appl. Sci. in Environ. Sanit.. 2009;4:103-114.
- [Google Scholar]
- Monitoring of trace metals in tissues of Wallago attu (lanchi) from the IndusRiver as an indicator of environmental pollution. Saudi J. Biol. Sci.. 2016;23:72-78.
- [Google Scholar]
- Assessment of genotoxic and mutagenic effects of chlorpyrifos in freshwater fish Channa punctatus (Bloch) using micronucleus assay and alkaline single-cell gel electrophoresis. Food Chem. Toxicol.. 2009;47:650-656.
- [Google Scholar]
- Genotoxicity assessment of acute exposure of chlorpyrifos to freshwater fish Channa punctatus (Bloch) using micronucleus assay and alkaline single-cell gel electrophoresis. Chemosphere. 2008;71(10):1823-1831.
- [Google Scholar]
- Fish as bioindicators to assess the effects of pollution in two southern Brazilian rivers using the Comet assay and micronucleus test. Environ. Mol. Mutagen. 2004;44:459-468.
- [Google Scholar]
- Standard Methods for the Examination of Water and Wastewater (22nd ed.). Washington: American Public Health Association, New York, USA; 2005. p. :1360.
- Metal levels in fish from the Savannah River: potential hazards to fish and other receptors. Environ. Res. A.. 2002;89:85-97.
- [Google Scholar]
- Genotoxic and mutagenic effects of polluted surface water in the midwestern region of Brazil using animal and plant bioassays. Genet. Mol. Biol.. 2017;40(1):123-133.
- [Google Scholar]
- Effect of Dietborne Cu and Cd on Body Indices of Nile Tilapia (Oreochromis niloticus) with Emphasis on Protein Pattern. Turkish J. Fisheries Aquatic Sci.. 2013;13:593-602.
- [Google Scholar]
- Environment Agency, 2013. What is Inland Oil Pollution? Key Issues as the Environment Agency Sees It [Online]. Available at www.environment-agency.gov.uk/research/library/position/41233.aspx (accessed 6 June 2013).
- FAO (Food and Agriculture Organization), 1983. Compilation of legal limits for hazardous substances in fish and fishery products, FAO Fishery Circular No. 464, pp. 5–100.
- Removal of heavy metal ions from wastewaters: a review. J. Environ. Manage.. 2011;92:407-418.
- [Google Scholar]
- Analysis of some heavy metals in the riverine water, sediments and fish from river Ganges at Allahabad. Environ. Monit. Assess.. 2009;157:449-458.
- [Google Scholar]
- Present status and diversity of ichthyofauna at five selected sites of the Gomti River, Lucknow (India) IJFBS. 2017;4(1):49-56.
- [Google Scholar]
- Hartwell, L.H., Hood, L., Goldberg, M.L., Reynolds, A.E., Silver, L.M., Veres, R.C., 2000. Genetics: from genes to genomes. McGraw Hill Higher Education, pp. 70–98, 144–169, 179–182, 341–351 144–169, 179–182, 341–351.
- Determination of heavy metal levels in fishes from the lower reach of the Kelantan River, Kelantan, Malaysia. Trop. Life Sci. Res.. 2014;25(2):21-39.
- [Google Scholar]
- Micronuclei as an index of cytogenetic damage: past, present and future. Environ. Mol. Mutagen. 1991;18:277-291.
- [Google Scholar]
- Arsenic and lead in foods: a potential threat to human health in Bangladesh. Food Addit. Contam. Part A. 2014;31:1982-1992.
- [Google Scholar]
- Javed, M., Usmani N., 2017. An Overview of the Adverse Effects of Heavy Metal Contamination on Fish Health. Proc. Natl. Acad. Sci., India, Sect. B Biol. Sci., doi: 10.1007/s40011-017-0875-7.
- Javier, M.S., Sara, M.Z., Turral, H., Burke, J., 2017. Water pollution from agriculture: a global review. Food and Agriculture Organization of the United Nations Rome, http://www.fao.org/3/a-i7754e.pdf.
- Lagerwerff, J.V., 1972.Lead, mercury, and cadmium as environmental contaminants. In: Mortvedt, J.J., Giordano, P.M., Lindsay, W.L., (Eds.) Micronutrients in Agriculture. Soil Science Society of America, Madison, Wisconsin, pp. 619–628.
- Lahiry, S., 2017. Environmental concern amidst industrialization, Down to Earth, 14 March 2017.
- Acute toxicity impacts of hexavalent chromium on behavior and histopathology of gill, kidney and liver of the freshwater fish, Channa punctatus (Bloch) Environ. Toxicol. Pharmacol.. 2008;26:36141.
- [Google Scholar]
- The relationship between heavy metal (Cd Co, Cu, Ni and Pb) levels and the size of benthic, benthopelagic and pelagic fish species, Persian Gulf. Bull. Environ. Contam. Toxicol.. 2013;90:691-696.
- [Google Scholar]
- Research on heavy metal pollution of river Ganga: a review. Ann. Agra. Sci.. 2017;15:278-286.
- [Google Scholar]
- Statistical assessment of a sampling pattern for evaluation of changes in mercury and zinc concentration in Patella coerulea. Bull. Environ. Contam. Toxicol.. 1987;38:700-706.
- [Google Scholar]
- Heavy metals contamination of soil and vegetables in suburban areas of Varanasi, India. Ecotoxicol. Environ. Saf.. 2007;66:258-266.
- [Google Scholar]
- Stokes, P.M., 1979. Copper accumulation in freshwater biota. In: Nriagu, J.O., (Ed.) Copper in the environment. Wiley and Sons Inc., New York, pp. 357–381.
- Tangri, A.K., Kumar, D., Singh, D.S., Dubey, C.A., 2018. The Gomati River: Lifeline of Central Ganga Plain. In: Singh, D.S., (Ed.), The Indian Rivers, Springer Hydrogeology, pp. 135–150, doi: 10.1007/978-981-10-2984-4_11.
- Metals in Fish along the Southeast Coast of India. Bull. Environ. Contam. Toxicol.. 2012;88:582-588.
- [Google Scholar]
- Ecotoxicology: a review of pesticides induced toxicity in fish. Adv. Anim. Vet. Sci.. 2015;3(1):40-57.
- [Google Scholar]
- USFDA, 1993. Food and Drug Administration. Guidance document for chromium in Shellfish. DHHS/PHS/FDA/CFSAN/Office of Seafood, Washington, DC.
- Contamination of the River Ganga and its toxic implication in the blood parameters of the major carp Labeo rohita (Ham) Environ. Sci. Pollut. Res.. 2013;20:5673-5681.
- [Google Scholar]
- Genetic toxicology data in the evaluation of potential human environmental carcinogens. Mutat. Res.. 1999;437:21-49.
- [Google Scholar]
- Welcomme, R.L., 1985. River Fisheries, Food and Agriculture Organization, Technical paper 262, Rome, Italy.
- Heavy metal (Cd, Cr, Cu, Hg, Pb, Zn) concentrations in seven fish species in relation to fish size and location along the Yangtze River. Environ. Sci. Pollut. Res.. 2012;19:3989-3996.
- [Google Scholar]
- Role of living environments in the accumulation characteristics of heavy metals in fishes and crabs in the Yangtze River Estuary, China. Mar. Pollut. Bull.. 2012;64:1163-1171.
- [Google Scholar]
- Ecotoxicology: Principles and Methods. Beijing: Science Press; 2004. p. :161-217.


