

Translate this page into:
First reports of associations between spectral properties, chlorophyll, bacterial and zooplankton in two Chilean north Patagonian lakes (Villarrica and Caburgua, 38° S, Araucania region, Chile)
⁎Corresponding author at: Departamento de Ciencias Biológicas y Químicas, Facultad de Recursos Naturales, Universidad Católica de Temuco, Casilla 15-D, Temuco, Chile. prios@uct.cl (Patricio De los Rios-Escalante)
-
Received: ,
Accepted: ,
This article was originally published by Elsevier and was migrated to Scientific Scholar after the change of Publisher.
Peer review under responsibility of King Saud University.
Abstract
The Chilean Patagonian lakes are characterized by their marked oligotrophic or oligomesotrophic status and low zooplankton species abundances, many of these lakes with oligomesotrophic status is associated to human intervention due towns in their shores. The aim of the present study was determine the relations between spectral properties (LANDSAT/OLI), chlorophyll and plankton abundances in two north Patagonian lakes, Villarica, that has two towns in its shore, and Caburgua, that has native forest in its shores as basis of environmental pollution monitoring tools. The results revealed that Villarica lake has high reflectances in near infrared, red and green bands, high chlorophyll (a, b and c) concentrations, and high bacterial and plankton abundances, whereas Caburgua lakes has low reflectance in the same bands, and low chlorophyll concentrations, low bacterial and plankton abundances, with exception to high mixotrophic ciliates. The obtained results agree with limnological observations about both lakes, and the comparison with spectral properties agree with similar observations for glacial north Patagonian lakes about spectral properties and zooplankton community.
Keywords
Patagonian lakes
Plankton
Mixotrophic
Chlorophyll
Spectral properties

1 Introduction
The Patagonian lakes are located close to Andes mountains between 38 and 51° S in Argentina and Chile, and are characterized by their glacial and/or volcanic origin, marked oligotrophy and low zooplankton species richness (Soto and Zúñiga, 1991; Modenutti et al., 1998; Woelfl, 2007; De los Ríos-Escalante, 2010).
Some of these lakes, in Chile have marked human interventions in their surrounding basins, due agriculture or forestry activities, and tows in their shores (Soto and Campos, 1995; Oyarzún et al., 1997; Soto, 2002; De los Ríos-Escalante et al., 2017). These alterations, due replacement of native forest with agriculture, forestry and towns, generate increase of nutrients inputs from the basin to the lake with consequent chlorophyll increase in some specific sites of the lake, such as small bays (Campos et al., 1983; Soto, 2002; Woelfl et al., 2003; De los Ríos-Escalante et al., 2017). This situation was reported too for Llanquihue lake (41° S, Chile), where it was described chlorophyll and nutrients variations concentrations in groups of sites with towns, aquaculture activities and non-altered (Soto, 2002), that was supported with zooplankton data (De los Ríos-Escalante et al., 2017).
On the basis of exposed antecedents, the objective is the use of remote sensing techniques and its relations with trophic statis in Chilean North Patagonian lakes. The use of remote sensing for Chilean Patagonian lakes and its relations with temporal trophic status were described for Riñihue lake (De los Ríos-Escalante et al., 2018), this lake has data from two decades, where it was described transition from oligotrophy to mesotropy (Campos et al., 2001; Woelfl, et al., 2003). Also, De los Ríos-Escalante et al. (2013); De los Ríos-Escalante and Acevedo (2016a); (2016b;), described relations between zooplankton community and spectral variations due coloured glacial sediments in different sites in Chilean central Patagonian lakes, it is because the kind of zooplankton community can be indicator of trophic state in lakes, in Patagonian lakes under oligotrophic status have zooplankton community with low species number and individual abundance (Woelfl, 2007). The aim of the present study is do a first descriptions of spectral properties, chlorophyll (a, b, c) concentrations, bacterial and plankton abundances in two northern Patagonian lakes one with marked human intervention (Villarrica) and the second with low human intervention (Caburgua), using LANDSAT/OLI, considering that it is a relatively easy access and management satellite image De los Ríos-Escalante et al. (2013); De los Ríos-Escalante and Acevedo (2016a); (2016b;).
2 Material and methods
Study sites: lake Caburgua is located in Andes mountains in Araucania region, its surrounding basin has perennial native forest with mountains, and very few human altered zones, this lake is oligotrophic with marked mixotrophic Stentor protozoa abundances (Woelfl et al., 2010, Table 1, Fig. 1). Lake Villarrica is located at west of Caburgua lake, its surrounding basin is characterized by the presence of Villarrica and Pucon towns, small recreational residences at south, native forest at north, and the presence of Villarrica volcano (Table 1, Fig. 1).
Villarrica lake
Caburgua lake
North littoral
Centre
Villarrica port
Pucon bay
Site 1
Site 2
Site 3
Site 4
Geographical location
39°12′40.3′' S; 72°08′26.9′'W
39°14′39.2′' S; 72°08′06.3′'W
39°16′05.5′'S; 72°23′29.1′'W
39°16′33.7′'S; 71°59′47.5′'W
39°09.43.8′'S; 71°47′41.0′'W
39°10′14.0′'S; 71°47′47.2′'W
39°10′41.5′'S; 71°47′52.8′'W
39°11′10.2′'S; 71°47′58.7′'W
Band 01
0.108
0.104
0.104
0.104
0.099
0.097
0.096
0.097
Band 02
0.084
0.081
0.081
0.082
0.078
0.074
0.074
0.075
Band 03
0.058
0.054
0.055
0.056
0.049
0.051
0.048
0.053
Band 04
0.029
0.026
0.028
0.027
0.030
0.028
0.025
0.030
Band 05
0.014
0.013
0.013
0.012
0.020
0.012
0.012
0.012
Band 06
0.006
0.004
0.004
0.004
0.011
0.003
0.003
0.004
Band 07
0.004
0.002
0.003
0.003
0.006
0.002
0.002
0.003
Temperature (°C)
13.27
14.00
13.90
14.30
16.55
16.20
15.65
15.75
Ph
8.30
7.61
7.47
7.57
7.47
7.26
7.24
7.42
TDS (mg/L)
38.68
38.68
38.68
39.65
23.40
22.75
22.75
22.75
Conductivity (μS/cm)
44.00
44.15
44.60
45.25
27.70
27.50
27.30
27.20
AMR (CFU)
3.50
5.50
13.50
17.00
10.50
5.00
4.00
18.50
TC (CFU)
13.25
17.00
23.00
60.50
9.00
0.00
2.00
1.00
FC (CFU)
4.00
2.00
7.50
14.00
0.00
0.00
0.00
0.00
Chl a (μg/L)
2.11
1.52
5.04
1.19
0.54
0.64
0.88
0.45
Chl b (μg/L)
3.33
1.06
6.79
1.08
0.22
0.53
0.79
0.55
Chl c (μg/L)
1.15
0.80
1.75
1.45
0.49
1.22
1.44
2.30
Carotenoids (μg/L)
0.34
0.55
0.38
0.54
0.07
0.07
0.04
0.10
Margalef index
1.46
1.48
0.98
2.58
2.94
2.71
2.09
3.39
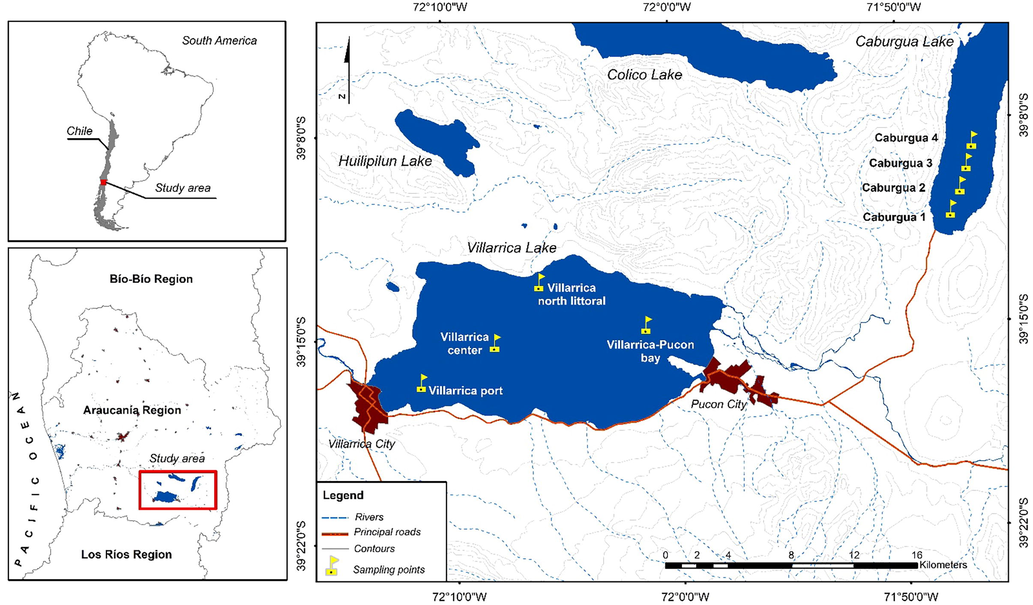
Map of included sites in the present study (source: Google Earth; https://www.google.cl/maps/@-39.17049,-71.9648815,36996m/data=!3m1!1e3!5m2!1e1!1e4 Accessed: 25th September 2019).
Sampling procedures: both sites were visited between November 2018 and January 2019 that is the period with maximum zooplankton abundances (Wölfl, 1995). For Caburgua lake, four sites were sampled in a transect of 4 km at north of the lake (Fig. 1), whereas for Villarrica lake it considered two bays with towns (Villarrica and Pucon), one site at center of the lake, and the fourth site in the northern shore of the lake where there is native forest (Fig. 2). For each site was measured in situ temperature, pH, total dissolved solids using sensor YSI Pro Plus, at surface, concentration of total bacteria and coliform bacteria (TC), were taken at surface in sterile bottles, incubated at cold storage from field works to laboratory (2–4 h), these were quantified in according to APHA (1989), and expressed in colonies forming units. Chorophyll a, b and c samples were analysed using acetone extraction (Strickland and Parsons, 1972), whereas mixotrophic ciliates were quantified and identified in according to Woelfl and Geller (2002). Finally the zooplankton samples were collected by vertical hauls (20 m to surface) of plankton net (20 cm diameter and 30 μm mesh size), zooplankton specimens were identified in according to Araya and Zúñiga (1985); Reid (1985) and Bayly (1992) and quantified.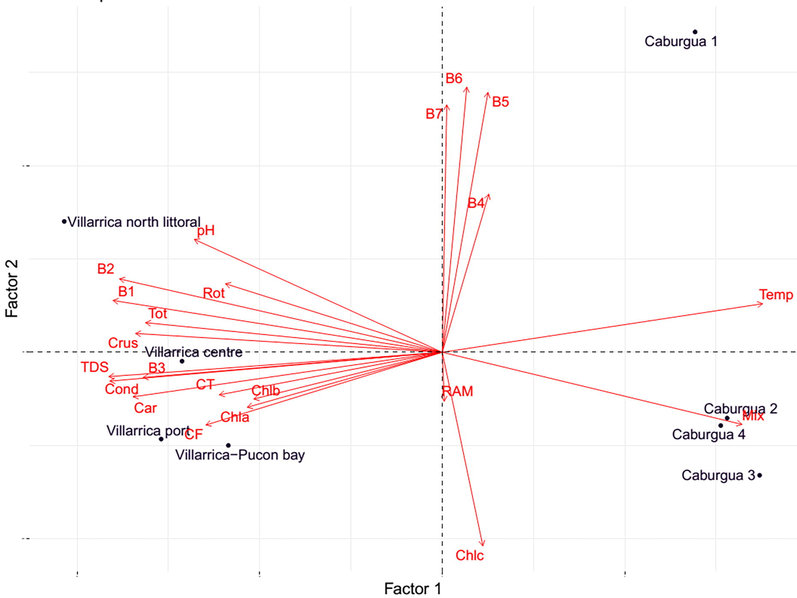
PCA results for variables and sites considered in the present study.
The spectral properties were obtained from satellite LANDSAT/OLI, it got from Land Processes Distributed Active Archive Center (LP DAAC) from U.S. Geological Survey (http://LPDAAC.usgs.gov). The visible light bands, near and medium infrared were calibrated radiometrically to spectral irradiance and to a reflectance using atmospheric correction (Table 1, De los Ríos-Escalante et al., 2017).
Exploratory multivariate data analysis: all data analysis was applied using software “R” (R Development Core Team, 2009). As first step, data analysis a first step was applied a matrix correlation analysis using Hmisc R package, (Harrell, 2016) for determine the associations between studied variables. As second step a principal component analysis (PCA), this statistical analysis was applied HSAUR package (Everitt and Hothorn, 2016), factoextra (Kassambara and Mundt, 2017) and ggplot2 (Wickham, 2009) R packages.
Null model in ecology data analysis: according to the view point of null models, that means the absence of regulator factors in community structure, this mean in determine the random presence or absence in community structure (Gotelli and Graves, 1996), on this view point, it was considerer two kind of null models: species co-occurrence and niche sharing.
A species presence/absence matrix was constructed, with the species in rows and the sites in columns. First, we calculated a Checkerboard score (“C-score”), which is a quantitative index of occurrence that measures the extent to which species co-occur less frequently than expected by chance (Gotelli, 2000). A community is structured by competition when the C-score is significantly larger than expected by chance (Gotelli, 2000; Tondoh, 2006; Gotelli and Entsminger, 2009; Tiho and Josens, 2007). It compared co-occurrence patterns with null expectations via simulation. Gotelli and Ellison (2013) suggested the as statistical null models Fixed-Fixed: in this model, the row and column sums of the matrix are preserved. Thus, each random community contains the same number of species as the original community (fixed column), and each species occurs with the same frequency as in the original community (fixed row). The null model analyses were performed using the package EcosimR (Gotelli and Ellison, 2013; Carvajal-Quinteroet al., 2015).
For niche overlap analysis was built an individual matrix in which rows and columns represented species and sites respectively and it was tested if niche overlap significantly differed from the corresponding value under the null hypothesis (in example random assemblage), it was applied for data of the second field period. It used Pianka index. This model is based in median table that show the probability in that the niche sharing is compared with the niche overlap of the community simulated (Gotelli and Graves, 1996). The niche amplitude can be retained or reshuffled, when it is retained it preserves the specialization of each species, whereas when it is reshuffled normally it used a more wide utilization gradient and in fact, it will occurs a wide niche overlap in the simulated community in comparison to the real community. Also, the zero states are retained or simulated the zero participation in the observed matrix is maintained or not in each simulated matrix. In the present study it used the algorithm RA3 (Gotelli and Ellison, 2013; Carvajal-Quinteroet al., 2015). The model RA3 retains the amplitude and reshuffled the zero conditions (Gotelli and Entsminger, 2009). This null model analysis was carried out using the software EcosimR (Gotelli and Ellison, 2013; Carvajal-Quinteroet al., 2015).
3 Results
The results revealed that Caburgua lake has low chlorophyll concentrations (Table 1), and low bacterial and zooplankton species richness, but high mixotrophic protozoa abundances, and low reflectance, whereas Villarrica lake was a markedly opposite situation, with high reflectance, high values of chlorophyll concentration, bacteria and species richness (Table 2).
Villarrica lake
Caburgua lake
North littoral
Centre
Villarrica port
Pucon bay
Site 1
Site 2
Site 3
Site 4
Mixotrophic ciliates
Ophyrydium naumanni
0.00
0.00
0.00
0.00
2.00
2.50
7.00
6.50
S. amethystinus
0.00
0.00
0.00
0.00
1.00
2.50
3.50
3.00
S. araucanus
0.00
0.00
0.00
0.00
1.50
2.50
2.50
5.00
Phytoplankton
Non-indentified phytoplankton
0.00
0.00
0.00
0.00
23.89
18.55
39.81
34.24
Bacillariophyta (non indentified)
0.00
62.91
330.27
547.30
5.25
5.25
0.00
0.00
Pyrrophyta (non indentified)
679.41
131.12
0.00
698.28
0.00
0.00
0.00
0.00
Chlorophyta (non indentified)
38137.14
28648.27
221247.15
34470.39
0.00
0.00
0.00
0.00
Volvox sp
0.00
0.00
0.00
0.00
1.78
1.33
1.70
0.65
Rotifera
Pompolix sp.
0.00
0.00
0.00
0.00
0.00
0.00
0.01
0.00
Synchaeta sp.
0.00
0.00
0.00
0.00
0.00
0.00
0.00
0.00
Asplachna sp.
0.09
0.09
0.05
0.19
0.00
0.00
0.00
0.00
Brachionus sp.
0.00
0.00
0.00
0.00
0.00
0.00
0.00
0.00
Euchalanis sp.
0.00
0.00
0.00
0.00
0.00
0.00
0.00
0.00
Crustacea
Diaphanosoma chilense
0.11
0.07
0.05
0.07
0.00
0.00
0.00
0.00
Daphnia spp. (juvenile)
0.07
0.01
0.00
0.02
0.00
0.00
0.00
0.00
Ceriodaphnia dubia
0.30
0.12
0.07
0.14
0.00
0.00
0.00
0.00
Chydorus sphaericus
0.01
0.00
0.00
0.00
0.00
0.00
0.00
0.00
Alona sp. (juvenile)
0.00
0.00
0.00
0.00
0.00
0.00
0.00
0.00
Neobosmina chilensis
0.00
0.00
0.00
0.00
0.00
0.01
0.09
0.10
Boeckella gracilipes
0.09
0.08
0.00
0.00
0.00
0.00
0.00
0.00
Tumeodiaptomus diabolicus
0.54
0.50
0.21
0.34
0.00
0.00
0.00
0.00
Mesocyclops araucanus
0.10
0.04
0.00
0.09
0.00
0.00
0.00
0.00
Calanoids copepodites
5.41
0.60
0.12
1.41
0.00
0.00
0.00
0.00
Cyclopoids copepodites
0.00
0.04
0.07
0.07
0.00
0.00
0.00
0.00
Nauplius
0.14
0.79
0.22
0.41
0.00
0.00
0.00
0.00
The results of correlation matrix revealed direct significant correlations between B1 reflectance with Rotifers, Crustacean and total species, carotenoids, conductivity, total dissolved solids, pH and temperature, reflectance of Band 2 with crustaceans and total species number, carotenoids, conductivity, total dissolved solids, pH and temperature, reflectance of Band 3 (Table 3). Reflectance of Band 3 was directly associated with crustaceans and total species number, carotenoids, conductivity, total dissolved solids, pH and temperature, reflectance of B5 with reflectance of bands B6 and B7, reflectance of band B6 with reflectance of band B7, temperature with total mixotrophic abundance, total dissolved solids with crustacean and total species number (Table 3). pH was directly related with crustacean and total species number, conductivity with crustacean and total zooplankton species number, carotenoids, total coliforms, faecal coliforms and total dissolved solids, conductivity with Crustacean and Total zooplankton species number (Table 3). Also direct associations were observed for Total coliforms with and carotenoids and faecal coliforms, faecal coliforms with total coliforms, carotenoids with Crustacean species number and total species number, total species number with rotifers and crustacean species number, and finally crustacean species number with rotifers (Table 2). Also, it was inverse direct associations between reflectance of Band 1 with mixotrophic abundance, and temperature, reflectance of Band 2 with mixotrophic abundance and temperature, reflectance of Band 3 with temperature, temperature with total and crustacean species number, conductivity, total dissolved solids and pH (Table 3). Also, inverse significant associations were denoted between total dissolved solids with mixotrophic abundances, conductivity with mixotrophic abundances, chlorophyll c with mixotrophic, carotenoids with mixotrophic, and finally mixotrophic abundance with crustacean and total species number (Table 3). The main contributor variables for axis 1, were B1, B2, and B3 reflectance, temperature, conductivity, total dissolved solids, total coliforms, carotenoids, mixotrophic ciliates, total and zooplankton species (Table 4), whereas for axis 2 the main contributor variables were B4, B5, B6 and B7 reflectance and chlorophyll c concentration (Table 4). The PCA results, revealed that sites in Villarrica northern littoral and center, have high pH rotifers and zooplankton species number (total, crustacean and rotifers), and high reflectance of B1, B2, and B3 reflectance, whereas sites in Villarrica port and Pucon bay, differs from two last sites in high values of faecal coliforms and chlorophyll a and chlorophyll b concentrations (Fig. 1). For Caburgua lake, the first site only has high B4, B5, B6 and B7 reflectance values, low zooplankton species number (total, crustacean and rotifers) and low mixotrophic abundances, whereas sites, whereas in Caburgua lake, second, third and fourth sites have high temperature, mixotrophic abundances, and chlorophyll c concentration and low zooplankton species number (total, crustacean and rotifers) (Fig. 2).
Rot
Crus
Tot
Mix
Car
Chl c
Chl b
Chl a
FC
TC
ARM
Cond
TDS
pH
Temp
B7
B6
B5
B4
B3
B2
B1
0.68
(0.06)0.88
(<0.01)0.86
(<0.01)−0.90
(<0.01)0.82
(0.01)−0.20
(0.62)0.57
(0.13)0.57
(0.14)0.61
(0.10)0.56
(0.14)−0.07
(0.87)0.93
(<0.01)0.94
(<0.01)0.84
(<0.01)−0.91
(<0.01)0.16
(0.69)0.10
(0.81)0.03
(0.94)0.02
(0.96)0.88
(<0.01)0.98
(<0.01)
B2
0.61
(0.10)0.85
(<0.01)0.83
(0.01)−0.91
(<0.01)0.83
(0.01)−0.25
(0.55)0.52
(0.18)0.53
(0.18)0.66
(0.07)0.64
(0.08)0.04
(0.93)0.92
(<0.01)0.93
(<0.01)0.80
(0.01)−0.86
(<0.01)0.28
(0.50)0.22
(0.60)0.14
(0.74)0.05
(0.90)0.83
(0.01)
B3
0.53
(0.17)0.78
(0.02)0.75
(0.03)−0.70
(0.05)0.76
(0.02)0.21
(0.62)0.53
(0.17)0.49
(0.22)0.65
(0.08)0.55
(0.15)0.20
(0.63)0.84
(<0.01)0.85
(<0.01)0.76
(0.02)−0.87
(<0.01)−0.03
(0.94)−0.17
(0.68)−0.29
(0.48)0.16
(0.70)
B4
−0.13
(0.76)−0.23
(0.57)−0.22
(0.60)0.01
(0.98)−0.30
(0.47)0.10
(0.81)0.04
(0.92)−0.06
(0.87)−0.17
(0.69)−0.20
(0.62)0.41
(0.31)−0.22
(0.59)−0.22
(0.60)0.26
(0.52)0.23
(0.58)0.71
(0.05)0.59
(0.12)0.51
(0.19)
B5
0.00
(0.99)−0.14
(0.73)−0.12
(0.78)−0.19
(0.65)−0.23
(0.57)−0.67
(0.06)−0.12
(0.77)−0.12
(0.77)−0.25
(0.55)−0.13
(0.75)−0.05
(0.89)−0.19
(0.65)−0.18
(0.67)0.15
(0.72)0.32
(0.44)0.91
(<0.01)0.98
(<0.01)
B6
0.03
(0.94)−0.07
(0.86)−0.05
(0.89)−0.21
(0.62)−0.19
(0.64)−0.60
(0.11)−0.14
(0.74)−0.15
(0.71)−0.17
(0.68)−0.06
(0.88)0.03
(0.93)−0.15
(0.73)−0.13
(0.75)0.26
(0.53)0.26
(0.53)0.96
(<0.01)
B7
−0.06
(0.89)−0.09
(0.84)−0.08
(0.84)−0.21
(0.61)−0.18
(0.66)−0.41
(0.31)−0.01
(0.98)−0.06
(0.88)−0.03
(0.94)0.03
(0.94)0.19
(0.65)−0.09
(0.83)−0.08
(0.85)0.33
(0.41)0.18
(0.66)
Temp
−0.66
(0.07)−0.85
(<0.01)−0.84
(<0.01)0.73
(0.04)−0.83
(0.01)−0.07
(0.86)−0.65
(0.08)−0.65
(0.08)−0.59
(0.20)−0.50
(0.20)0.08
(0.85)−0.94
(<0.01)−0.94
(<0.01)−0.72
(0.04)
pH
0.76
(0.02)0.77
(0.02)0.79
(0.02)−0.59
(0.12)0.46
(0.25)−0.20
(0.63)0.32
(0.44)0.23
(0.57)0.26
(0.61)0.21
(0.61)−0.22
(0.59)0.61
(0.10)0.62
(0.10)
TDS
0.56
(0.14)0.87
(<0.01)0.83
(0.01)−0.89
(<0.01)0.95
(<0.01)−0.08
(0.84)0.59
(0.12)0.63
(0.09)0.75
(0.03)0.71
(0.04)0.05
(0.89)1.00
(<0.01)
Cond
0.55
(0.15)0.86
(<0.01)0.82
(0.01−0.88
(<0.01)0.95
(<0.01)−0.07
(0.86)0.60
(0.11)0.64
(0.08)0.76
(0.03)0.71
(0.04)0.06
(0.89)
AMR
−0.53
(0.17)−0.20
(0.63)−0.27
(0.51)0.04
(0.93)0.15
(0.72)0.57
(0.13)0.07
(0.86)0.08
(0.85)0.46
(0.25)0.45
(0.25)
TC
−0.02
(0.96)0.53
(0.17)0.43
(0.28)−0.64
(0.08)0.77
(0.02)0.00
(0.99)0.20
(0.63)0.26
(0.53)0.96
(<0.01)
FC
−0.05
(0.89)0.49
(0.21)0.40
(0.33)−0.64
(0.08)0.74
(0.03)0.16
(0.70)0.41
(0.31)0.44
(0.27)
Chl a
0.11
(0.79)0.23
(0.57)0.21
(0.61)−0.56
(0.15)0.45
(0.26)0.19
(0.64)0.98
(<0.01)
Chl b
0.11
(0.79)0.21
(0.61)0.19
(0.64)−0.51
(0.20)0.37
(0.36)0.26
(0.53)
Chl c
−0.39
(0.34)−0.28
(0.50)−0.31
(0.45)0.43
(0.29)−0.10
(0.01)
Car
0.52
(0.18)0.86
(<0.01)0.82
(0.01)−0.83
(0.01)
Mix
−0.51
(0.19)−0.76
(0.02)−0.73
(0.03)
Tot
0.89
(<0.01)0.99
(<0.01)
Crus
0.83
(0.01)
Variable
Axis 1
Axis 2
B1
−0.290
0.092
B2
−0.284
0.131
B3
−0.264
−0.045
B4
0.041
0.282
B5
0.040
0.463
B6
0.022
0.473
B7
0.004
0.441
Temperature
0.282
0.087
pH
−0.219
0.201
Total disolved solids
−0.294
−0.043
Conductivity
−0.293
−0.052
RAM
0.002
−0.087
CT
−0.196
−0.076
CF
−0.208
−0.130
Chlorophyll a
−0.172
−0.098
Chlorophyll b
−0.166
−0.083
Chlorophyll c
0.036
−0.345
Carotenoids
−0.272
−0.079
Mixotrophic abundances
0.264
−0.129
Total zooplankton species
−0.261
0.053
Crustacean species
−0.270
0.034
Rotifers species
−0.191
0.122
The results of null model co-occurrence revealed that for both sites together there are structured pattern in species co-occurrence, whereas for Villarrica and Caburgua lakes the species co-occurrence revealed that species associations are random (Table 5), whereas the results of niche sharing revealed that species share niche due interspecific competition for both sites and for Villarrica lake, and for Caburgua lake the species do not share niche and there are not interspecific competition (Table 5).
Species co-occurrence
Site
Observed index
Mean index
Variance
Standard effect size
P
Total
1.935
1.162
0.006
9.345
0.001
Caburgua
0.000
0.000
0.000
Non detectable
0.999
Villarrica
0.000
0.000
0.000
Non detectable
0.999
Niche overlaping
Site
Observed index
Mean index
Variance
Standard effect size
P
Total
0.515
0.291
< 0.001
7.857
0.001
Villarrica
0.718
0.629
< 0.001
3.493
0.004
Caburgua
0.469
0.322
0.046
0.682
0.233
4 Discussion
The results revealed the marked difference in both lakes, in term of trophic status, zooplankton communities and spectral properties, these results agree with literature descriptions for northern Patagonian lakes, where it is possible found in ultraoligotrophic status high mixotrophic abundance (Wölfl, 1995; Woelfl and Geller, 2002) and low crustacean zooplankton abundances and species number (Woelfl, 2007; Woelfl et al., 2010). The marked differences observed in spectral properties and zooplankton assemblages due water quality, would not be described under different trophic status, because these has been described for lakes with glacier sediment influences that generate different properties in water transparence that in consequence affect zooplankton communities (De los Ríos-Escalante et al., 2013; De los Ríos-Escalante and Acevedo, 2016a; 2016b).
The marked differences in Villarrica lake associated to human intervention, specifically the presence of both towns, would agree with similar observations for Llanquihue lake, that is characterized by the presence of towns and aquaculture sites (Soto, 2002; De los Ríos-Escalante et al., 2017), on this basis, the obtained results probably would be similar to other lakes with human alterations. The first report of total bacteria was described without more details for Riñihue and Pirihueico lakes, that are similar in term of mixotrophic ciliates absence and presence respectively (Wölfl, 1995), in both lakes, bacteria are more abundant under mixotrophic ciliates abundances, that would be similar to the observations for Caburgua lake in the present study, that would be due light regime (Wölfl, 1995), that would be similar to observations for Argentinean Patagonian lakes (Modenutti, 2014). A different situation was reported for Villarrica lake with presence of high bacterial concentrations, specifically faecal coliforms in Villarica lake due urban pollution was described only by Brown and Zimmerman (2000), that would be similar with results obtained in the present study. A different situation was reported for Caburgua lake, that is markedly oligotrophic and with high mixotrophic ciliates and low zooplankton abundances (Woelfl, 2007; Woelfl et al., 2010), this situation is similar to observations for northern Argentinean Patagonian lakes (Balseiro et al., 2004; Modenutti et al., 2000; Modenutti, 2014). The absence of mixotrophic ciliates under high crustacean zooplankton abundances would be due possible grazing of cladocerans and copepods on mixotrophic ciliates (De los Ríos et al., 2019).
The use of remote sensing techniques, for water quality studies (Malenovsky et al., 2012), thus, Atzberger and Richter (2012); Kallio et al. (2015); Palmer et al. (2015a); (2015b;); Sterckx et al. (2015); Stratoulias et al. (2015); Briceño et al. and Esse et al. (2018) proposed marked associations in spectral properties and chlorophyll concentration. In this context would have marked differences in water color due water quality that can be detectable using remote sensing techniques (Salama and Verhoef, 2015; Sander et al., 2015). Also, Li et al. (2015); Lunetta et al. (2015); Oyama et al. (2015), proposed the use of remote sensing techniques for determine potential associations with cyanobacterial pigments in lakes. The exposed results about associations between differences in water quality with their respective correspondence in spectral images, would be similar to the observed results in the present study. Also, in this scenario, the present results it would be possible detect differences within a same lake at large spatial scales (ten or more kilometers), that can be detectable using remote sensing techniques.
The exposed results revealed the presence of differences between two lakes, and within each lake, between water qualities, specifically in bacterial abundances, chlorophyll concentrations, would be similar with ecological observations for other northern Patagonian lakes such as Llanquihue located at 41°S (Soto, 2002; De los Ríos-Escalante et al., 2017). The integration of limnological descriptions, specifically trophic status and remote sensing techniques for Chilean lakes has been described only for Vichuquén lake, that is a coastal central Chilean lake, with marked human intervention in their surrounding basin, and it was possible propose a predictive model based in LANDSAT 8 OLI sensor images considering the spectral properties, chlorophyll and nutrients concentrations variation at space-temporal scale (Briceño et al., 2018). In this scenario it would be possible use remote sensing techniques for predict water quality in northern Patagonian lakes.
Acknowledgements
The present study was funded by projects VIPUCT 2017RE-PR-06 and MECESUP UCT 0804. Also, it recognized the important logistic support of Chilean Navy (Villarrica Port Commandance), Mr. Pablo Saavedra for his valuable logistical support, finally the authors express their gratitude to M.I. and S.M.A for their valuable apports for improve the manuscript.
Declaration of Competing Interest
The authors declare that they have no known competing financial interests or personal relationships that could have appeared to influence the work reported in this paper.
References
- American Public Health Association, (APHA). 1989. Standard Methods for analysis of water and waste water. American Public Health Association, Washington, DC. U.S.A.
- Manual taxonómico del zooplancton lacustre de Chile. Boletín Limnologico, Universidad Austral de Chile. 1985;8:1-110.
- [Google Scholar]
- Spatially constrained inversion of radiate transfer models for improved LAI mapping from future Sentinel-2 imagery. Rem. Sens. Env.. 2012;120:208-218.
- [CrossRef] [Google Scholar]
- Grazing impact on autotrophic picoplankton in two Andean lakes (Patagonia, Argentina) with different light:nutrient ratios. Rev. Chilena Hist. Nat.. 2004;77:73-85.
- [CrossRef] [Google Scholar]
- Fusion of the genera Boeckella and Pseudoboeckella and a revision of their species from South America and subantarctic islands. Rev. Chilena Hist. Nat.. 1992;65:17-63.
- [Google Scholar]
- Determinación de calidad de agua en el lago Vichuquén con imágenes de satélite Landsat 8, sensor OLI año 2016. Chile. Rev. Teledet.. 2018;52:67-68.
- [Google Scholar]
- Bacteriological analysis of lake Villarrica, Chile and some of its affluents. Med. Amb.. 2000;13:63-67.
- [Google Scholar]
- Limnological studies in lake Villarrica. Morphometry, physics, chemistry and primary productivity. Arch. Hydrobiol.. 1983;(Suppl.) 71:37-67.
- [Google Scholar]
- A modelling assesment of potential for eutrophication of Lake Riñihue. Chile. Arch. Hydrobiol.. 2001;151:101-125.
- [CrossRef] [Google Scholar]
- Variation in freshwater fish assemblages along a regional elevation gradient in the northern Andes. Colombia. Ecol. Evol.. 2015;5:2608-2620.
- [CrossRef] [Google Scholar]
- De los Rios-Escalante, P., 2010. Crustacean zooplankton communities in Chilean inland waters. Crust. Monogr., 12: 1-109. https://doi.org/10.1163/9789047428060
- De los Ríos-Escalante, P., Quinan E., Acevedo, P. 2013. Crustacean zooplankton communities in Lake General Carrera (46°S) and their possible association with optical properties. Crustaceana 86: 506-513. https://doi.org/10.1163/15685403-00003182
- De los Ríos-Escalante, P., Soto, D., Acevedo, P., & Santander Massa, R. 2017. Zooplankton communities in bays with different trophic status in Llanquihue lake (41° S, Chile). Brazilian J. Biol., 77: 469-475. http://dx.doi.org/10.1590/1519-6984.15515
- De los Ríos, P., Acevedo P., Castro M., 2018. Temporal variations on chlorophyll concentration in Riñihue lake (39°S, Patagonia, Chile) and its relation with satellite Landsat ETM+ spectral data. Bulletin de la Societé Royale des Sciences de Liége, 87: 62-69. DOI: 10.25518/0037-9565.7994
- De los Ríos, P., Woelfl S., Soto C., 2019. Experimental evidence from crustacean zooplankton grazing activity on mixotrophic ciliates. Animal Biology, 69: 259-264. https://doi.org/10.1163/15707563-00001032
- De los Ríos-Escalante, P., Acevedo, P. 2016a. First observations on zooplankton and optical properties in a glacial North Patagonian lake (Tagua Tagua lake, 41° S Chile). Polish J. Env. Stud., 25: 453-457. DOI: https://doi.org/10.15244/pjoes/59369
- De los Ríos-Escalante, P., Acevedo, P. 2016b. First observations of Boeckella michaelseni Mrázek 1901 and optical properties of a Central Patagonian lake. Polish J. Env. Stud., 25: 1781-1785. DOI: https://doi.org/10.15244/pjoes/61700
- Spectral characterization of Didymosphenia geminata under laboratory conditions: bases for a monitoring and early warning system in river systems of south central Chile. MBI. 2018;9:85-90.
- [CrossRef] [Google Scholar]
- A handbook of Statistical Analysis using R ((1st Edition).). 2016. (Accessed 01th Jule 2019)
- Null models in ecology. Washington DC, USA: Smithsonian Institution Press; 1996.
- Null model analysis of species co-occurrence patterns. Ecology. 2000;81:2606-2621.
- [CrossRef] [Google Scholar]
- Gotelli, N. J. & G. L. Entsminger, 2009. EcoSim: null models software for ecology: VT 05465. http://garyentsminger.com/ecosim (Acquired Intelligence, Inc. & Kesey-Bear, Jericho, VT 05465). (Accessed 01th Jule 2019)
- Gotelli, N.J., Ellison, A. M. 2013. EcoSimR 1.00. Available from: http://www.uvm.edu/∼ngotelli/EcoSim/EcoSim.html (Accessed 01th Jule 2019).
- Harrell, F.E. 2016. Package “Hmisc“. Available from: https://cran.r-project.org/web/packages/Hmisc/Hmisc.pdf (Accessed 01th Jule 2019).
- Kallio, K., Koponen, S., Ylöstalo, P., Kervinen, M., Pyhälahti, Attila, J., 2015. Validation of MERIS spectral inversion processors using reflectance, IOP and water quality measurements in boreal lakes. Rem. Sens. Env., 157: 147-157. https://doi.org/10.1016/j.rse.2014.06.016
- Kassambara A, Mundt F., 2017. Factoextra: extract and visualize the results of multivariate data analyses. R package version 1.0.5. Available from: https://CRAN.R- project.org/package=factoextra. (Accessed 01th Jule 2019).
- Li., L., Li., L., Song, K., 2015. Remote sensing of freshwater cyanobacteria: an extended IOP Inversion Models of Inland Waters (IIMIW) for portioning absorption coefficient and estimating phycocyanin. Rem. Sens. Env., 157: 9-23. https://doi.org/10.1016/j.rse.2014.06.009
- Evaluation of cyanobacteria cell count detection derived from MERIS imagery across the eastern USA. Rem. Sens. Env.. 2015;157:24-34.
- [CrossRef] [Google Scholar]
- Sentinels for science: potential of Sentinel-1, -2 and -3 missions for scientific observations of ocean, cryosphere and land. Rem. Sens. Env.. 2012;120:91-100.
- [CrossRef] [Google Scholar]
- Ciliate community structure in two South Andean lakes: the effect of lake water on Ophrydium naumanni distribution. Aquat. Microb. Ecol.. 2000;21:299-307.
- [CrossRef] [Google Scholar]
- Structure and dynamics of food webs in Andean lakes. Lakes and Reserv. Res. Manag.. 1998;3:179-189.
- [CrossRef] [Google Scholar]
- Modenutti, B. (2014). Mixotrophy in Argentinean freshwaters. In: G. Tell, I. Izaguirre & I. O’Farrell (Eds). Freshwater phytoplankton of Argentina. Adv. Limnol. 65: 359-374. D OI: 10.1127/1612-166X/2014/0065-0051
- Distinguishing Surface cyanobacterial blooms and aquatic macrophytes using Landsat/TM and ETM+ shortwave infrared bands. Rem. Sens. Env.. 2015;157:35-47.
- [CrossRef] [Google Scholar]
- Exportación de nutrientes en microcuencas con distinto uso del suelo en el sur de Chile (Lago Rupanco, X Región) Rev. Chilena Hist. Nat.. 1997;70:507-519.
- [Google Scholar]
- Remote sensing of inland waters: challenges, progress and future directions. Rem. Sens. Env.. 2015;157:1-8.
- [CrossRef] [Google Scholar]
- Validation of Envisat MERIS algorithms for chlorophyll retrieval in a large, turbid and optically-complex shallow lake. Rem. Sens. Env.. 2015;157:158-169.
- [CrossRef] [Google Scholar]
- R: A language and environment for statistical computing. Vienna, Austria: R foundation for statistical computing; 2009.
- Chave de identifição e lista de referencias para as species continentais sudamericanas de vida livre da ordem Cyclopoida (Crustacea, Copepoda) Bolm. Zool. Univ. de São Paulo. 1985;9:17-143.
- [Google Scholar]
- Two-stream remote sensing model for water quality mapping: 2SeaColor. Rem. Sens. Env.. 2015;157:111-122.
- [CrossRef] [Google Scholar]
- Implications of scatter corrections for absorption measurements on optical closure of Amazon floodplain lakes using the Spectral Absorption and Attenuation Metter (AC-S-WETLabs) Rem. Sens. Env.. 2015;157:123-137.
- [CrossRef] [Google Scholar]
- Zooplankton assemblages of Chilean temperate lakes: a comparison with North American counterparts. Revista Chil. Hist. Nat.. 1991;64:569-581.
- [Google Scholar]
- Los lagos oligotróficos del bosque templado húmero del sur de Chile. In: Armesto J., Khalin M., Villagrán M., eds. Ecología del Bosque Chileno. Santiago de Chile: Editorial Universitaria; 1995.
- [Google Scholar]
- Oligotrophic patterns in southern Chile lakes: the relevance of nutrients and mixing depth. Rev. Chilena Hist. Nat.. 2002;75:377-393.
- [CrossRef] [Google Scholar]
- SIMilarity Environment Correction (SIMEC) applied to MERIS data over inland and coastal waters. Rem. Sens. Env.. 2015;157:96-110.
- [CrossRef] [Google Scholar]
- Assesment of ecophysiology of lake shore reed vegetation based on chlorophyll fluorescence, field spectroscopy and hyperspectral airborne imagery. Rem. Sens. Env.. 2015;157:72-84.
- [CrossRef] [Google Scholar]
- Strickland, J.D. Parsons R., 1972. A practical handbook of seawater analysis. Fish. Rev. Board Canadian Bull., 167: 1-310
- Co-occurrence of earth worms in urban surroundings: a null model analysis of community structure. European J. Soil Biol.. 2007;43:84-90.
- [CrossRef] [Google Scholar]
- Seasonal changes in earthworm diversity and community structure in Central Côte d’Ivoire. European J. Soil Biol.. 2006;42:s334-s340.
- [CrossRef] [Google Scholar]
- ggplot2: elegant graphics for data analysis. USA: Springer-Verlag, New York; 2009.
- Wölfl, S., 1995. Untersuchungen zur Zooplanktonstruktur einschliesslich der mikrobiellen Gruppen unter besonderer Berücksichtigung der mixotrophen Ciliaten in zwei Südchilenischen Andenfußseen: 1-242. (Doctoral Thesis, Universität Konstanz).
- Chlorella-bearing ciliates dominate in an oligotrophic North Patagonian lake (Lake Pirehueico, Chile): abundance, biomass and symbiotic photosynthesis. Freshw. Biol.. 2002;47:231-242.
- [CrossRef] [Google Scholar]
- The distribution of large mixotrophic ciliates (Stentor) in deep North Patagonian lakes (Chile): First results. Limnologica. 2007;37:28-36.
- [CrossRef] [Google Scholar]
- Trophic Parameters and method validation in Lake Riñihue (North Patagonia: Chile) from 1978 through 1997. Rev. Chilena Hist. Nat.. 2003;76:459-474.
- [CrossRef] [Google Scholar]
- Chlorella-bearing ciliates (Stentor, Ophrydium) dominate in an oligotrophic, Deep, North Patagonian lake (Lake Caburgua, Chile) Limnologica. 2010;40:134-139.
- [CrossRef] [Google Scholar]


