

Translate this page into:
Field attributes and organic geochemical analysis of shales from early to middle Permian Dohol Formation, Peninsular Malaysia: Implications for hydrocarbon generation potential
⁎Corresponding authors. alidurashid22@gmail.com (Alidu Rashid), numair.siddiqui@utp.edu.my (Numair Ahmed Siddiqui)
-
Received: ,
Accepted: ,
This article was originally published by Elsevier and was migrated to Scientific Scholar after the change of Publisher.
Peer review under responsibility of King Saud University.
Abstract
The early to middle Permian Dohol Formation falls under the Eastern Belt of Peninsular Malaysia. This formation is part of the Palaeozoic rock sequence in East Johor, composed of several metasedimentary, metamorphic, volcanic, and siliciclastic rocks. The Dohol Formation is said to have abundant black shales; however, the previous studies done in the area does not focus on the field attributes and the ability of the shales to generate hydrocarbons. Detailed traditional fieldwork was conducted in East Johor to characterize the shale facies of the formation. Different types of shale facies have been identified and interpreted in this study: (i) dark grey shale facies, (ii) light grey shale facies, (iii) red shale facies, and (iv) dark brown shale facies. XRD analysis was used to evaluate the mineralogy of the rock samples; the results show that the shales are primarily composed of kaolinite, illite, and quartz. The organic geochemical analysis also revealed that the samples collected had low TOC content, with an average TOC value of 0.40 wt%, with type II and type III kerogen predominating. The Ro and Tmax values and plots indicated that the samples are mature, with most already generating oil. The findings of this study suggest that the Dohol Formation has a low potential for generating hydrocarbons in commercial quantities, and also, the rocks are from a deep marine depositional setting.
Keywords
Facies heterogeneity
Shale
TOC
Rock Eval-Pyrolysis
Mineralogy
XRD analysis
Dohol Formation

1 Introduction
Black shales usually serve as valuable oil and gas resources due to their high organic matter content concentration (Uffmann et al., 2012; Zou, 2013). Paleozoic black shales account for nearly 25 % of Peninsular Malaysia's sedimentary terrain (Baioumy et al., 2016). Nonetheless, more information is needed to determine its hydrocarbon potential. Petroleum geochemistry is one of the most efficient approaches for assessing the suitability of shales to serve as source rocks or unconventional reservoirs (Peters and Fowler, 2002). Petroleum geochemistry enhances exploration efficacy by taking into account the factors which control the amount of oil and natural gas generated (Katz, 1995; Peters and Fowler, 2002). These characteristics include source rock distribution, composition, thermal maturity, and generation-migration accumulation timing (Peters and Fowler, 2002). A good source rock is one that has enough organic content to generate hydrocarbons in commercial quantity (Al-Areeq, 2018; Peters, 1986). Three types of source rocks are distinguished: immature, mature, and post-mature. Immature source rocks are those that are yet to produce hydrocarbons (Al-Areeq, 2018). The source rocks in the generation phase are known as mature source rocks, while those that have already generated hydrocarbons are known as post-mature source rocks (Al-Areeq, 2018; McCarthy et al., 2011; Peters and Cassa, 1994). Source rock evaluation entails examining the richness, quality, or type of organic matter and thermal maturity to ascertain the source rock’s potential to produce hydrocarbons (Dembicki, 2016; Newport et al., 2016; Peters et al., 2016). Some of the source rock evaluation techniques include total organic carbon (TOC) analysis, rock eval pyrolysis and vitrinite reflectance analysis (Ahmed et al., 2021; Dembicki, 2016; Owusu et al., 2019; Ramachandran et al., 2013).
Malaysia has abundant black shale-bearing formations, but detailed fieldwork and organic geochemical analysis are required to characterize these shale intervals in the stratigraphic record, and Dohol Formation is among Malaysia's 19 Paleozoic formations containing these black shales (Baioumy et al., 2016). The majority of the rocks in this formation are carbonaceous shale, siltstone, slate, phyllite, and schist, however, there is also some arenite, limestone, and volcanic rock present (Peng et al., 2004). The formation's calcareous unit, also known as 'Sumalayang limestone' is thought to have been accumulated in an inner neritic shelf environment containing Middle Permian fusulinids (Foo, 1983). Based on the fusulinids that can be found in the Sumalayang Limestone Member, it has been proposed that this formation dates back to the late Early Permian to the early Middle Permian (Igo, 1979). The Dohol Formation is thought to have a shallow marine origin based on sedimentary features such as planar crossbedding, grain-supported sandstone, and its related fusulinid limestone and calcareous sandstone (Surjono et al., 2006).
The Dohol Formation has abundant black shales that could be of great importance (Al-Mutarreb et al., 2018; Baioumy et al., 2016); however, the detailed information on the exposed locations of the outcrops of this formation is very limited, and the potential of these shales to generate hydrocarbons is unknown. Therefore, this research aims to describe the characteristics of the shale facies of the Dohol Formation and determine the organic matter content, kerogen type, and the thermal maturity based on organic geochemical analysis. In addition, X-ray Diffraction (XRD) analysis was also employed to determine the mineral composition of the shales to predict their source. Finally, the facies were analyzed to determine the depositional settings of the rocks.
2 Geological setting
2.1 Geology of Southeast Asia
Numerous continental blocks and a volcanic arc in Southeast Asia were originally Tethyan Ocean basins (Hall, 2013; Metcalfe, 2011b; Metcalfe, 2017; Searle et al., 2012). Peninsular Malaysia has three N—S trending geological bands based on stratigraphy, structure, magmatism, and geophysical characteristics (Burton et al., 1973; Ismail et al., 2007). The Bentong–Raub suture zone serves as a boundary where the Sibumasu block and Sukhothai Arc collide. Sibumau and Indo-china East Malay evolved from Gondwanaland and collided, forming the Sukhothai Arc (Ismail et al., 2007; Metcalfe, 2017; Metcalfe and Hall, 1998; Sevastjanova et al., 2011; Sevastjanova et al., 2016). Fragments of the Sukhothai Arc were unearthed on the eastern side of the Bentong-Raub Suture. Southeast Asia's tectonic evolution consisted of three periods: the Devonian to Triassic rifting with Paleotethys, the late Early Permian to the Late Cretaceous separation with meso-Tethys, and the Late Triassic to Late Cretaceous northward drift with Ceno-Tethys (Metcalfe, 1994; Metcalfe, 1996; Metcalfe, 2011a). Sibumasu block moved west of the Bentong-Raub suture in the Late-Early Permian. Palaeo-Tethys shrank during Sibumasu's northward flight, generating the Sukhothai Arc on the block's continental margin (Ismail et al., 2007; Metcalfe, 2011b; Metcalfe, 2017; Oliver et al., 2014). This arc split from the margin to form the Jinghong Nan-Sra Kaeo back-arc basin system. This arc (Sukhothai Arc) is accreted to the continental margin after the back-arc collapses (Ismail et al., 2007; Oliver et al., 2014). Permian to Triassic strata and the I-type granitoid plutons document the Sukhothai Arc. Singapore and neighbouring locations have the Sukhothai Arc exposures.
2.2 Geology of Peninsular Malaysia
Peninsular Malaysia covers an area of approximately 130,268 km2. It has a maximum length of 750 km and a breadth of 330 km (Hutchison and Tan, 2009). The Johor Strait and the Straits of Malacca separate it from Singapore Island in its south and Sumatra Island in its west. Peninsular Malaysia results from the crucial part of the Eurasian Plate, the South-East Asian portion called Sunderland (Hutchison and Tan, 2009). The Peninsula is thought to be tectonically stable, with barely uplifts, tilting, fault movements, and local gentle down warps occurring (Burton et al., 1973; Gobbett and Tjia, 1973). Peninsular Malaysia is divided into three belts: the Eastern belt, the Western belt, and the Central belt. The division was based on the belts' different geological characteristics (Metcalfe, 2013).
2.3 Geology of the Dohol Formation
The Dohol Formation is located in the Eastern Belt of Peninsular Malaysia. The Eastern Belt consists primarily of Carboniferous to Permian-aged strata that extend from east Kelantan through Terengganu and east Pahang to east Johor in the south (Hutchison and Tan, 2009). It is believed that regional metamorphism, folding, and uplift took place in the Late Palaeozoic (Permian), and then the deposition of an older series of continental deposits, including the Murau and Redang conglomerates occurred (Khoo and Tan, 1983). The Eastern Belt was uplifted by the Pan-peninsula Triassic orogeny (Khoo and Tan, 1983). Subsequently, a younger succession of gently dipping continental deposits were deposited, which were likely raised in the late Cretaceous (Khoo and Tan, 1983). The Eastern belt may have been uplifted during the end of the Permian due to the absence of younger marine deposits, which correlates to the deposition of Lower Triassic ignimbrite (Hutchison and Tan, 2009).
2.4 Stratigraphy of the study area
The Dohol Formation is one of the Palaeozoic rocks in East Johor composed of several metasedimentary to metamorphic, volcanic and siliciclastic rocks (Surjono et al., 2020) (Fig. 1a). The ages of Palaeozoic rocks are usually Carboniferous and Permian. Some of the key areas we found outcrops belonging to the Dohol Formation were Kota Tinggi, Kluang, Jemaluang, and the outskirts of Mersing (Fig. 1b). These Palaeozoic rocks in East Johor are grouped into seven (7) lithostratigraphic units: Mersing, Marau, Dohol, Linngui, Sedili, Pengerang, and Tanjung Leman formations (Surjono et al., 2020) (Fig. 1c).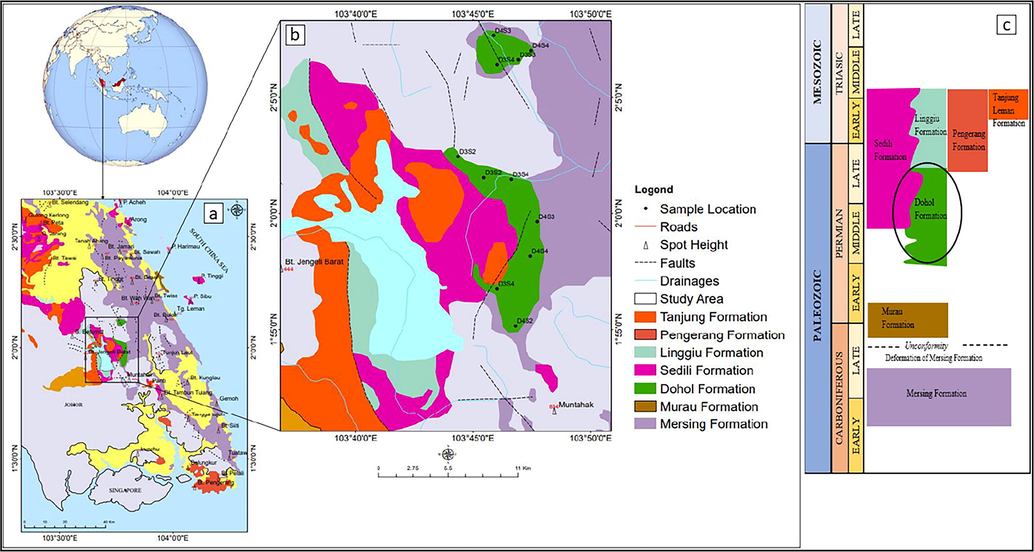
(a) Geological map of East Johor (b) Map of study area showing outcrop locations (c) Stratigraphy of East Johor region with various Paleozoic formations.
3 Materials and methods
This study includes a fieldwork component that involves sample collection, rock description and logging, sample preparation and processing, and laboratory analysis in the form of XRD analysis, TOC analysis, and Rock-Eval Pyrolysis.
3.1 Field study
The field study was in three (3) stages; rock description, sediment logging, and sample collection. The rock description involves identifying and describing the rocks that make up the Dohol Formation and the stratigraphic units in the area. The sediment logging involved graphically noting down the stratigraphic setup of the rocks. Some samples were also collected for laboratory analysis. Seventeen (17) fresh samples from the various lithofacies were collected using the hammer. Some tools used to identify the samples, pick the locations, and record the outcrop locations are the hand lens, hammer, GPS, and camera.
3.2 Xray diffraction (XRD) analysis
XRD analysis was undertaken on seventeen (17) shale samples collected from the studied area. The samples were analyzed at Centralized Analytical Laboratory (CAL) on Universiti Teknologi PETRONAS (UTP) campus. Powdered samples were fitted in an X-ray holder to examine mineral peaks. The samples were analyzed using a Panalytical Xpert3 Powder scanning from 4° to 60° 2θ. Mineral identification was based on the International Center for Diffraction Data (ICDD) data using HighScore Plus Software.
3.3 Total organic carbon (TOC) analysis
The TOC analysis was performed at CORELAB Malaysia. It was done by grinding and weighing a part of the rock sample. The carbonate minerals in the weighed sample were subsequently eliminated by applying hydrochloric acid to the samples. The samples were then burned to extremely high temperatures in an oxygen-rich atmosphere in order to transform the carbon in the sediments into carbon dioxide. (Carvajal-Ortiz and Gentzis, 2015; Dembicki, 2016). The carbon dioxide was then recorded, and the TOC content was calculated using the LECO carbon analyzer. The same procedure was done for all seventeen (17) shale samples.
3.4 Rock Eval-Pyrolysis
The Rock Eval-Pyrolysis was performed at CORELAB Malaysia by heating between 50 and 100 mg of rock sample in the pyrolysis oven. The samples were heated to a temperature of about 300 °C in a helium environment and kept there isothermally for about 5 min. (Carvajal-Ortiz and Gentzis, 2015). A flame ionization detector was used to measure the volatile organic material that emerged from the sample. It was recorded as the S1 peak (Tissot and Welte, 1984), representing the already generated hydrocarbons. The rock sample was then heated from 300 °C to 550 °C at a rate of 25 °C/minute, and the volatile organic material that popped out was gauged and documented as the S2 peak, with the S2 representing the remaining hydrocarbon potential in the rock sample (Tissot and Welte, 1984). The sample was heated from 300 to 390 °C to obtain the S2, and the amount of carbon dioxide that evaporated from the sample was measured and noted as the S3 peak. (Tissot and Welte, 1984). The S3 represents the amount of oxygen in the sediment associated with the kerogen. Tmax also represents the temperature whereby the S2 peak reaches its highest point. The duration of the analysis was approximately twenty minutes. The Production Index (PI), Hydrogen Index (HI) and the Oxygen Index (OI) for each sample was then calculated.
3.5 Calculated vitrinite reflectance
The Vitrinite Reflectance (Ro) values were calculated using standard models like the Barnett shale model (Jarvie et al., 2001) and the Duvernay shale model (Wust et al., 2013). According to the Barnett shale model Vitrinite Reflectance (Ro) was calculated as Ro = (0.0180 × Tmax) – 7.16. According to the Duvernay shale model, the Vitrinite Reflectance was calculated as Ro = (0.0149 × Tmax) – 5.85. The Tmax used was obtained from the Rock-Eval Pyrolysis. All the plots were drawn using vitrinite reflectance values from the Barnett shale model.
4 Results
4.1 Facies characteristics
The four (4) shale facies were encountered with different characteristics and compositions. The study reveals the area possesses many shales, albeit most are buried by vegetation. As a result, the only possible access to these shales is via fresh exposures due to the excavations resulting from road expansion or housing societies projects. Most of the outcrops analyzed in this study were fresh exposures.
4.1.1 Black shale facies
This fine-grained shale facies is dark grey to black in colour (Fig. 2a). With respect to the bedding, the outcrops of these facies are very thin-bedded to thinly laminated and fissile in some parts while medium to massive in other areas (Fig. 2a). The shales are highly fractured at some outcrop locations, possibly due to the composition, high fine sand/silt content, or tectonic activities. Some outcrops also contain silty lenses, which can be found randomly in the samples (Fig. 2b). Outcrops of this shale facies can be found in Jemaluang and along the Jalan Felda Nitar Timur road.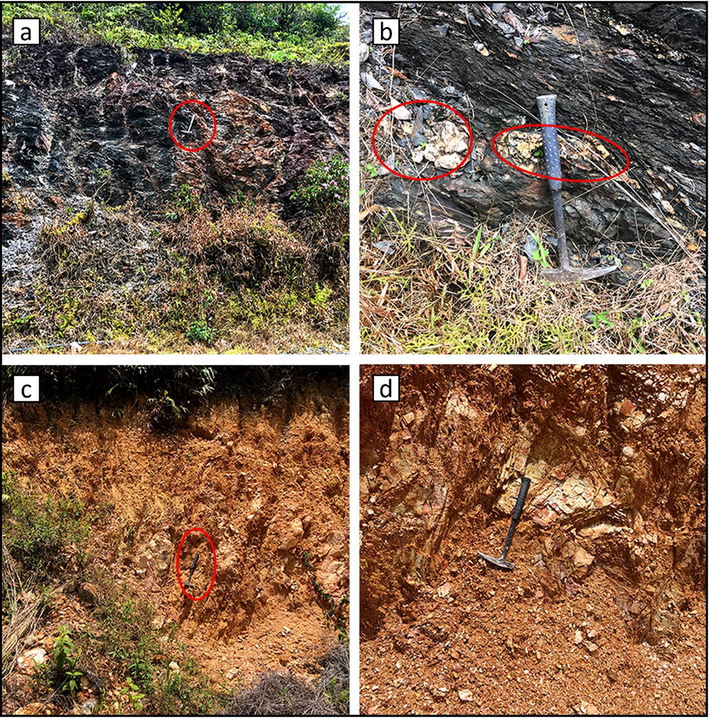
(a) Massive black shales beds with laminations (b) black shales with silty lenses and laminations (c) Massive red shale facies with sands at the top (d) Red weathered shale facies showing laminations.
4.1.2 Red shale facies
This type of shale facies is medium to fine-grained and reddish in colour (Fig. 2c). The bedding of the outcrops is made up of very thin laminae. This shale facies is highly fissile, with some near-surface parts showing highly weathered regions (Fig. 2d). The shales have pebbly sands overlying them at some locations. A contact was observed with the light grey shales at some locations. Outcrops of this shale facies can be found along the Jalan Felda Nitar Timur road.
4.1.3 Dark brown facies
This type of shale facies is fine-grained and dark brown in colour (Fig. 3a). The bedding of the outcrops are made up of very thin laminae. This shale facies is highly weathered, fissile, and flaky (Fig. 3a). The outcrop is located a few meters from light grey facies (Fig. 3b). The outcrops can be found at Kota Tinggi.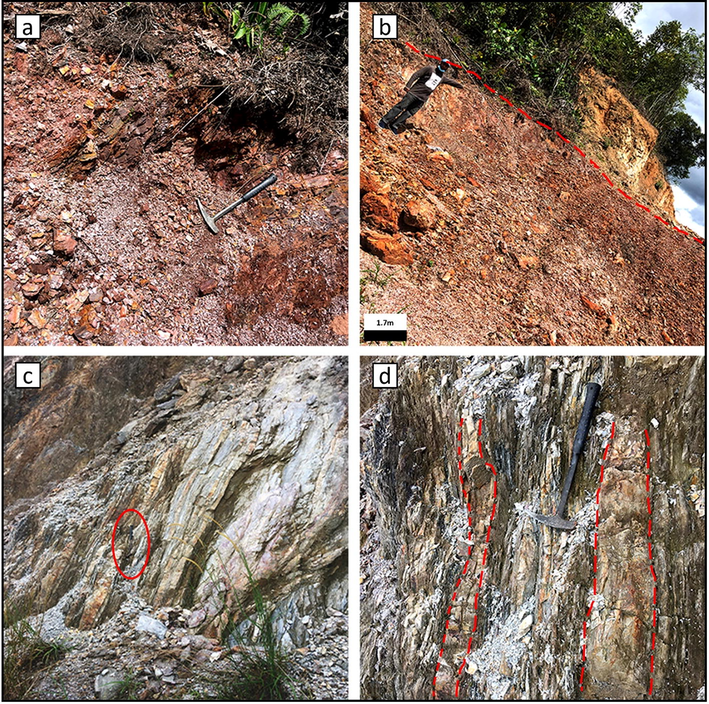
(a) Fissile dark brown shale facies (b) Evidence showing the dark brown shales are probably weathered light grey shale facies (c) Light grey shale facies showing thick laminations (d) Light grey shale facies with intrusions of quartzite.
4.1.4 Light grey facies
This type of shale facies is fine-grained and light grey in colour (Fig. 3c). The bedding of the outcrops is composed of thin laminae in some areas and medium bedded in others. The outcrops are seen to have intrusions of quartz veins (Fig. 3d). At some locations, the light grey shale facies were covered with vegetation and were also in contact with the red shale facies (Fig. 4a & 4b). The shales are highly fractured, which could be due to the composition, high fine sand/silt content, and tectonic activities (Fig. 4c). This shale facies also forms a boundary with sandstones at some outcrop locations. The near-surface exposures of this facies is affected by weathering at some outcrop locations (Fig. 4d). Outcrops of this shale facies can be found in Kota Tinggi and along the Jalan Felda Nitar Timur road.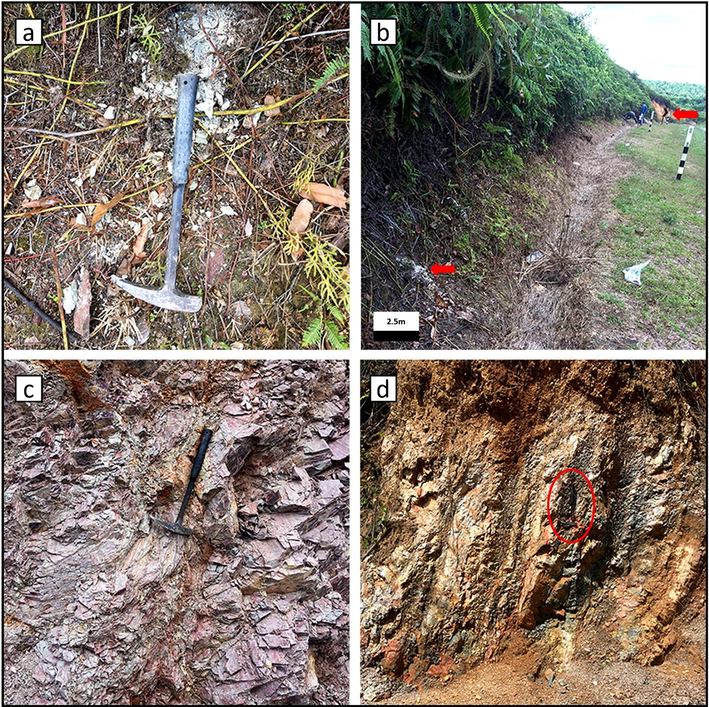
(a) Fissile light grey shale facies (b) Huge exposure of the light grey shales. At the far end of this field photo, it has contact with red shale facies (c) Light grey shale facies having brittle texture and laminations (d) The near surface exposures of fissile light grey shales showing dull brown colour due to weathering process.
4.2 Mineralogy of the shales using XRD analysis
From the results of XRD data of 17 shale samples, it is evident that all specimens display almost similar XRD patterns, only with very minimal differences in peak intensities and peak shapes (Fig. 5a & 5b). As shown in Table 1, the minerals in the Dohol Formation shales are primarily quartz, kaolinite, chlorite, feldspars, illite, and montmorillonite, with minor amounts of calcite, dolomite, muscovite, pyrite, and hematite. The quartz content ranges from 3 % to 39 %, with an average of 22.9 %. The kaolinite mineral, which is the second most abundant mineral after quartz, ranges from 6 % to 46 %, with an average of 15 %. Followed by the chlorite, feldspars, montmorillonite muscovite, respectively as shown in Table 1. Overall, clay minerals make up 47.7 % of the rock samples, followed by quartz, feldspars, and mica (QFM) which constitutes 38 %. The carbonates in the samples constitute only 8 % of the minerals.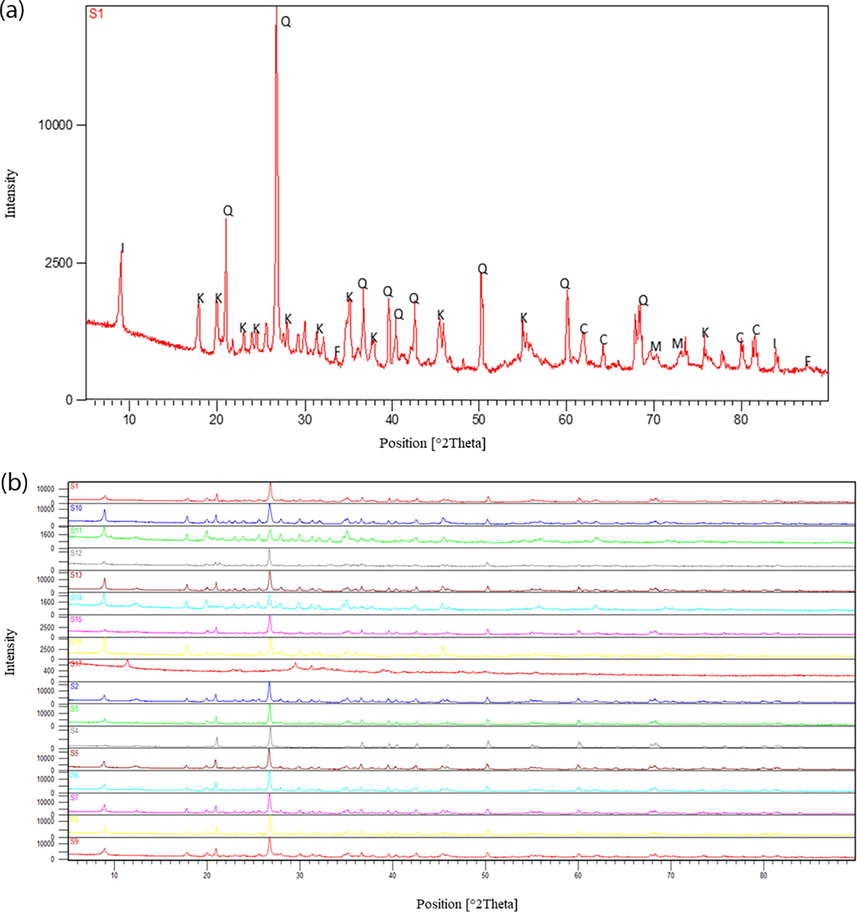
(a) A representative XRD analysis pattern of one shale sample along with few identified mineral phases. C- Chlorite, M- Montmorillonite, K- Kaolinite, Q- Quartz, F- Feldspars and I- Illite (b) Stacked XRD patterns of all the 17 shale samples from the Dohol Formation.
Sample Number
Kaolinite
Chlorite
Illite
Montmorillonite
Quartz
Calcite
Dolomite
Siderite
Feldspars
Muscovite
Pyrite
Hematite
S1
29
13
8
12
14
2
1
1
11
5
2
2
S2
6
6
20
8
34
5
3
1
8
5
2
2
S3
6
5
11
9
36
1
1
4
13
7
5
2
S4
7
6
23
18
21
3
1
2
5
8
3
3
S5
8
7
19
6
39
3
0
2
6
6
3
1
S6
7
25
8
8
34
3
1
2
4
4
2
2
S7
9
6
11
9
39
4
3
1
10
2
3
3
S8
30
10
12
7
19
3
3
4
4
4
2
2
S9
14
20
12
6
24
4
1
3
4
8
4
0
S10
46
8
9
4
15
3
0
1
5
3
1
5
S11
24
5
15
9
6
2
2
1
21
4
3
8
S12
5
4
11
9
33
6
11
2
6
7
2
4
S13
9
5
13
8
35
5
2
4
7
3
7
2
S14
12
4
24
14
10
4
1
2
14
6
2
7
S15
18
14
7
9
24
6
8
1
5
3
3
2
S16
22
28
15
8
3
7
2
1
8
2
1
3
S17
6
15
3
7
4
5
1
2
42
6
1
8
4.3 Total organic carbon (TOC) of the samples
Results show that the TOC of the analyzed samples range from 0.03 wt% to 2.46 wt% with an average value of 0.40 wt%, which is generally low. Only a few shale samples had a TOC value greater than 1 wt% (Table 2).
Sample ID
Shale facies
TOC (wt%)
S1 (mg HC/g)
S 2(mg HC/g)
S3 CO2 (mg HC/g)
S2/S3
S3 CO (mg HC/g)
Tmax ° C
HI (S2x100/TOC)
OI (S3X100/TOC)
PI S1/(S1 + S2)
Ro-Eq (%) Duvernay Model
Ro-Eq (%) Barnett Model
S1
Light grey facies
0.03
0.10
0.19
0.01
19.00
0.02
356
633.33
33.33
0.34
–
–
S2
Light grey facies
0.05
0.08
0.16
0.06
2.67
0.08
436
320.00
120.00
0.33
0.65
0.69
S3
Dark grey facies
0.50
0.10
0.26
0.20
1.30
0.08
418
52.00
40.00
0.28
0.38
0.36
S4
Dark brown facies
0.09
0.24
0.34
0.70
0.49
0.12
256
377.78
777.78
0.41
–
–
S5
Dark grey facies
2.46
0.07
0.16
0.09
1.78
0.07
418
6.50
3.66
0.3
0.38
0.36
S6
Dark grey facies
1.48
0.14
0.23
0.19
1.21
0.06
418
15.54
12.84
0.38
0.38
0.36
S7
Light grey facies
0.07
0.20
0.34
0.03
11.33
0.02
460
485.71
42.86
0.37
1.00
1.12
S8
Dark brown facies
0.06
0.23
0.26
0.03
8.67
0.05
256
433.33
50.00
0.47
–
–
S9
Dark grey facies
0.49
0.12
0.25
0.01
25.00
0.02
455
51.02
2.04
0.32
0.93
1.03
S10
Dark grey facies
0.04
0.05
0.17
0.01
17.00
0.01
431
425.00
25.00
0.23
0.57
0.60
S11
Dark grey facies
0.09
0.01
0.08
0.03
2.67
0.02
457
88.89
33.33
0.11
0.96
1.07
S12
Red shale facies
0.11
0.25
0.42
1.39
0.30
0.36
473
381.82
1263.64
0.37
1.20
1.35
S13
Dark grey facies
0.03
0.04
0.15
0.01
15.00
0.00
445
500.00
33.33
0.21
0.78
0.85
S14
Red shale facies
0.09
0.38
0.45
0.49
0.92
0.17
477
500.00
544.44
0.46
1.26
1.43
S15
Dark grey facies
0.46
0.34
0.68
0.65
1.05
0.05
518
147.83
141.30
0.33
1.87
2.16
S16
Red facies
0.11
0.40
0.48
0.26
1.85
0.08
499
436.36
236.36
0.45
1.59
1.82
S17
Light grey facies
0.05
0.02
0.09
0.91
0.10
0.07
469
180.00
1820.00
0.18
1.14
1.28
4.4 Rock-Eval pyrolysis
The pyrolysis experiment provided results on the S1, S2, and Tmax of the rock samples. The S1 values from the analyzed samples range from 0.02 to 0.38 mg HC/g, with an average S1 value of 0.18 mg HC/g. The S2 values range from 0.08 to 0.68 mg HC/g with an average value of 0.34 mg HC/g. Finally, the Tmax values from the analyzed samples range from 256 to 518 °C with an average value of 430.86 °C (Table 2).
4.5 Calculated vitrinite reflectance (Ro)
From the Duvernay shale model, the Ro values range from 0.38 % to 1.87 %, with an average value of 0.94 %. The values range from 0.36 to 2.16 % from the Barnett shale model, with an average value of 1.03 % (Table 2).
5 Discussion
5.1 Interpretation of facies
5.1.1 Interpretation of black shale facies
Planar parallel lamination suggests deposition of bed load (bed load deposition or traction carpet) (Allen, 1982; Beaubouef et al., 1999; Best and Bridge, 1992). In addition, low sediment fallout rates cause planar lamination (Allen, 1982; Talling et al., 2012). The planar lamination could have also arised from the recurring fall of laminar-sheared layers in a high-concentration flow when the deposition of sediments slows (Sumner et al., 2008). The Mud clasts are thought to have been eroded and piled up by turbulent or laminar debris flows. Regular silty lenses near the top of shale facies may suggest partition or transit through the final stage of deposition (Haughton et al., 2003; Postma et al., 1988).
5.1.2 Interpretation of red shale facies
Mudstone or shales are usually deposited by hemi pelagic mud and low-energy turbidity currents (Zakaria et al., 2013). Pebbly mudstones are sandstone and mudstone pebbles and clasts in a silty mudstone matrix (Crowell, 1957). Rapid sand and gravel deposition on liquid, uncompacted mudstones promote dewatering and mixing. Pebbly mudstones may be debris-flow deposits. This facies exhibits current turbidity deposition. They may be relics of a big stream that deposited most of its sediments nearby. Current-ripples and climbing-current ripples suggest enough sediment supply to aggrade bedforms. Current-rippled and wavy/planar laminated intervals also indicate sediment supply (Bayliss and Pickering, 2015; Di Celma, 2011; Henstra et al., 2016; Mueller et al., 2017; Zakaria et al., 2013).
5.1.3 Interpretation of dark brown facies
This facies is deposited by a mature, low-density, pulsatory turbidity current in hemiplegic environment and turbulence from low density clouds (Zakaria et al., 2013). This facies was formed by hemipelagic mud particles and low-energy turbidity currents. Stressed environments have bioturbation-free mudstones (Zakaria et al., 2013).
5.1.4 Interpretation of light grey facies
The massive beds of the light grey facies are made by turbulence that stops sediment from settling at an early, highly concentrated flow stage. Low-density turbidity currents and bedload traction can be seen in the beds. Low-energy, non-erosive flows are shown by a sharp, flat base with no flutes or grooves. The light grey shale facies was made by hemipelagic mud particles falling out of suspension and muddy turbidity flows in a low-energy setting (Zakaria et al., 2013). Bioturbation-free mudstones indicate a stressed environment.
5.1.5 Depositional environment
Based on the analysis of the different facies (Fig. 6a) and their interpretation, the rocks analyzed in this study were deposited in a marine setting, as indicated by (Hutchison and Tan, 2009; Surjono et al., 2020). The four different facies types are assumed to have been deposited by turbidites (Fig. 6b). The facies were deposited by hemipelagic mud particles in a low-energy environment, with the occasional pebbly clasts being deposited by debris flow. A turbidity current is a newtonian, turbulent sediment flow deposits sediment through suspension settling (Shanmugam, 2006). Turbidity currents are non-uniform, surge-type fading flows (Shanmugam, 2006). Turbulent mixing causes turbidity currents to entrain seawater as they travel downslope (Allen, 1985). Unlike debris flows, turbidity currents lack the strength to convey gravel and coarse-grained sand in suspension.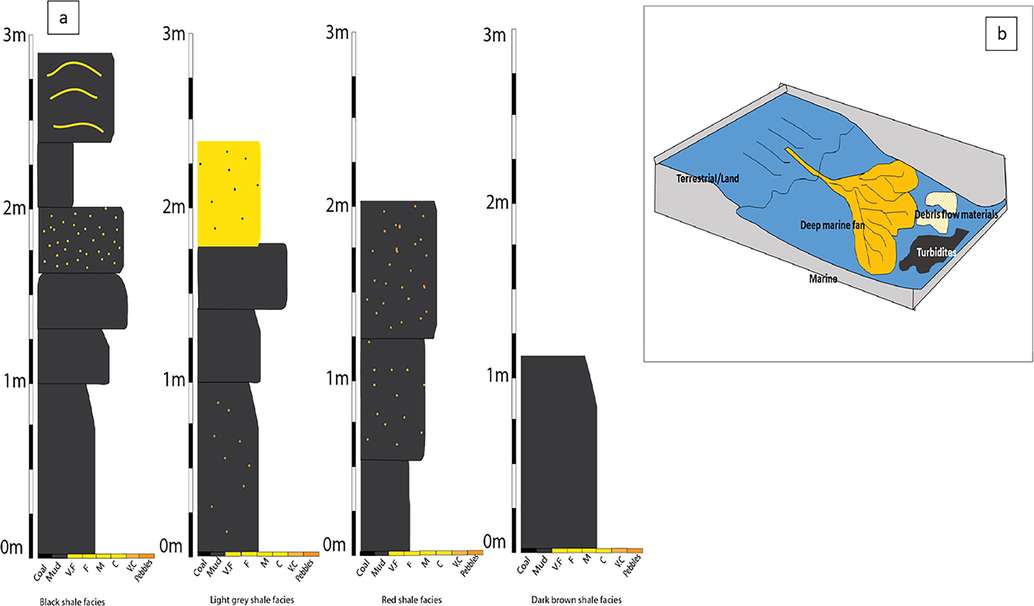
(a) Showing the stratigraphic logs of the various facies studied (b) showing the depositional model of the facies in the Dohol formation.
5.2 Mineralogy
The trends in the XRD analysis are quite similar, with a few exceptions. According to the ternary diagram by (Gamero-Diaz et al., 2013), superposition with a sCore lithology classification shows that most of the shale samples from the Dohol Formation are mixed argillaceous mudstone (Fig. 7). For the ternary diagram in Fig. 7, quartz, feldspar, and mica were grouped as QFM, whereas kaolinite, chlorite, illite and montmorillonite were also grouped as clays and finally calcite, dolomite, and siderite were represented as carbonates. The ternary diagram indicates that the rocks samples are poor in carbonate minerals and rich in clay and quartz-feldspar-mica minerals (Fig. 7). The most abundant clay minerals are kaolinite and illite, each contributing 15.1 percent and 13 percent respectively to the overall average. The relatively high presence of illite and kaolinite compared to the other clay minerals confirms a paleohumid deep marine environment of deposition (AlQuraishi et al., 2020). The results from the XRD ternary diagram agree with the findings of the depositional environment made with the facies analysis. Both analyses indicate that the rocks are from marine environment.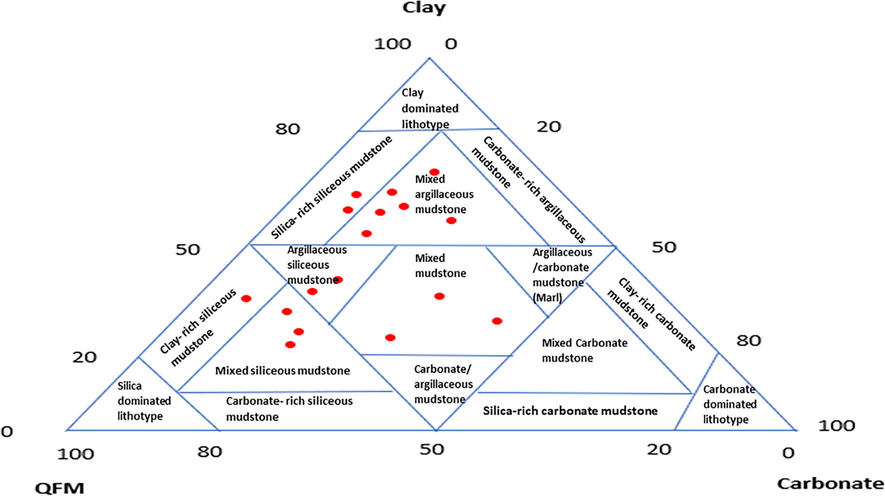
sCore lithotype classification of Dohol formation’s shales. Modified after (Gamero-Diaz et al., 2013).
5.3 Richness of organic matter
Organic richness measures the quantity of organic matter in the sediment capable of generating hydrocarbon, not just the amount of organic matter available (Dembicki, 2016). According to the TOC classification (Peters, 1986), the shales from the Dohol Formation are poor in organic matter richness. The average TOC from all the shale facies is 0.40 wt%, indicating that the shales contain a low amount of organic matter. However, the dark grey shale facies have the highest TOC value among the others, with an average TOC value of 0.69 wt%, which shows that the richness is intermediate. This supports the claim that black shale has more organic matter than other shales (Speight, 2016). All the other shale facies have very poor organic richness, with TOC values less than 0.2 wt% (Table 2). However, it is not advisable to use only TOC to determine how much hydrocarbon sediments can generate (Dembicki, 2009). As a result, it is also necessary to analyze the amount of organic matter that will generate hydrocarbons, which can be accomplished by combining TOC with S2 (Dembicki, 2009). Some of the organic matter in sediments produces oil, while some produce gas, and others produce nothing (Tissot et al., 1974). Combining TOC and S2 will give an idea of the amount of organic matter present and how much hydrocarbon is associated with the TOC. Organic matter decreases as the sediment generates and expels hydrocarbon (Daly and Edman, 1987) (Fig. 8a). This means the TOC and S2 will decrease as the sediment generates hydrocarbons. Therefore, the low amount of organic matter present could result from the mature nature of the organic matter.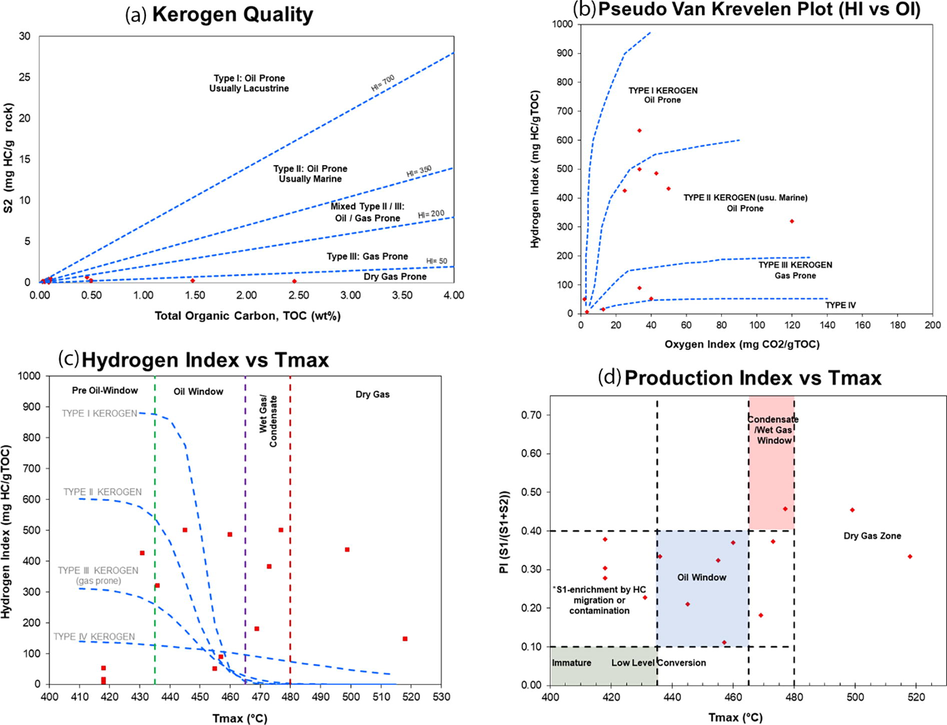
(a) A plot of S2 vs TOC showing hydrocarbon yield potential (b) A plot of HI versus OI showing the type of kerogen (c) A plot of HI vs Tmax showing thermal maturity of the studied samples (d) A plot of PI vs Tmax showing maturity of studied samples.
5.4 Quality of organic matter
Rock eval-pyrolysis is highly relied on to provide information regarding the type of kerogen (Baskin, 1997; Dembicki, 2016; Espitalie et al., 1977). The data obtained allow the derivation of HI and OI, equivalent to the H/C atomic ratio and O/C atomic ratio, respectively (Baskin, 1997; Espitalie et al., 1977; Peters, 1986). Rock-Eval employs HI and OI plotted on a pseudo-van Krevelen diagram to interpret source quality (Dembicki, 2016). Fig. 8b shows that most of the type II and III samples had low HI and OI. Type I kerogens are generated from lacustrine algal material, generating waxy oil. Type II is also derived from autochthonous organic materials deposited in decreasing marine settings and yields naphthenic oil. Type III is generated by terrestrial plant debris or aquatic organic materials in an oxidizing environment (Tissot et al., 1974). However, Type IV kerogen originates from the alteration or oxidation of organic components in the depositional environment which make it inert (Tissot and Welte, 1984).
Moreover, due to the low S2 and TOC values, the samples plotted in Fig. 8 do not clearly interpret the type of kerogen found in the samples. Therefore, the HI vs S2/S3 classification from (Peters, 1986) provided a clearer kerogen type for the samples. This classification showed that most shale samples would generate oil and gas.
5.5 Maturity of organic matter
Time and temperature increase the reflectivity of vitrinite, which was discovered in coals and later used to determine its rank or thermal maturity (Teichmüller and Teichmüller, 1982). After vitrinite was accepted as a source rock kerogen component, systematic increments in vitrinite reflectance were related to sediment hydrocarbon production history and used as a source rock maturity indicator (Dembicki, 2009; Teichmüller and Teichmüller, 1982). According to the standard interpretations of the phases of hydrocarbon exploration by (Dow, 1977), the samples are in the late oil generation zone. However, samples 1, 4, and 8 had Ro values that were out of range. This could probably occur due to a lack of vitrinite (Dembicki, 2016). Due to a lack of significant contributions from higher plants, some depositional environments could have very low levels of locally sourced vitrinite (Dembicki, 2016).
Furthermore, due to its higher plant origins, vitrinite should not be found in lower Paleozoic and Precambrian Pre-Devonian sediments (Dembicki, 2009). Researchers normally use plots of Tmax versus HI and PI to determine sedimentary rock's hydrocarbon potential and maturity. In addition, Tmax values are extensively used to evaluate the maturity of organic-rich rocks. The Tmax readings, which range from 430 °C to 470 °C, are assumed to be mature source rocks located in the top oil and gas window. (Dorrins et al., 2016). The HI vs Tmax plots in Fig. 8c indicate that most samples have matured to the extent that they have formed oil, wet gas, or dry gas condensate, with only a few in the pre-oil zone. The PI and Tmax plots in Fig. 8d indicate that the kerogen has matured enough to form hydrocarbon.
6 Conclusion
The field attributes and organic geochemical properties of the shales of the Dohol Formation were analyzed to determine their ability to generate hydrocarbons. The XRD and facies analysis suggests the similarities in the different facies result from their emergence from the same depositional environment. The different rock facies had similar characteristics indicating a deep marine system. The organic geochemical analysis shows that the potential of these rocks to generate hydrocarbons is low due to their already matured organic matter. The low TOC of the samples can be attributed to the matured nature of the samples. The matured nature of the shales could be because of the tectonic activities of the area.
Acknowledgement
The authors would like to use this opportunity to extend their gratitude to the technicians at the geoscience department for their assistance.
Funding statement
The authors would like to show their appreciation to Universiti Teknologi PETRONAS and the Institute of Hydrocarbon Recovery (IHR) for supporting this research with YUTP Grants (015LC0-363) and (015LC0-366).
Declaration of Competing Interest
The authors declare that they have no known competing financial interests or personal relationships that could have appeared to influence the work reported in this paper.
References
- Evaluation of hydrocarbon source rock potential: Deep marine shales of Belaga Formation of Late Cretaceous-Late Eocene, Sarawak, Malaysia. J. King Saud Univ. – Sci.. 2021;33(1):101268
- [Google Scholar]
- Petroleum source rocks characterization and hydrocarbon generation. Recent Insights Petrol. Sci. Eng. 2018:3-30.
- [Google Scholar]
- Allen, J., 1982. Structures and sequences related to gravity-current surges. Sedimentary Structures. Their Character and Physical Basis. Amsterdam: Elsevier: 395–431.
- Loose-boundary hydraulics and fluid mechanics: selected advances since 1961. Geol. Soc., London, Sp. Publ.. 1985;18(1):7-28.
- [Google Scholar]
- The Influence of shales characteristics on CO2 adsorption behaviour under sub-critical conditions. IOP Conf. Series: Earth Environ. Sci. 2018
- [Google Scholar]
- Silurian qusaiba shale: Petrophysical, mineralogical and geochemical analysis. J. Petrol. Sci. Eng.. 2020;192:107209
- [Google Scholar]
- Mineralogy and geochemistry of Palaeozoic black shales from Peninsular Malaysia: Implications for their origin and maturation. Int. J. Coal Geol.. 2016;165:90-105.
- [Google Scholar]
- Atomic H/C ratio of kerogen as an estimate of thermal maturity and organic matter conversion. AAPG Bull.. 1997;81:1437-1450.
- [Google Scholar]
- Deep-marine structurally confined channelised sandy fans: middle Eocene Morillo system, Ainsa basin, Spanish Pyrenees. Earth Sci. Rev.. 2015;144:82-106.
- [Google Scholar]
- Deep-water Sandstones, Brushy Canyon Formation, West Texas, 40. Oklahoma: American Association of Petroleum Geologists Tulsa; 1999.
- The morphology and dynamics of low amplitude bedwaves upon upper stage plane beds and the preservation of planar laminae. Sedimentology. 1992;39(5):737-752.
- [Google Scholar]
- Burton, C.K., Gobbett, D.J., Hutchison, C.S., 1973. Geology of the Malay Peninsula, West Malaysia and Singapore. Edited for the Geological Society of Malaysia by DJ Gobbett and CS Hutchinson from the Contributions of CK Burton [and Others], Etc. Wiley-Interscience.
- Critical considerations when assessing hydrocarbon plays using Rock-Eval pyrolysis and organic petrology data: Data quality revisited. Int. J. Coal Geol.. 2015;152:113-122.
- [Google Scholar]
- Daly, A.R., Edman, J.D., 1987. Loss of Organic Carbon from Source Rocks During Thermal Maturation.
- Three common source rock evaluation errors made by geologists during prospect or play appraisals. AAPG Bull.. 2009;93(3):341-356.
- [Google Scholar]
- Dembicki, H., 2016. Practical Petroleum Geochemistry for Exploration and Production.
- Sedimentology, architecture, and depositional evolution of a coarse-grained submarine canyon fill from the Gelasian (early Pleistocene) of the Peri-Adriatic basin, Offida, central Italy. Sed. Geol.. 2011;238(3–4):233-253.
- [Google Scholar]
- Dorrins, P.K., Marcil, J.-S., Lavoie, J., Mechti, N., 2016. Anticosti Island, Quebec: Updated Review of a Major Shale Play in North Eastern America.
- Espitalie, J., Madec, M., Tissot, B., Mennig, J.J., Leplat, P., 1977. Source Rock Characterization Method for Petroleum Exploration.
- The Palaeozoic sedimentary rocks of Peninsular Malaysia – Stratigraphy and correlation. Proc. Workshop on Stratigraphic Correlation of Thailand and Malaysia. 1983;1:1-19.
- [Google Scholar]
- sCore: a mineralogy based classification scheme for organic mudstones. In: Proceedings – SPE Annual Technical Conference and Exhibition. 2013. p. :3.
- [Google Scholar]
- Contraction and extension in northern Borneo driven by subduction rollback. J. Asian Earth Sci.. 2013;76:399-411.
- [Google Scholar]
- ‘Linked’debrites in sand-rich turbidite systems–origin and significance. Sedimentology. 2003;50(3):459-482.
- [Google Scholar]
- Depositional processes and stratigraphic architecture within a coarse-grained rift-margin turbidite system: The Wollaston Forland Group, east Greenland. Mar. Pet. Geol.. 2016;76:187-209.
- [Google Scholar]
- Hutchison, C.S., Tan, D.N.K., 2009. Geology of peninsular Malaysia. Published jointly by the University of Malaya [and] the Geological Society ….
- Permian fusulinaceans from the Sungei Sedili area, Johore, Malaysia. Geol. Palaeont. Southeast Asia. 1979;20:95-118.
- [Google Scholar]
- Ismail, H.H., Madon, M. and Bakar, Z.A.A., 2007. Sedimentology of the Semantan formation (middle-upper Triassic) along the Karak-Kuantan highway, Central Pahang.
- Jarvie, D.M., Claxton, B.L., Henk, F. and Breyer, J.T., 2001. Oil and shale gas from the Barnett Shale, Ft, Worth Basin, Texas (abs.): AAPG Annual Meeting Program, pp. A100.
- Factors Controlling the Development of Lacustrine Petroleum Source Rocks-an Update. American Association of Petroleum Geologists; 1995.
- Khoo, T. and Tan, B., 1983. Geological evolution of peninsular Malaysia.
- Basic petroleum geochemistry for source rock evaluation. Oilfield Rev.. 2011;23(2):32-43.
- [Google Scholar]
- Gondwanaland origin, dispersion, and accretion of East and Southeast Asian continental terranes. J. S. Am. Earth Sci.. 1994;7(3–4):333-347.
- [Google Scholar]
- Gondwanaland dispersion, Asian accretion and evolution of eastern Tethys. Aust. J. Earth Sci.. 1996;43(6):605-623.
- [Google Scholar]
- Palaeozoic-Mesozoic history of SE Asia. Geol. Soc., London, Special Publ.. 2011;355(1):7-35.
- [Google Scholar]
- Tectonic framework and Phanerozoic evolution of Sundaland. Gondwana Res.. 2011;19(1):3-21.
- [Google Scholar]
- Devonian and Carboniferous stratigraphy and conodont biostratigraphy of the Malay Peninsula in a regional tectonic context. Stratigraphy 2017
- [Google Scholar]
- Palaeozoic and Mesozoic geological evolution of the SE Asian region: multidisciplinary constraints and implications for biogeography. Biogeogr. Geol. Evol. SE Asia. 1998;25:41.
- [Google Scholar]
- Hybrid event beds in the proximal to distal extensive lobe domain of the coarse-grained and sand-rich Bordighera turbidite system (NW Italy) Mar. Pet. Geol.. 2017;86:908-931.
- [Google Scholar]
- Geochemical and lithological controls on a potential shale reservoir: Carboniferous Holywell Shale, Wales. Mar. Pet. Geol.. 2016;71:198-210.
- [Google Scholar]
- U-Pb zircon geochronology of Early Permian to Late Triassic rocks from Singapore and Johor: A plate tectonic reinterpretation. Gondwana Res.. 2014;26(1):132-143.
- [Google Scholar]
- Organic geochemical analyses of the Belata black shale, Peninsular Malaysia; implications on their shale gas potential. J. Nat. Gas Sci. Eng. 2019
- [Google Scholar]
- Peng, L., Leman, M., Karim, R. and Peng, L., 2004. Stratigraphy Lexicon of Malaysia.
- Guidelines for evaluating petroleum source rock using programmed pyrolysis. AAPG Bull.. 1986;70(3):318-329.
- [Google Scholar]
- Peters, K.E. and Cassa, M.R., 1994. Applied source rock geochemistry: Chapter 5: Part II. Essential elements.
- Applications of petroleum geochemistry to exploration and reservoir management. Org Geochem.. 2002;33(1):5-36.
- [Google Scholar]
- Chapter 3 – geochemistry applied to evaluation of unconventional resources. In: Ma Y.Z., Holditch S.A., eds. Unconventional Oil and Gas Resources Handbook. Boston: Gulf Professional Publishing; 2016. p. :71-126.
- [Google Scholar]
- Large floating clasts in turbidites: a mechanism for their emplacement. Sed. Geol.. 1988;58(1):47-61.
- [Google Scholar]
- Ramachandran, K., Babu, V., Behera, B.K. and Harinarayana, T., 2013. Source rock analysis, thermal maturation and hydrocarbon generation using rock-eval pyrolysis in parts of Krishna–Godavari basin, India: a case study. Journal of Petroleum Exploration and Production Technology.
- Tectonic evolution of the Sibumasu-Indochina terrane collision zone in Thailand and Malaysia: constraints from new U-Pb zircon chronology of SE Asian tin granitoids. J. Geol. Soc.. 2012;169(4):489-500.
- [Google Scholar]
- Granitic magmatism, basement ages, and provenance indicators in the Malay Peninsula: insights from detrital zircon U-Pb and Hf-isotope data. Gondwana Res.. 2011;19(4):1024-1039.
- [Google Scholar]
- Myanmar and Asia united, Australia left behind long ago. Gondwana Res.. 2016;32:24-40.
- [Google Scholar]
- Deep-water processes and facies models: Implications for sandstone petroleum reservoirs. Elsevier; 2006.
- 1 - Introduction to fuel flexible energy. In: Oakey J., ed. Fuel Flexible Energy Generation. Boston: Woodhead Publishing; 2016. p. :3-27.
- [Google Scholar]
- Deposit structure and processes of sand deposition from decelerating sediment suspensions. J. Sediment. Res.. 2008;78(8):529-547.
- [Google Scholar]
- Surjono, S.S., Leman, M.S., Ali, C.A. and Mohamed, K.R., 2006. A review of the Palaeozoic lithostratigraphy of East Johor, Malaysia.
- A combined petrographic-geochemical provenance and tectonic setting study of Palaeozoic Rocks, in East Johor Basin, Peninsular Malaysia. Indonesian J. Geosci.. 2020;8(1):11-24.
- [Google Scholar]
- Subaqueous sediment density flows: depositional processes and deposit types. Sedimentology. 2012;59(7):1937-2003.
- [Google Scholar]
- Teichmüller, M., Teichmüller, R., 1982. The geological basis of coal formation. Stach's Textbook of Coal Petrology, 3: 5–86.
- Influence of nature and diagenesis of organic matter in formation of petroleum. AAPG Bull.. 1974;58(3):499-506.
- [Google Scholar]
- From kerogen to petroleum. In: Petroleum formation and occurrence. Springer; 1984. p. :160-198.
- [Google Scholar]
- Mineralogy and geochemistry of Mississippian and Lower Pennsylvanian Black Shales at the Northern Margin of the Variscan Mountain Belt (Germany and Belgium) Int. J. Coal Geol.. 2012;103:92-108.
- [Google Scholar]
- Wust, R.A., Hackley, P.C., Nassichuk, B.R., Willment, N. and Brezovski, R., 2013. Vitrinite reflectance versus pyrolysis Tmax data: Assessing thermal maturity in shale plays with special reference to the Duvernay shale play of the Western Canadian Sedimentary Basin, Alberta, Canada.
- Sedimentary facies analysis and depositional model of the Palaeogene West Crocker submarine fan system, NW Borneo. J. Asian Earth Sci.. 2013;76:283-300.
- [Google Scholar]
- Zou, C., 2013. Chapter 5 – Shale Gas. Unconventional Petroleum Geology: 149–190.


