

Translate this page into:
Factors in critical management practices for construction projects waste predictors to C&DW minimization and maximization
⁎Corresponding author. xsu@zju.edu.cn (Xing Su)
-
Received: ,
Accepted: ,
This article was originally published by Elsevier and was migrated to Scientific Scholar after the change of Publisher.
Peer review under responsibility of King Saud University.
Abstract
There has been a significant increase in the amount of construction and demolition waste (C&DW) produced over the past few decades, posing challenges to the construction industry and endangering environmental and sustainable development. Therefore, the present study is conducted with an objective to determine the association among factors in critical management practices that contribute in waste maximization and minimization in construction projects. A cross-sectional survey was conducted using a structured questionnaire. The population of this study comprised of project managers, field engineers, consultants, civil engineers, working in the construction industry in Pakistan. The ‘confirmatory factor analysis’ (CFA) was applied to validate the measurement model, based on five latent factors and 27 observed variables for construction waste maximization (case study- I), and five latent factors and 28 observed variables for construction waste minimization (case study- II). The Cronbach's alpha value < 0.05 was set to determine the association among factors. The results demonstrated a significant correlation between each of the five parameters connected to construction waste maximization and minimization. The results of the study concluded that critical management practices such as contract management, materials logistics management, materials reuse, waste segregation, and onsite practices are strongly correlated with each other and are contributing factors in the minimizing the waste in the construction sites. The study is novel in terms of identifying the contributing factors in construction waste maximization and minimization, as well as determining the relationship among these factors. The study carries some important practical implications in terms of illustrating the two proposed models on factors influencing to construction waste minimization and maximization.
Keywords
Construction waste
Waste minimization factors
Waste maximization factors
Critical management practices
Pakistan construction industry

1 Introduction
Waste is a type of loss that occurs during the construction process and adds no value to the project while incurring direct and indirect expenditures (Formoso, 1999; Begum et al., 2006; Lau et al., 2008). Based on the cost-effectiveness of waste management, construction waste is divided into two major categories: “natural or inevitable” waste and “prospective or avoidable” waste. Regardless of the project type, natural waste is the most common kind of waste. For instance, 1.91 percent of private commercial projects employ natural waste for reinforcement due to cost-cutting (Ulubeyli et al., 2017), therefore the expense of cutting back is higher than the price of saving up (Formoso, 1999). Products with wider discrepancies between maximum and minimal waste levels will cost more to produce than they will to save (Ulubeyli et al., 2017).
Products that have a large margin to reduce the difference between the maximum and minimum levels of waste are categorized as prospective or avoidable waste (Nagapan et al., 2012). On the other hand, structure and finishing wastes are two types of physical waste. Materials used in structural works, such as concrete, steel, and bricks, produce structure waste. Finishing waste is found in materials such as mosaics, cement, tiles, and paint that are used to complete projects (Poon et al., 2001). Waste is caused by a variety of circumstances, including ‘improper handling’, ‘transportation and procurement problems’, ‘design modifications’, ‘improper storage’, ‘inadequate labor skills’, and ‘subcontracting agreements’. Chen et al., (2002) reported the significance of worker behavior and skills in waste creation. Similar results have been obtained for the Palestinian construction industry, demonstrating the importance of worker conduct with regard to waste control because most waste is produced as a result of worker negligence and incompetence (Al-Sari et al., 2012). Many avoidable wastes are nevertheless subject to employee commitment even in the absence of an appropriate management and compensation framework (Kulatunga et al., 2006). The worker’s conduct, commitment, and collectivism toward waste reduction were recognized as three significant characteristics. A group-based ‘Incentive Reward Program’ (IRP) may cut waste considerably (Chen et al., 2002). Finally, the kind of subcontracting agreements has an impact on the waste creation rate. According to the findings, the most wasteful subcontracting arrangement is labor only (L-O), while direct labor (D-L) has medium waste and labor plus material (L-M) has the least waste (Craven et al., 1994; Al-Hajj & Hamani, 2011; Bekr, 2014). In addition, unpackaged supplies, damaged while delivery, and poor packaging and supplies are all examples of improper material handling, which is a significant source of waste (Craven et al., 1994; Al-Hajj; Bekr, 2014; & Hamani, 2011). Purchase and procurement techniques, such as improper ordering and transportation, may lead to waste (Al-Hajj and Hamani, 2011). Other factors include items that do not meet standards and a lack of a competent procurement strategy (Bossink and Brouwers, 1996). Moreover, design modifications have also been noted as a significant cause of construction waste (Bekr, 2014). Waste may happen if supplies are replaced and then returned after the contractor has already purchased them in accordance with the original plan. Furthermore, if the building has already been constructed, any design modifications would be wasteful because they would require the removal or demolition of the current components. Additionally, improper and ineffective storage, such as storing cement in a moist or humid environment, is a significant cause of waste (Bekr, 2014; Bossink & Brouwers, 1996; & Enshassi, 1996). John and Itodo (2013) asserted that improper material stacking results in waste. Construction waste management practices are extremely beneficial in maintaining a construction environment that is environmentally friendly (Ali et al., 2019). Many studies have been conducted to highlight various waste management practices that could be applied in construction projects (Zia et al., 2022; Zia and Khan, 2021). According to these studies, general waste management practices for the construction industry may be divided into five categories known as the 5Rs: “recover, reduce, reuse, recycle, and dispose”. Construction waste (CW) recycling is recommended in a few states of the United States of America (USA) and the European Union (EU) where concrete supplies are few. A strategy was developed, as well as various concrete plans for recycling and sorting (Wang et al., 2019).
Recycling is now the most environmentally benign method of treatment in terms of overall global warming potential (de Magalhães et al., 2017; Dinesh et al., 2017; Ulubeyli et al., 2017). Recycling is a relatively recent practice in several European Union (EU) nations (Wang et al., 2019; Zheng et al., 2017). On the other hand, other researchers claim that waste management solutions may be categorized as the 3Rs, which include reuse, reduction, and recycling. Furthermore, the construction industry is considered as a major source of greenhouse gas emissions (Jain, 2021). Each year, it is anticipated that the worldwide construction sector will use ‘25 %’ of wood and ‘40 %’ of raw stone, gravel, and sand (Guerra et al., 2020). Almost ‘50–60 %’ of construction expenditures are attributed to material costs alone, while 9 % of all materials purchased are wasted (Kolaventi et al., 2019). Together with the advantages of urbanization, vast infrastructure, and rebuilding, construction projects have led to an alarming rise in the production of construction and demolition trash in recent years (Jain, 2021). If construction waste (CW) is not properly managed, it has a substantial detrimental impact on the environment, resulting in severe air pollution with higher levels of particulate matter and aerosols, due to a lack of disposal sites and commodities such as aggregates (Kolaventi et al., 2018). Based on the above discussion the study aims at identifying the factors that contribute in maximizing and minimizing the construction waste. It also aims at determining the relationship, if any, among these factors in the maximization and minimization of construction waste. However, in the present study, different concepts and factors are incorporated in order to evaluate the elements responsible for waste maximization and minimization. Based on which, a theoretical framework of the present study is presented in the Fig. 1.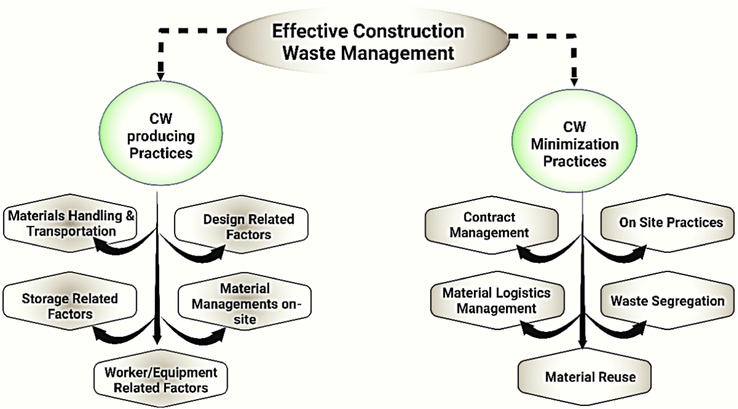
Research framework (Source-Autor’s).
2 Research methodology
This study has chosen to follow the positivist research philosophy for a variety of reasons. The first is that the researcher has kept his independence from the research sample. Furthermore, the procedures used in this investigation are measurable; for instance, the data may be approximated and reproduced by future researchers. Aside from that, previous studies on the subject issue have used the same approach, which might be another reason to accept positivism. This will undoubtedly aid in addressing the research question and allowing the study to achieve greater generality. The population of this study comprised of project managers, field engineers, consultants, civil engineers, working in the construction industry in Pakistan. Using a non-probability sampling, the research has adopted convenient sampling to collect the data from the participants from bigger cities in Pakistan, such as Karachi, Lahore, Islamabad, Faisalabad, and Peshawar. The reason to select these cities include that they are recognised to have the most complex and dominating systems (Nawaz et al., 2019).
The selection of these places provides an adequate orientation for data gathering and encompasses the waste parts of the construction sector throughout several metropolitan cities. The data collection approach used in this study was a survey. A questionnaire was used to conduct the survey. The instrument for this study comprised of three parts (A B & C). Part A asked about demographic information like job title, working experience, and type of project. The part B of the questionnaire comprised of five sub-scales having 27 items against five latent factors, measuring factors that contribute construction waste maximization (as shown in Table 1) and this explains the CASE-1 in the analysis section. The part C contained 28 items under five latent factors related to minimizing construction waste (as shown in Table 2) which explains the CASE-2 in the analysis section. A research instrument for this study was developed using 55 items that were carefully identified based on a thorough review of the literature on the construction waste management.
Frequency
Percentage
Job Title
Field Engineer
72
20.6
Civil Engineer
197
56.3
Consultant
49
14.0
Project Manager
32
9.1
Total
350
100.0
Experience in Years
<5
20
5.7
05–09
192
54.9
10–20
111
31.7
>20
27
7.7
Total
350
100.0
Type of Project
Buildings
80
22.9
Infrastructure
134
38.3
Motorways and Highways
124
35.4
Dams and bridges
12
3.4
Total
350
100.0
Metropolitan Sites
Karachi
114
32.8
Lahore
97
27.7
Islamabad
51
14.6
Faisalabad
40
11.4
Peshawar
48
13.7
350
100.0
Construct
Items
Measure
Sources
Design related factors
DF1
‘Changing design frequently’
(Al-Hajj and Hamani, 2011; Al-Sari et al., 2012; Bekr, 2014; Chen et al., 2002; John and Itodo, 2013; Kulatunga et al., 2006; Nagapan et al., 2012; Poon et al., 2001; Yusof et al., 2017)
DF2
‘Minimizing design & detailing complexity’
DF3
‘Avoiding the selection of low-quality material’
DF4
‘Avoiding unclear specification’
Storage related factors
SF1
‘Avoid inappropriate storage that lead to damage and deterioration’
SF2
‘Avoid inappropriate storage that lead to deterioration’
SF3
‘Avoid material storage from point of application’
SF4
‘Avoid excessive material storage that has no use in the project’
Worker/Equipment related factors
EF1
‘Lack of experience or untrained workers
EF2
Worker exhausted Due to too much overtime (Time pressure)’
EF3
‘Equipment failure’
EF4
‘Rework (e.g. due to use of wrong material, poor workmanship)’
EF5
‘Use of incorrect material requiring replacement’
Material Management On-Site
MM1
‘Damage of materials on site’
MM2
‘Poor site management and supervision
MM3
Manufacturing defects’
MM4
‘Packaging defects’
MM5
‘Lack of environmental awareness’
MM6
‘Theft and vandalism’
MM7
‘Inadequate control on construction materials in site’
MM8
‘Lack of onsite material control’
MM9
‘Lack of waste management plan’
MM10
‘Waste from cutting uneconomical shapes’
Materials Handling & Transportation
MH1
‘Wrong handling of materials’
MH2
‘Accidents during handling and transportation’
MH3
‘Damage of materials during handling and transportation’
MH4
‘Poor shipping and control on construction materials handling & transportation’
The survey tool was used to more thoroughly assess experts’ opinions on the factors that can contribute in maximizing and minimizing the waste in construction projects. The five factors related to construction waste maximization, such as design (4 items), storage (4 items), worker/equipment (5 items), on-site material management (10 items), and materials handling and transportation (4 items), containing 27 items were used to collect data on part B of the questionnaire. The part C of the questionnaire contained five factors and 28 items such as; contract related management (5 items), materials logistics (5 items), material reuse (8 items), waste segregation (5 items), and onsite practices (5 items).
We chose to utilize a structured questionnaire because it has numerous benefits over an unstructured one, including being particularly simple and flexible to obvious responses (Darby, 2007). In comparison to unstructured questions, the structured inquiry format which incorporates replies to structured queries often yields more trustworthy results. Before distributing the research questionnaire, pilot survey were carried out with specialists to determine the viability and improvement of the study design and questionnaire items. The pre and pilot testing was also done in order to see the reliability and validity of the questionnaire. After thoroughly review, the experts recommended the latent variables for questionnaire after some revisions. The revisions were incorporated. One aspect of initiating the pre and pilot testing was to check the suitability of the questionnaire and get it validated (WRAP, 2007; Ayuso Sanchez et al., 2018). The researchers demonstrate the pilot testing with an average completion time of 10–15 min, randomly selecting 10 respondents from 10 distinct construction sites. After gathering the data, we questioned the respondents about the applicability of the suggested questionnaire and eliminated any unsuitable questions to complete the data collection. In total, 500 questionnaires were distributed among the project managers, field engineers, consultants, civil engineers, working in the construction industry in Pakistan that volunteered to participate. Of the 500 questionnaires distributed among participants, 350 participants retuned the questionnaire with a 70 % response rate of the survey.
We used statistics, such as frequency and ‘percentage’, ‘mean’, and ‘standard deviation (SD)’. The Cronbach alpha was used to measure the internal reliability of the questionnaire. The Cronbach alpha 0.817 for 27 items (Part-B) 0.849 for 28 items (Part-C) showed a good reliability of the scale. Additionally, we used ‘confirmatory factor analysis (CFA)’ to test the measurement model, which was based on five latent factors and 28 observed variables for construction waste minimization and five factors and 27 observed variables for construction waste maximization (see Table 2). To estimate the parameters and assess the convergent and discriminant validity, this model was utilized. To identify the average deviation from the indicators, the studies suggested to examine the convergent validity of latent variables > 0.5 and the individual reliability > 0.7 (Arpaci et al., 2019). When the null hypothesis is rejected, p value < 0.05 is an acceptable level (Lin and Chang, 2011). It is an authentic multivariate strategy that enables researchers to assess a model's impacts (Bilal et al., 2020). We performed the analysis using AMOS software. The alpha value set at < 0.05.
The Table 1 presents the demographic information of the respondents. The majority of the respondents 197 (56.3 %) were civil engineer, 72 (20.6 %) were field engineer. The most 192 (54.9 %) of the respondents had 05 to 09 years of experience, followed by 111 (31.7 %) had 10–20 years working experience. The most 134 (38.3 %) of the project in our sample was relating to infrastructure, 124 (35.4 %) were relating to motorways and highways and 80 (22.9 %) were relating to construction of buildings. The data for this study was collected from 350 different construction sites from five major cities of Pakistan e.g., 114 (32.8 %) construction sites were in Karachi, 97 (27.7 %) in Lahore, and 51 (14.6 %) in Islamabad (as shown in Table 3).
Construct
Items
Measure
Sources
“Contract Management”
CM1
‘Waste target set for sub-trades’
(Hwang & Yeo, 2011; John & Itodo, 2013; Nagapan et al., 2012; Rakib et al., 2021; Spišáková et al., 2021)
CM2
‘Recycling target to be set for every project’
CM3
‘Follow the project drawings/designs’
CM4
‘Ensure fewer design changes during construction’
CM5
‘Making sub-contractors responsible for waste disposal’
“Materials Logistic Management”
ML1
‘Use of safe materials storage facilities
ML2
Prevention of over ordering’
ML3
‘Prevention of double handling of materials/Logistic management to prevent double handling’
ML4
‘Adequate site access for materials delivery and movement’
ML5
‘Central areas for cutting and storage’
“Materials Reuse”
MR1
‘Detect the construction activities that can admit reusable materials from the construction’
MR2
‘Use of reclaimed materials’
MR3
‘Reuse of off-cuts materials (such as wood)’
MR4
‘Use of demolition and excavation materials for landscape’
MR5
‘Sorting and reuse/recycling of waste’
MR6
‘Reuse material scraps from cutting stock-length material into shorter pieces’
MR7
‘Soil remains to be used on the same site’
MR8
‘Maximization of on-site reuse of materials’
“Waste Segregation”
MS1
‘Preventing waste mixture with soil’
MS2
‘Providing bins for collecting wastes for each sub-contractor’
MS3
‘Dedicated space for sorting of waste’
MS4
‘Setting up temporary bins at each construction zone’
MS5
‘Provision of waste skips for specific materials (waste segregation)’
“On Site Practices”
OP1
‘Construction with standard materials’
OP2
‘On-site materials compactors’
OP3
‘Waste auditing to monitor and record environmental performance on-site’
OP4
‘Low Waste Construction Technologies’
OP5
‘Periodic checks on the use of C&D waste containers’
The five latent variables and 28 constructs used in the sub-scale of construction waste management are given in the Table 3. All these constructs and items identified after reviewing the relevant literature and validated from the experts.
3 Findings
The section 3.1 presents the findings of the analysis conducted on the variables related to construction waste maximization (as presented in case study 1). The findings on variables related to construction waste minimization presented in case study II (as shown in 3.2).
3.1 Case study i
The Fig. 2 presents the initial model using confirmatory factor analysis approach. The five latent variables are relating to design, storage, workers/equipment, material management on-site, and factors related to materials handling and transportation. The each item loading on factor related to design ranges from 0.55 to 0.70 that is higher than the minimum accepted loading level of 0.50. Similarly, the loadings on factors related to storage, worker/equipment, and materials handling & transportation, are also above 0.5 that indicates that these items strongly define the factors on which they are loaded. However, of the 10 items related to onsite material management, 05 items value are<0.05 that indicate that these items, such as ‘damage of materials on site’, ‘poor site management and supervision’, ‘manufacturing defects’, ‘packaging defects’, and ‘lack of environmental awareness’, are not strongly defining the main construct.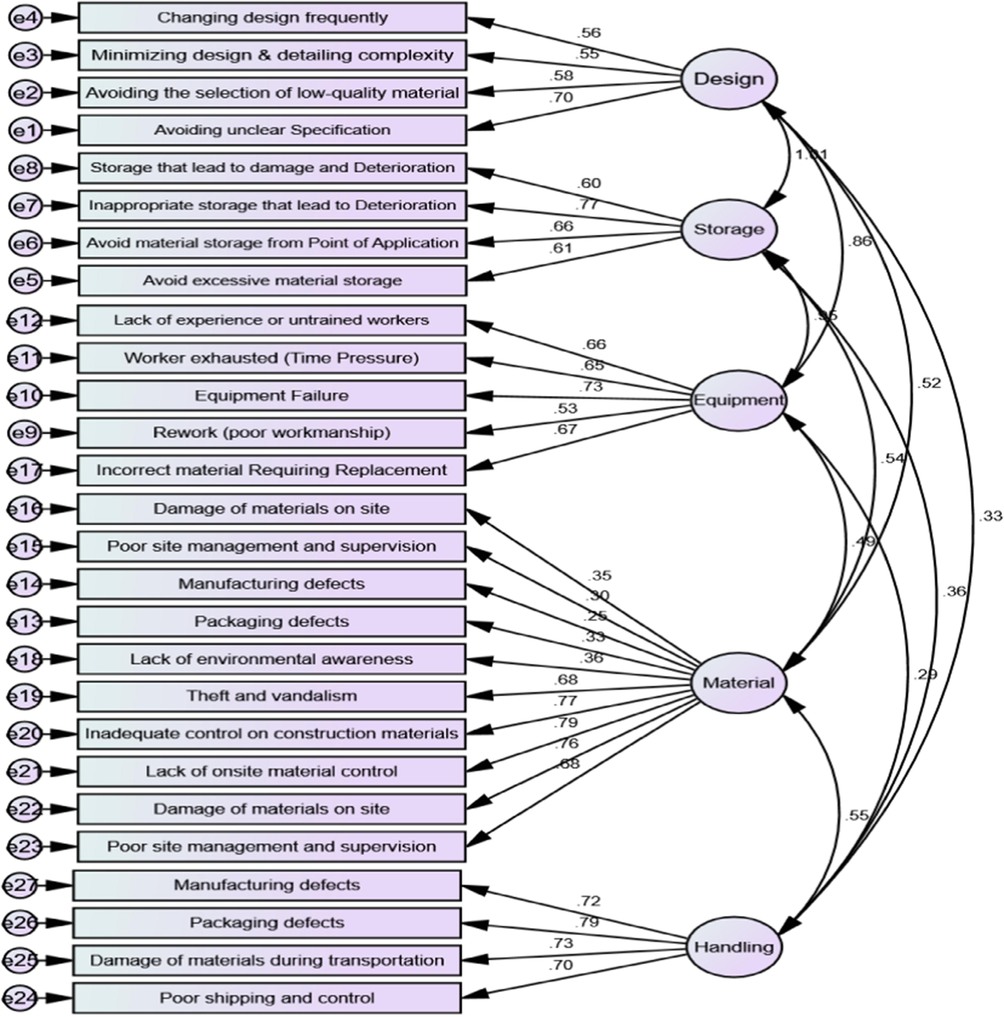
Initial model on factors contributing in construction waste maximization.
Table 4 indicates the covariance values of initial model. The p-value of all these covariance found significant, indicating that design related factors are strongly correlated with storage related factors (r = 0.529, S.E = 0.055, CR = 9.099, P= <0.05), worker/equipment related factors (r = 0.522, S.E = 0.056, CR = 6.552, P= <0.05), on-site material management (r = 0.204, S.E = 0.029, CR = 5.265, P= <0.05), and materials handling & transportation. Similarly, the other factors such as storage related factors, worker/equipment related factors, on-site material management, and materials handling and transportation factors are strongly correlated with each other’s (as shown in Table 4).
Factors
Factors
Estimate
S.E.
C.R.
P- value
Design
< -->
Storage
0.529
0.055
9.099
***
Design
< -->
Worker/equipment
0.522
0.056
6.552
***
Design
< -->
On-site material management
0.204
0.029
5.265
***
Design
< -->
Materials handling & transportation
0.222
0.029
2.942
0.024
Storage
< -->
Worker/equipment
0.450
0.050
6.525
***
Storage
< -->
On-site material management
0.259
0.020
5.292
***
Storage
< -->
Materials handling & transportation
0.262
0.022
5.209
***
Worker/equipment
< -->
On-site material management
0.225
0.022
2.925
0.025
Worker/equipment
< -->
Materials handling & transportation
0.242
0.026
2.925
***
On-site material management
< -->
Materials handling & transportation
0.222
0.022
6.052
***
The values of various initial model fit indices (as shown in Table 5) are not well-within the standard range of model goodness of fit indices. This proves non– significance correlation of the actual and observed model. The Tucker- Lewis Index (TLI) is the comparison of the proposed and measured model for the different values of the chi-square. The “Comparative Fit Index” (CFI) value is used to find the correct model for the inconsistency between the data set and the hypothesized values. It helps in arranging the sample size for the chi square between the fit and normal index model. The first point in the table is the absolute fit indicates how well the data is represented by the researcher. The data is analyzed by CMIN/DF which is basically a chi square divided by the degree of freedom. “Root Mean Square Error” of Approximation (RMESA) is a most commonly applied method which is used to correct the tendency of the Chi-square value. “The Goodness of Fit Index” (GFI) is a measurement between the hypothesized model and the covariance of the data set. The “Adjusted Goodness of Fit Index (AGFI)” corrects the values of the “goodness index GFI”. A GFI value is disturbed by the latent or uncommon variables. The Parsimony Goodness-of-Fit Index (PGFI) value is 0.546 that is above the acceptable value of > 0.5 test support the model which is simply an advancement of the goodness model index. These different tests help in the estimation of different variables of the data set. The overall values (as shown in Table 5) suggest that the model does not fit in the standard model fit indices. Therefore, the revised model with improved model goodness of fit indices is presented in the Fig. 3.
Goodness-of-Fit Measure
Criteria
Values
Remarks
‘CMIN/DF’
≤ 2 or 3
6.336 (p = 0.000)
Fail
‘Tucker–Lewis index’ (TLI)
> 0.9
0.600
Fail
‘Comparative Fit Index’ (CFI)
> 0.9
0.643
Fail
‘Root Mean Square Error of Approximation’ (RMSEA)
< 0.093
0.054
Fail
‘Goodness of Fit Index’ (GFI)
> 0.9
0.657
Fail
‘Parsimony Goodness of Fit Index’ (PGFI)
> 0.5
0.546
Fail
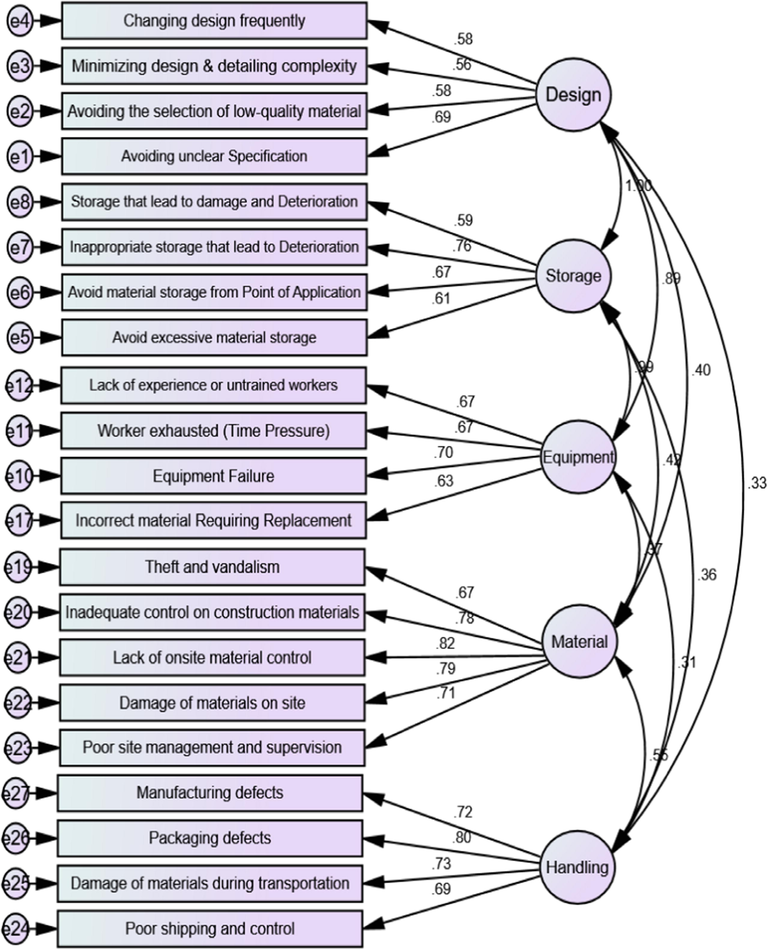
Revised model on factors contributing in construction waste maximization.
The Fig. 3 presents the revised model using confirmatory factor analysis approach. The five latent variables are relating to design, storage, workers/equipment, on-site material management, and factors related to materials handling and transportation. The r value on each of measured item ranges from 0.56 to 0.82 that is greater than the acceptable correlation loading value of > 0.05. The revised model has been estimated in the light of initial model loading values. The loading items which had lower than 0.05 correlation values were removed in the revised model. In total, 06 items from 02 latent variables out of 27 loading items on 05 latent variables were removed from the revised model. Of these 06 removed items, 05 were from latent variable on onsite material management, these items were MM1: “onsite materials damage”, MM2: “poor site management and supervision”, MM3: “manufacturing defects”, MM4: “packaging defects”, MM5: “lack of environmental awareness”, and one item EF4: “rework (e.g., due to use of wrong material, poor workmanship)” has also been removed from worker/equipment related factors.
Table 6 indicates the covariance values of initial model. The p-value of all these covariance found significant, indicating that design related factors are strongly correlated with storage related factors (r = 0.538, S.E = 0.066, CR = 8.089, P= <0.05), worker/equipment related factors (r = 0.513, S.E = 0.067, CR = 7.663, P= <0.05), on-site material management (r = 0.204, S.E = 0.038, CR = 5.375, P= <0.05), and materials handling & transportation. Similarly, the other factors such as storage related factors, worker/equipment related factors, on-site material management, and materials handling and transportation factors are strongly correlated with each other’s (as shown in Table 6).
Factors
Factors
Estimate
S.E.
C.R.
P-value
Design
< -->
Storage
0.561
0.051
6.081
***
Design
< -->
Worker/equipment
0.537
0.057
7.236
***
Design
< -->
On-site material management
0.201
0.041
6.355
***
Design
< -->
Materials handling & transportation
0.306
0.047
2.761
.***
Storage
< -->
Worker/equipment
0.471
0.063
7.413
***
Storage
< -->
On-site material management
0.183
0.037
5.269
***
Storage
< -->
Materials handling & transportation
0.169
0.031
6.141
***
Worker/equipment
< -->
On-site material management
0.135
0.029
3.523
.***
Worker/equipment
< -->
Materials handling & transportation
0.147
0.035
3.953
***
On-site material management
< -->
Materials handling & transportation
0.226
0.039
6.710
***
The values of various model fit indices (as shown in Table 7) are within the standard range which describes that model values are comparable with the values of Model Goodness of fit indices. It indicates significance of the model. The “Tucker- Lewis Index” (TLI) values are greater than the acceptable value > 0.09. The “Comparative Fit Index” (CFI) values are 0.929, and the “Goodness of Fit Index” (GFI) values are 0.922 which are greater than the acceptable values 0.09. The RMSEA values are also 0.046 which is less than the acceptable value of < 0.0.08, indicating that the indices of the revised model support the model. Thus, the revised model is accepted.
Goodness-of-Fit Measure
Criteria
Values
Remarks
‘CMIN/DF’
≤ 2 or 3
2.436 (p = 0.000)
Pass
‘Tucker–Lewis index (TLI)’
> 0.9
0.900
Pass
‘Comparative Fit Index (CFI)’
> 0.9
0.929
Pass
‘Root Mean Square Error of Approximation’ (RMSEA)
< 0.08
0.046
Pass
‘Goodness of Fit Index’ (GFI)
> 0.9
0.922
Pass
‘Parsimony Goodness of Fit Index’ (PGFI)
> 0.8
0.837
Pass
The section 3.2 presents the findings on case study II, indicating the factors that contribute in the minimization of the construction waste, as well as the association of these factors with each other.
3.2 Case study II
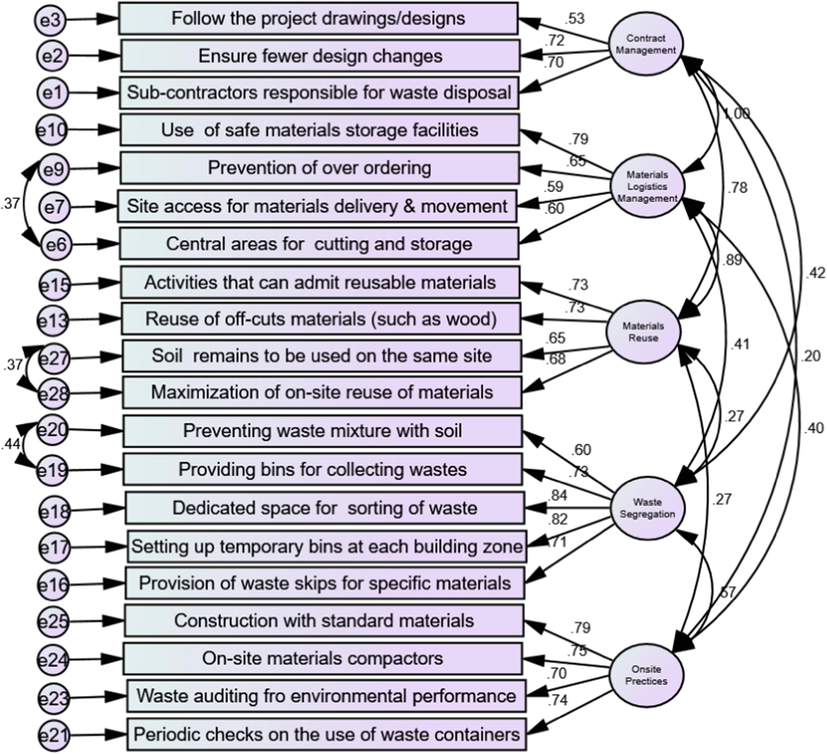
The Fig. 4 presents the initial model using confirmatory factor analysis approach. The five latent variables include “contract management”, “materials logistics management”, “materials reuse”, “waste segregation”, “onsite practices” for minimizing the construction waste in the construction sites. The loading ranged from.54 to.84 on each tested item, which is higher than the permissible loading value of > 0.05.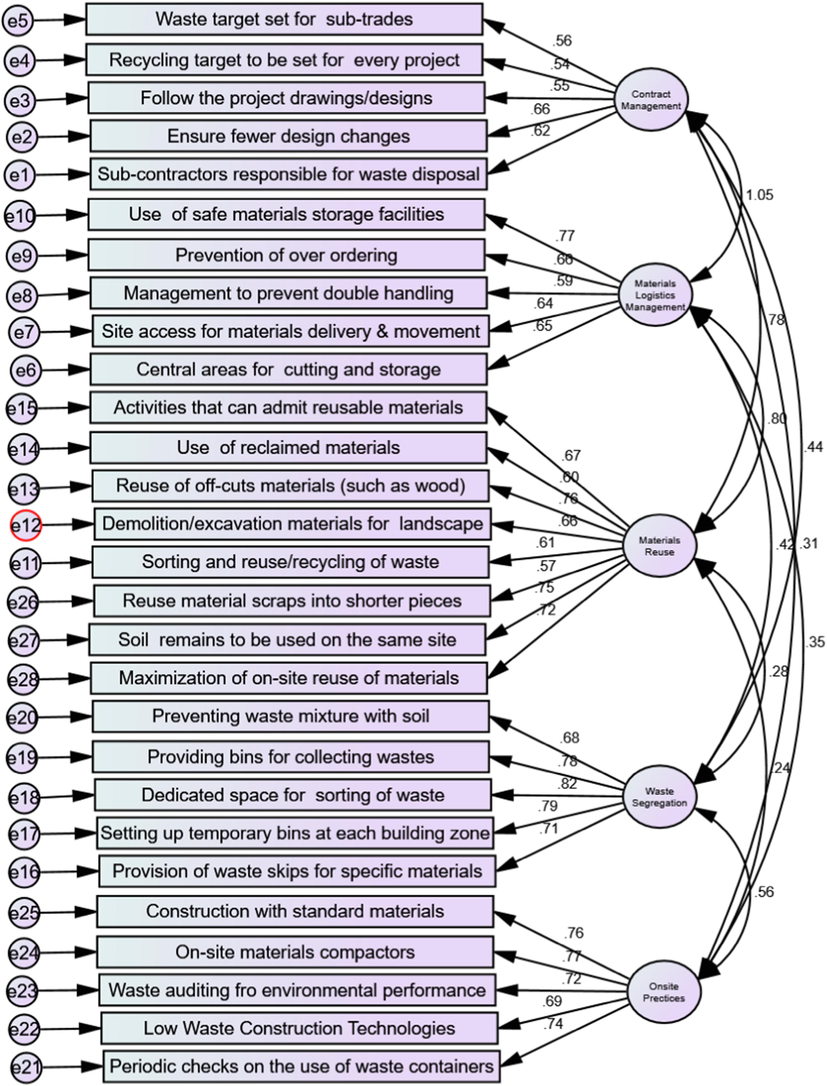
Initial model on factors contributing in construction waste minimization.
Table 8 indicates the covariance values of initial model. The p-value of all these covariances is significant, indicating that contract management is strongly correlated with materials logistics management, materials reuse, waste segregation, onsite practices. Similarly, materials logistics management is significantly positively correlated with materials reuse, waste segregation, and onsite practices. The materials reuse is also positively correlated with waste segregation, onsite practices. The waste segregation is also positively correlated with onsite practices.
Factors
Factors
Estimate
S.E.
C.R.
P-value
Contract
< -->
Materials Logistics
0.550
0.067
8.271
***
Contract
< -->
Materials Reuse
0.405
0.056
7.268
***
Contract
< -->
Waste Segregation
0.194
0.035
5.573
***
Contract
< -->
Onsite Practices
0.151
0.036
4.215
***
Materials Logistics
< -->
Materials Reuse
0.398
0.053
7.499
***
Materials Logistics
< -->
Waste Segregation
0.178
0.032
5.606
***
Materials Logistics
< -->
Onsite Practices
0.163
0.034
4.853
***
Materials Reuse
< -->
Waste Segregation
0.117
0.028
4.162
***
Materials Reuse
< -->
Onsite Practices
0.109
0.030
3.588
***
Waste Segregation
< -->
Onsite Practices
0.216
0.031
7.013
***
The values of initial model fit (as shown in Fig. 4) indices given in Table 9 lie short well within the standard range which describes that model does not fall into Model Goodness of fit Values. This proves non– significance of the model. The “Tucker- Lewis Index” (TLI) is the comparison of the proposed and measured model for the different values of the chi-square. The second point in the Table 9 is the “Comparative Fit Index” (CFI) tries to find the correct model for the inconsistency between the data set and the hypothesized values. It helps in arranging the sample size for the chi square between the fit and normal index model. The first point in the table is the absolute fit indicates how well the data is represented by the researcher. The above data is analyzed by CMIN/DF which is basically a “chi square divided by the degree of freedom”. Root Mean Square Error of Approximation (RMESA) is a most commonly used method which is used to correct the tendency of the Chi-square value. The “Goodness of Fit Index” (GFI) is a “measurement between the hypothesized model and the covariance of the data set”. The Adjusted “Goodness of Fit Index” (AGFI) corrects the values of the goodness index GFI. A GFI value is disturbed by the latent or uncommon variables. The Parsimony “Goodness-of-Fit Index” (PGFI) values are 0.074 that is above the acceptable value of > 0.5 test support the model which is simply an advancement of the goodness model index. These different tests help in the estimation of different variables of the data set. The overall values suggest that the model does not fit in the standard model fit indices 9 as shown in Table 9). Therefore, the model has been revised (as shown in Fig. 5).
Goodness-of-Fit Measure
Criteria
Values
Remarks
‘CMIN/DF’
≤ 2 or 3
4.024 (p = 0.000)
Fail
‘Tucker–Lewis index’ (TLI)
> 0.9
0.769
Fail
‘Comparative Fit Index’ (CFI)
> 0.9
0.792
Fail
‘Root Mean Square Error of Approximation’ (RMSEA)
< 0.093
0.054
Fail
‘Goodness of Fit Index’ (GFI)
> 0.9
0.778
Fail
‘Parsimony Goodness of Fit Index’ (PGFI)
> 0.5
0.074
Fail
Revised model on factors contributing in construction waste minimization.
The Fig. 5 presents the revised model using confirmatory factor analysis approach. The five latent variables include contract management, materials logistics management, materials reuse, waste segregation, onsite practices for minimizing the construction waste in the construction sites. The loading on each of measured item ranges between 0.53 and 0.84 which is greater than the acceptable loading value of > 0.05.
Table 10 indicates the covariance values of initial model. The p-value of all these covariances is significant, indicating that contract management is strongly correlated with materials logistics management, materials reuse, waste segregation, onsite practices. Similarly, materials logistics management is significantly positively correlated with materials reuse, waste segregation, and onsite practices. The materials reuse is also positively correlated with waste segregation, onsite practices. The waste segregation is also positively correlated with onsite practices.
Factors
Factors
Estimate
S.E.
C.R.
P-value
Contract
< -->
Materials Logistics
0.538
0.066
8.089
***
Contract
< -->
Materials Reuse
0.513
0.067
7.663
***
Contract
< -->
Waste Segregation
0.204
0.038
5.375
***
Contract
< -->
Onsite Practices
0.111
0.039
2.841
0.004
Materials Logistics
< -->
Materials Reuse
0.460
0.060
7.615
***
Materials Logistics
< -->
Waste Segregation
0.159
0.030
5.282
***
Materials Logistics
< -->
Onsite Practices
0.171
0.033
5.109
***
Materials Reuse
< -->
Waste Segregation
0.126
0.033
3.825
***
Materials Reuse
< -->
Onsite Practices
0.142
0.037
3.825
***
Waste Segregation
< -->
Onsite Practices
0.223
0.032
7.061
***
The values of various model fit indices (as shown in Table 11) lie well within the standard range which describes that model fall into Model Goodness of fit Values. This indicates significance of the model. The “Tucker- Lewis Index” (TLI) values are greater than the acceptable value > 0.09. The “Comparative Fit Index” (CFI) values are 0.909, and the “Goodness of Fit Index” (GFI) values are 0.910 which are greater than the acceptable values 0.09. The RMSEA values are also 0.074 which is less than the acceptable value of < 0.0.08, indicating that the indices of the revised model support the model. Thus, the revised model is accepted.
Goodness-of-Fit Measure
Criteria
Values
Remarks
‘CMIN/DF’
≤ 3
2.930 (p = 0.000)
Pass
‘Tucker–Lewis index’ (TLI)
> 0.9
0.910
Pass
‘Comparative Fit Index’ (CFI)
> 0.9
0.909
Pass
‘Root Mean Square Error of Approximation’ (RMSEA)
< 0.08
0.074
Pass
‘Goodness of Fit Index’ (GFI)
> 0.9
0.910
Pass
The Standardized residual covariance values of revised model on factors contributing in construction waste minimization were estimated (as shown in Table 12). Value smaller than 2.58 indicates a good covariance between the hypothetical and the data (Dimitroulopoulou et al., 2001). As demonstrated in Table 12, there is no value>2.58. The values range between −023 and 2.514.
MR8
MR7
OS1
OS2
OS3
OS5
WS1
WS2
WS3
WS4
WS5
MR1
MR3
LM1
LM2
LM4
LM5
CM3
CM4
CM5
MR8
0.000
MR7
0.000
0.000
OS1
0.740
0.190
0.000
OS2
−1.858
−1.181
-0.407
0.000
OS3
0.581
0.910
-0.399
0.972
0.000
OS5
-0.246
−1.176
0.463
-0.364
-0.099
0.000
WS1
2.330
0.639
1.006
0.635
−1.606
1.267
0.000
WS2
0.872
0.308
−1.201
0.832
−2.566
-0.581
0.000
0.000
WS3
0.271
0.387
0.061
0.426
−1.135
-0.265
-0.146
0.373
0.000
WS4
0.510
0.232
0.442
0.556
-0.969
-0.407
-0.615
-0.918
0.435
0.000
WS5
0.355
-0.772
1.326
1.850
−1.444
1.739
0.428
0.713
-0.866
0.333
0.000
MR1
−1.044
-0.581
0.253
0.352
0.473
-0.639
0.365
1.079
0.127
-0.484
0.339
0.000
MR3
0.344
1.096
0.281
0.351
1.416
−1.158
1.055
-0.878
-0.417
-0.708
-0.686
0.142
0.000
LM1
-0.077
−1.100
0.436
-0.409
-0.080
−1.450
1.623
1.133
-0.770
−1.364
−2.158
-0.065
-0.240
0.000
LM2
0.712
-0.394
1.962
1.315
2.261
2.002
0.967
0.888
0.014
0.309
1.279
1.435
−1.626
0.117
0.000
LM4
0.094
0.708
−1.328
−1.862
−1.394
−1.512
0.604
1.951
1.757
-0.210
0.134
0.621
0.893
-0.334
-0.570
0.000
LM5
1.531
-0.699
1.509
-0.450
0.870
0.466
1.381
1.096
1.018
-0.770
1.570
1.156
−1.321
-0.502
0.000
2.281
0.000
CM3
0.350
0.882
0.366
-0.877
0.513
-0.948
0.702
0.464
−1.602
−1.598
−1.330
0.192
1.024
0.464
−1.089
1.524
0.561
0.000
CM4
0.941
-0.023
-0.293
1.493
-0.774
0.141
2.501
2.139
-0.100
-0.283
-0.064
0.237
−1.656
0.328
-0.480
-0.611
−1.110
0.560
0.000
CM5
0.858
0.899
0.606
0.225
−1.185
-0.242
1.834
2.514
-0.345
-0.085
-0.839
0.270
−1.228
0.495
-0.217
-0.467
-0.515
−1.752
0.522
0.000
4 Discussion
The present study proposes two models that validate the factors that contribute in maximizing and minimizing the construction waste. The factors related to construction waste minimizations which are validated statistically in the present study are contract management, materials logistic management, materials reuse, and waste segregation. The factors that contribute in the construction waste maximization include design, storage, worker/equipment, onsite material management, and materials handling and transportation. The findings of our study support the findings of other studies that reported waste is caused by a variety of circumstances, including inadequate worker skills (Chen et al., 2002; Kulatunga et al., 2006), behavior and incapability (Al-Sari et al., 2012), and subcontracting agreements has an impact on the waste creation rate (John and Itodo, 2013). The findings of our study are also comparable with the findings of other studies that reported poor material handling is a major cause of waste, which includes damage during shipping, unpacked supplies, and discarded packaging (Al-Hajj and Hamani, 2011; Bekr, 2014; Craven et al., 1994). Waste can result from purchase and procurement practices including poor ordering and delivery (Al-Hajj and Hamani, 2011). Items that don't adhere to standards and a lack of a procurement strategy are further problems (Bossink and Brouwers, 1996). Additionally, it has been highlighted that design modifications account for a sizable portion of construction waste (Bekr, 2014). Supplies that have already been purchased by the contractor in accordance with the initial plan may be wasted if they are changed and subsequently returned. Furthermore, any design modifications would be useless if the structure had already been built because they would call for the dismantling or demolition of the existing components. Our study's results confirm previous research that poor material stacking and inefficient storage, such as keeping cement in a moist or wet environment, are major contributors to waste (Bekr, 2014; Enshassi, 1996). The findings of our study showed a strong positive relationship between materials logistics management and materials reuse in minimizing the construction waste. The other study reported that materials contribute for around 50–60 % of a project's cost; therefore any decrease in waste has a significant impact on project cost savings (Khanh and Kim, 2015). Despite the fact that the Pakistani government has prioritized the management of construction and demolition operations, the rate of recycling is just 5 %, which is extremely low when compared to other developing nations due to poor infrastructure (Bilal et al., 2020; Khan et al., 2020).
The findings of our study found a strong positive relationship between onsite management practices and materials logistics management, contract management, materials reuse, and waste segregation in minimizing the construction waste. The other studies reported that due to inadequate management, untrained personnel, and poor quality standards, several countries across the world are confronting the difficulty of controlling the output of waste materials from the construction sector in the form of tiles, bricks, and cement from construction sites. Countries such as Europe and Malaysia attempted to reduce waste materials output by up to 50 % by enacting legislation and establishing reuse and recycling or multiple approach systems (Allen & Iano, n.d.; Liu et al., 2015). Furthermore, governments and environmental regulatory agencies all over the world have created laws and standards for construction operations in order to reduce harmful environmental consequences (Liu et al., 2020). Developing countries such as Malaysia and South Korea recycle 45–70 % of construction debris yearly by implementing environmental impact assessments (Khan et al., 2020).
The study broadens its discussion and suggests that in construction industry, the waste requires to undergo an action of pre-treatment prior to being discarded in the landfills. In waste management, a concept of 3R is used to treat the waste before disposing it off in the landfills. The standard of waste management began from the reduction of waste, reuse, and recycling of waste and ultimately throws away in the landfills. At the end, the cycle of construction waste management will wind up at landfill. Consequently, it is crucial to viably use the assets of construction to lessen the waste generation. Franchetti & Apul (2012) explained that the on-site strategy of recycling aims to isolate the construction waste and after isolation it is utilized in form of raw material in other different processes of construction. At the same time, the off-site strategy of recycling aims to separate the construction waste and then ship it to the other companies with the goal that this waste can be utilized as the raw material. It is important for a recycling program to have government participation in order to make it successful in construction industry. Through recycling not only the negative effect on environment will be reduce yet it also guarantees the future availability of the raw material.
The key participants in the construction sector in emerging nations such as China, Malaysia, India, and Pakistan favor the “take–make–consume–dispose of” model (Ahn et al., 2013). Assets were seen sufficient and readily available under this notion, and disposing of used items was deemed a far more cost-effective choice than reuse or waste management (Chen et al., 2016; Liu et al., 2020). In Pakistan, there is also a general lack of understanding and acceptability of waste management. This circumstance necessitates the immediate implementation of sustainable and friendly environmental practices EPs, as well as measures that aid in mitigating the harmful impact of construction projects on the environment (Liu et al., 2020). Researchers and practitioners are always advocating for the deployment of effective EPs, with increased pressure from consumers and the acting government to reduce the negative consequences of construction operations (Ullah et al., 2017). Lack of research on EPs' implementation in projects, increased demand from governments and stakeholders, and increased expenses all contribute to operational management conflicts (Shi et al., 2013).
The construction industry has always been criticized of contributing to environmental pollution (Allen and Iano, n.d.; Anderson et al., 2015; Du et al., n.d.). This criticism is supported by the fact that the construction sector consumed a significant amount of its gross domestic product and ranked first among other sectors in terms of identifying sources of carbon emissions in the environment. Pakistan has taken attempts to safeguard the environment by including environmental impact assessment (EIA) into project design and on September 3, 1997, it approved its first law, “The Pakistan Environment Protection Act 1997.” “An Act to provide for the preservation, conservation, rehabilitation, and enhancement of the environment, the prevention and control of pollution, and the promotion of sustainable development,” according to the act's context. In Pakistan and other nations, EIA has been declared a legal obligation for all types of project development and execution (Nadeem and Fischer, 2011). EIA serves as a foundation for evaluating environmental actions (EPs). The Pakistan Environment Protection Agency (Pak-EPA) originally proposed the developed form before enacting legislative laws and instructions in this regard. EIA is now being carried out in Pakistan to examine EPs in all development and construction activities (Nadeem and Fischer, 2011). The Ministry of Environment in Pakistan published a policy on 2005 named as national environment policy act. The view of this act was to form incorporated environment management policy for Pakistan within the structure of the sections of NEPA i.e. waste and water management, air quality, bio-diversity. This act enfolds the management regarding pollutants, reconciliation of the way toward improving and ensuring environment along the private or public areas, and the making of a “Public Environment Policy Implementation Committee” for the execution and observing procedures for the affirmed environmental strategy.
Lately, the construction industry has shown realization towards not only the requirement to become environmentally accountable but also regarding the advantages of sustainable construction. There is a campaign going on to foster costing and life cycle evaluation. Likewise, there is a way to evaluate the environmental cost of construction to disguise the externalities of activities related to the construction. Numerous nations have started working on the projects that foster proficiency in construction with regard to utilization of workers, equipment, and materials. There is a developing promotion for the buying and utilization of recycled materials and products used in constructions. A lot of effort is required to develop procedures that emphasize on the waste prevention, decrease, reuse and recycling on construction site. Moreover, governments have progressively presented regulations and motivating force instruments which make it difficult to continue the practices intended to reduce. Of specific significance is the documentation of good strategies that show the financial benefit of elective waste administration choices for construction areas.
5 Limitation of the study
The present study adopted survey method which has always its limitations. The questionnaire’s survey is always subject to participants’ understanding with the question statements, language, concept and language, as well as understanding with the subject, and respondents’ attention while answering the survey. Although, the questionnaire was pilot tested by the experts and it was tried to reduce the bias in answering the questions. Thus, it is noted as one of the limitations of the study that can effect on the outcomes of the findings. The other limitation may include the selection of the latent factors for measuring the factors that contribute in construction waste minimization and maximization. Although, a thoroughly review of the literature was conducted in order to identify these factors, as well as experts opinion was also sought on these factors. But since this is a quantitative study therefore, there is always chance that this study might have overlooked the other factors that are more important in the context of the present study. Therefore, we suggest a qualitative research study for in-depth understanding and identifying the factors important to construction waste minimization and maximization.
6 Conclusion
The results of the study concluded that critical management practices such as contract management, materials logistics management, materials reuse, waste segregation, and onsite practices are strongly correlated with each other and are contributing factors in the minimizing the waste in the construction sites. It also concluded that the poor handling of factors in critical management practices such as design, storage, worker/equipment, onsite material management, materials handling and transportation result in construction waste maximization. The study recommends that materials used in construction that produces waste can be reduced through proper management. It is extremely important for constructors to must recognize the accurate amount of raw material that is require for project completion, and also must conduct the proper estimation of waste that certain amount of material can produce. Therefore, by closely foreseeing the amount of waste that material can produce, the onsite management can make positive efforts in reducing the amount of waste. This reduction in waste can also be valuable for reducing the negative impact of project activities on environment and human well-being. Therefore, it is imperative for the contractors that they must start to plan regarding the waste and employ effective material logistics management, recycling and reusing strategy.
Furthermore, the inappropriate materials logistics management which includes factors such as poor transportation, insufficient instrument about material handling, inappropriate storage leading damages or deterioration and inadequate stacking and insufficient storage. Therefore, an appropriate strategy for materials logistics management should be prepared for transportation and storing the material because the material of construction industry is often exposed to weather threat. Thus, an appropriate management of materials logistics and storage could reduce the waste because all materials at one place could be managed effectively. In addition, the onsite management practices that can avoid the waste due to poor workmanship, shortage of workers at site, lack productivity/worker exhausted due to too much overtime and lack of on-site material control. These factors relate to ineffective operations and inefficiency within the work (Fisher and Marshall, 2009). Therefore, it is imperative for the contractors that workers should not be asked for extra work and overtime since this becomes a source of exhaustion and demotivates them to work effectively and efficiently. Meanwhile, this could also reduce turnover and effectiveness and efficiency at work that may also contribute waste reduction. The study is significant and carries important practical implications in terms of presenting the models on factors contributing to construction waste minimization and maximization. The identification of these factors (contract, materials logistics, materials reuse, and waste segregation) was critical for construction waste management that helps in minimizing the construction waste. On other hand, the identifications of factors (design, storage, worker/equipment, onsite material management, material handling & transportation) contributing in the construction waste maximization will also help the project managers, field engineers, consultants, civil engineers in reducing the construction waste.
Acknowledgements
The Study is supported by the Center of Balance Architecture, Zhejiang University
Declaration of Competing Interest
The authors declare that they have no known competing financial interests or personal relationships that could have appeared to influence the work reported in this paper.
References
- Drivers and barriers of sustainable design and construction: The perception of green building experience. Int. J. Sustain. Build. Technol. Urban Dev.. 2013;4:35-45.
- [CrossRef] [Google Scholar]
- Material Waste in the UAE Construction Industry: Main Causes and Minimization Practices. Archit. Eng. Des. Manag.. 2011;7:221-235.
- [CrossRef] [Google Scholar]
- Application of Artifical Intelligence in Construction Waste Management. Proc. 2019 8th Int. Conf. Ind. Technol. Manag. ICITM. 2019;2019:50-55.
- [CrossRef] [Google Scholar]
- Allen, E., Iano, J., n.d. Edward Allen and Joseph Iano.
- A study on the attitudes and behavioural influence of construction waste management in occupied Palestinian territory. Waste Manag. Res.. 2012;30:122-136.
- [CrossRef] [Google Scholar]
- Energy analysis of the built environment—A review and outlook. Renew. Sustain. Energy Rev.. 2015;44:149-158.
- [CrossRef] [Google Scholar]
- A multi-group analysis of the effects of individual differences in mindfulness on nomophobia. Inf. Dev.. 2019;35:333-341.
- [CrossRef] [Google Scholar]
- Quantitative improvement in workplace performance through biophilic design: A pilot experiment case study. Energy Build.. 2018;177:316-328.
- [CrossRef] [Google Scholar]
- A benefit-cost analysis on the economic feasibility of construction waste minimisation: The case of Malaysia. Resour. Conserv. Recycl.. 2006;48(1):86-98.
- [Google Scholar]
- Study of the Causes and Magnitude of Wastage of Materials on Construction Sites in Jordan. J. Constr. Eng.. 2014;2014:1-6.
- [CrossRef] [Google Scholar]
- Current state and barriers to the circular economy in the building sector: Towards a mitigation framework. J. Clean. Prod.. 2020;276:123250
- [CrossRef] [Google Scholar]
- Bossink, B. a. G., Brouwers, H.J.H., 1996. Wate Quantification and Source Evaluation.pdf. J. Constr. Eng. Manag.
- An application of bar-code system for reducing construction wastes. Autom. Constr.. 2002;11:521-533.
- [CrossRef] [Google Scholar]
- Understanding the relationships between environmental management practices and financial performances of multinational construction firms. J. Clean. Prod.. 2016;139:750-760.
- [CrossRef] [Google Scholar]
- Open-ended course evaluations: A response rate problem? J. Eur. Ind. Train.. 2007;31:402-412.
- [CrossRef] [Google Scholar]
- de Magalhães, R.F., Danilevicz, Â. de M.F., Saurin, T.A., 2017. Reducing construction waste: A study of urban infrastructure projects. Waste Manag. 67, 265–277. https://doi.org/10.1016/j.wasman.2017.05.025.
- Modelling of indoor exposure to nitrogen dioxide in the UK. Atmos. Environ.. 2001;35:269-279.
- [CrossRef] [Google Scholar]
- Dinesh, S., Sethuraman, R., Sivaprakasam, S., 2017. International Journal of Engineering Research and Modern Education The review on lean construction an effective approach in construction industry international Journal of Engineering Research and Modern Education 119–123. https://doi.org/10.5281/zenodo.570523.
- Du, Q., Deng, Y., Zhou, J., Wu, J., Pang, Q., n.d. Spatial spillover effect of carbon emission efficiency in the construction industry of China. https://doi.org/10.1007/s11356-021-15747-9/Published.
- Enshassi, A., 1996. Materials control and waste on building sites: Data in the study was obtained from 86 housing projects on several locations in the Gaza Strip. Build. Res. Inf. 24, 31–34. https://doi.org/10.1080/09613219608727495.
- Formoso, C.T., 1999. Method for waste control in the building industryl. 7th Annu. Conf. Int. Gr. Lean Constr.
- 4D-BIM to enhance construction waste reuse and recycle planning: Case studies on concrete and drywall waste streams. Waste Manag.. 2020;116:79-90.
- [CrossRef] [Google Scholar]
- Perception on benefits of construction waste management in the Singapore construction industry. Eng. Constr. Archit. Manag.. 2011;18:394-406.
- [CrossRef] [Google Scholar]
- A mini review on generation, handling, and initiatives to tackle construction and demolition waste in India. Environ. Technol. Innov.. 2021;22:101490
- [CrossRef] [Google Scholar]
- Professionals’ views of material wastage on construction sites and cost overruns. Organ. Technol. Manag. Constr. An Int. J.. 2013;5:747-757.
- [CrossRef] [Google Scholar]
- Performance of EIA authority and effectiveness of EIA system in Pakistan. Environ. Impact Assess. Rev.. 2020;81:106357
- [CrossRef] [Google Scholar]
- Development of waste occurrence level indicator in Vietnam construction industry. Eng. Constr. Archit. Manag.. 2015;22:715-731.
- [CrossRef] [Google Scholar]
- Kolaventi, S.S., Tezeswi, T.P., Kumar, M.V.N.S., 2018. A Modeling Approach to Construction Waste Management 11–20. https://doi.org/10.1061/9780784482032.002.
- Attitudes and perceptions of construction workforce on construction waste in Sri Lanka. Manag. Environ. Qual. An Int. J.. 2006;17:57-72.
- [CrossRef] [Google Scholar]
- Composition and characteristics of construction waste generated by residential housing project. Int. J. Environ. Res.. 2008;2:261-268.
- [Google Scholar]
- A BIM-aided construction waste minimisation framework. Autom. Constr.. 2015;59:1-23.
- [Google Scholar]
- System dynamic analysis of construction waste recycling industry chain in China. Environ Sci Pollut Res. 2020;27(30):37260-37277.
- [Google Scholar]
- An evaluation framework for effective public participation in EIA in Pakistan. Environ. Impact Assess. Rev.. 2011;31:36-47.
- [CrossRef] [Google Scholar]
- Factors Contributing to Physical and Non-Physical Waste Generation in Construction Industry. Int. J. Adv. Appl. Sci.. 2012;1
- [Google Scholar]
- An innovative framework for risk management in construction projects in developing countries: Evidence from Pakistan. Risks. 2019;7(1):24.
- [Google Scholar]
- On-site sorting of construction and demolition waste in Hong Kong. Resour. Conserv. Recycl.. 2001;32:157-172.
- [CrossRef] [Google Scholar]
- Dry and Wet Waste Segregation and Management System. Eur. J. Eng. Technol. Res.. 2021;6:129-133.
- [Google Scholar]
- Identifying the critical factors for green construction - An empirical study in China. Habitat Int.. 2013;40:1-8.
- [CrossRef] [Google Scholar]
- Construction waste audit in the framework of sustainable waste management in construction projects—case study. Buildings. 2021;11:1-16.
- [CrossRef] [Google Scholar]
- Influence of Six Sigma on project success in construction industry of Pakistan. TQM J.. 2017;29:276-309.
- [CrossRef] [Google Scholar]
- Construction and Demolition Waste Recycling Plants Revisited: Management Issues. Procedia Eng.. 2017;172:1190-1197.
- [CrossRef] [Google Scholar]
- Considering life-cycle environmental impacts and society’s willingness for optimizing construction and demolition waste management fee: An empirical study of China. J. Clean. Prod.. 2019;206:1004-1014.
- [CrossRef] [Google Scholar]
- WRAP, 2007. “Achieving good practice waste minimisation and management: guidance for construction clients, design teams and contractors.”.
- Determinants and outcomes of environmental practices in Malaysian construction projects. J. Clean. Prod.. 2017;156:345-354.
- [CrossRef] [Google Scholar]
- Characterizing the generation and flows of construction and demolition waste in China. Constr. Build. Mater.. 2017;136:405-413.
- [Google Scholar]
- Effectiveness of bagasse ash for performance improvement of asphalt concrete pavements. SN Appl. Sci.. 2021;3:1-11.
- [Google Scholar]
- A Comprehensive Review of Incorporating Steel Fibers of Waste Tires in Cement Composites and Its Applications. Materials (Basel).. 2022;15:7420.
- [Google Scholar]


