

Translate this page into:
Exploring genetic diversity of yellow-berried night shade (Solanum virginianum L.) using genetic divergence and molecular markers
⁎Corresponding authors. ktstncdheebi15@gmail.com (Dheebisha Chandhirasekaran), rajasekargood@gmail.com (Aruliah Rajasekar)
-
Received: ,
Accepted: ,
This article was originally published by Elsevier and was migrated to Scientific Scholar after the change of Publisher.
Peer review under responsibility of King Saud University
Abstract
Abstract
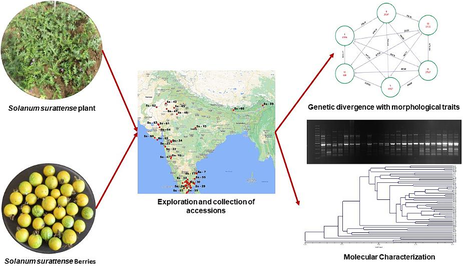
The rationale of this research was to explore the genetic divergence of 54 kantakari accessions (Solanum virginianum L. syn. S. surattense Burm. f.), to identify their significant traits, and unravel their genetic variations. Kantakari is a widely used medicinal plant in traditional medicine worldwide and is also known for its allopathic properties. The morphological descriptors and molecular markers (Random Amplified Polymorphic DNA) used to characterize these samples revealed significant within-accession heterogeneity, indicating the possibility of future selection. Twenty-three morphological and biochemical features were examined to assess taxonomic traits. Accessions were classified into six clusters based on Mahalanobis D2 statistics of 23 quantitative traits. Clusters V and VI had the largest intercluster distance (1183.81), whereas Cluster IV had the largest intracluster distance (D2 = 275.67) (Cluster V and VI). Random Amplified Polymorphic DNA marker amplification using 10 polymorphic primers revealed 79 alleles with an overall mean of 7.90 alleles per marker, with Polymorphism Information Content values varying from 0.11 to 0.37 (Mean = 0.30). Cluster assessment produced three distinct groups. In conclusion, the investigation underscores that substantial diversity was observed among the surveyed kantakari accessions. Using molecular markers in tandem with morphological characterization, presents a robust approach for elucidating the intricacies of species-specific genetic variation with greater accuracy and depth.
Keywords
Solanum surattense
Molecular characterization
Genetic diversity
D2 analysis
AMOVA
RAPD primers
Kantakari

1 Introduction
Traditional medicine uses a wide variety of plants for the treatment of common diseases and the promotion of good health. According to the WHO, 80 % of the global population uses ethnomedicine (Sen and Chakraborty, 2017). India has an extensive history of traditional medicine dating back to ancient times, which is still practised today. Bioactive phytochemicals are a major source of novel pharmaceuticals. Globally, there has been a growing recognition of the use of herbal remedies.
Species belonging to the genus Solanum (Solanaceae) are widely used in traditional medicine and are known reservoirs of bioactive compounds, including steroidal saponins (Kunwar et al., 2021). Due to the extensive spectrum of biological activities, including antibacterial, antirheumatic, anticonvulsant, analgesic, antioxidant, and anticancer properties (Kumar et al., 2010), Solanum alkaloids (Solasodine) have long drawn attention in pharmacological and therapeutic investigations. Alkaloids are vital to the pharmaceutical industry as fundamental constituents or precursors for various steroidal medications employed in treating inflammation, menopause, and arteriosclerosis (Jayakumar and Murugan, 2016).
S. virginianum L. is frequently referred to as Indian nightshade in India, kantakari in Sanskrit, or yellow-berried nightshade in English. It is a bright green, spreading perennial plant with a prickly appearance. The younger branches are densely covered in stellate tomentum, with straight, glabrous, shiny yellow prickles often exceeding 1.3 cm in length. The leaves are ovate to elliptic, measuring 5–10 × 2.5–5.7 cm, and feature stellate hairs on both sides, particularly prominent on the underside, although the leaves become non-pubescent on maturation. Petioles vary in length from 1.3 to 2 cm. Flowers have bluish-violet petals with attractive yellow stamens and are born in axillary clusters. The berries of S. virginianum L. measure 1.3–2.0 cm in diameter and are characterized by yellow stripes with green stripes, enclosed within an enlarged calyx. The seeds are approximately 0.25 cm in diameter, smooth (glabrous), sub-reniform in shape, and yellowish-brown in colour. (Nithya et al., 2018; Parmar et al., 2017). This species is diploid, with a base number of x=12. According to Sun et al., (2020), the presence of heterochromatin segments along the chromosome arms helps these plants to tolerate high temperatures. Hence, kantakari are primarily distributed in warm, dry regions, especially in southeastern Asia and tropical Australia. In India, kantakari is commonly found along roadsides and in barren lands, particularly in regions such as Tamil Nadu, Rajasthan, Gujarat, Haryana, Madhya Pradesh, and Uttar Pradesh (Parmar et al., 2010).
Owing to its well-known ethnobotanical properties, kantakari has attracted researchers from all over the world. The fruits of S. virginianum L. are edible, and in Manipur, India, locals use them as traditional medicines to treat various ailments. The unripe, cooked fruits of S. virginianum L. have traditionally been consumed as a vegetable by the Irular tribes residing in the Hasanur Hills of Tamil Nadu. The Kattunaikka, Paniya, and Kurumba tribal people of Kerala’s Wayanad District consume both fruit and seeds, as documented by Revathi and Parimelazhagan (2010) and Narayanan et al. (2011). Within the Ayurvedic system of medicine, kantakari is stated to be pungent, bitter, assimilative, and an alternative astringent. Its fruits, flowers, and stems are bitter and carminative. In accordance with Kumar et al. (2012); Singh and Singh (2010) the root infusion of S. virginianum L. is used as a febrifuge, expectorant, and strong diuretic. In addition, the plant extract is used for conditions such as bronchial asthma, hemorrhoid, tympanitis, dysuria, mis-peristalsis and rejuvenation, as reported by Thippeswamy et al. (2024). Although the entire plant possesses medicinal properties, dried berries are primarily used because of their rich solasodine content. Currently, there are no available cultivars of this plant; therefore, it is predominantly harvested from natural wild populations.
Owing to its pharmaceutical potential, a comprehensive understanding of the molecular diversity of kantakari is imperative for the advancement of novel, high-yielding varieties abundant in solasodine. This understanding is crucial not only for enhancing therapeutic applications and effective conservation efforts. Solasodine is a nitrogen analogue of sapogenins and an aglycone component of glycoalkaloids in most solanaceous plants. Its C27 cholestane structure renders it easier for the break down into 16-dehydropregnenolone, which is a crucial precursor for the synthesis of steroidal drugs like cortisone and progesterone (Pawar et al.,2008). In addition, it has various pharmaceutical effects such as anticancer, diuretic, antifungal, immunomodulatory, antiandrogenic,antipyretic, cardiotonic and CNS (Patel et al., 2013). In order to build linkages within species and to discover more about genetic affinities, it is essential to look into genetic variation (Munda et al., 2021). In addition, genetic heterogeneity research facilitates genotypic comparisons among various geographic regions (Kumaret al., 2013). Because the molecular markers are neutral, economical, highly informative, and free of the growing stage, tissue, or environmental conditions, these offer advantages over phenotypic markers while assessing the plant’s genetic makeup (Kumar et al., 2013, Munda et al., 2021). PCR-based RAPD markers represent a common, cost-effective method for identifying patterns of genetic variation in plants due to their simplicity, minimal DNA requirements, insensitivity to environmental factors, and codominant nature (Yadav et al., 2013). Specifically, RAPD markers offer distinct advantages for investigating previously unstudied species. Not requiring DNA sequence information, RAPDs enable the identification and discrimination of accessions, along with providing a means to assess phenotypic expression and investigate phylogenetic associations in the accessions under study.
2 Materials and methods
2.1 Experimental materials
Explorations were conducted across India to obtain kantakari (Solanum virginianum L.) genetic material. In total, germplasm was collected from 54 sites across six Indian states (Fig. 1). The species identity was verified with the assistance of the Botanical Survey of India, TNAU, Coimbatore. The seeds of the collected species were deposited in the National Bureau of Plant Genetic Resources (NBPGR) Gene bank for obtaining the Indigenous Collection (IC) Number, and the seeds were available in the Ramiah gene bank, TNAU, Coimbatore. Seeds were treated with 500 ppm GA3 for 24h to promote germination as per the trail conducted by Boomiga et al., (2021a). Treated seeds were sown in a seed pan with coir pith and vermicompost (1:1) as the potting medium. To assess and select the most appropriate genotypes, experimental fields were established at the Department of Medicinal and Aromatic Plants, TNAU Botanical Garden, Coimbatore (11°00′50.8″N 76°55′52.7″E, 411 MSL). Ten plants per accession (45-day-old seedlings) were planted in a randomized complete block design (RCBD) having three replications on October 16, 2021. The total experimental area was 0.27 acre containing 11 blocks with 100 m2. Each block consist of 15 ridges of 10 m length with 15 plants planted at the spacing of 60 × 60 cm. The genotypes were cultivated as per the cultural practises proposed and standardized by NMPB (2014).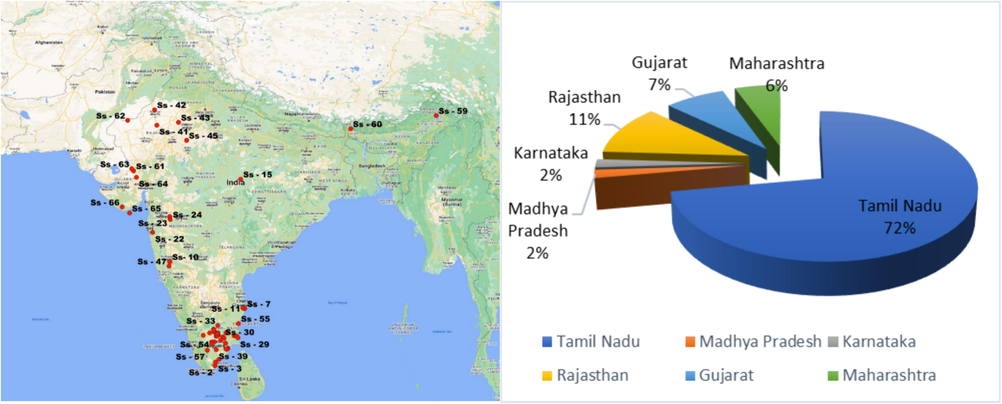
Map showing the locations of the kantakari accessions.
Phenotypic observations were recorded from five randomly selected plants from each accession across all replications based on the National Bureau of Plant Genetic Resources minimal descriptors for Agri-horticultural crops (Part IV) (Singh et al., 2003). Morphological characters: North– South spread of the plant (cm), East– West spread of the plant (cm), number of branches plant−1, diameter of the stem (mm), leaf length and width (cm), length of the petiole (cm), length of the internodes (cm), and number of thorns on the upperand lower surface of leaf were recorded upon completion of the vegetative stage of the plant. Flowering traits: days to first flowering, number of flower clusters plant−1 and days taken for 50 % flowering were observed at the full bloom stage. Yield characteristics: total number of berries plant−1, diameter of a berry (mm), fresh and dry weight of single berry (g/plant), fresh and dry berry yield plant−1 (g) were recorded at fruit maturity. Biochemical analyses were conducted as suggested by Rakesh et al.(2021) to assess the total phenol content (mg GAE/g) by the Folin-Ciocalteu method; total protein content (mg/g) by Lowry’s method, total flavonoid content (mg QE/g) by aluminium trichloride method; and total antioxidant content using DPPH assay (mg ASAE/DW). All these observations were analyzed using Mahalanobis’s (1936) D2 statistics for assessing genetic divergence between the kantakari accessions.
Variations in leaf (upper and lower side), spine, flower, and berry colour were documented using the Royal Horticultural Society (RHS) Color Chart (Fig. 2).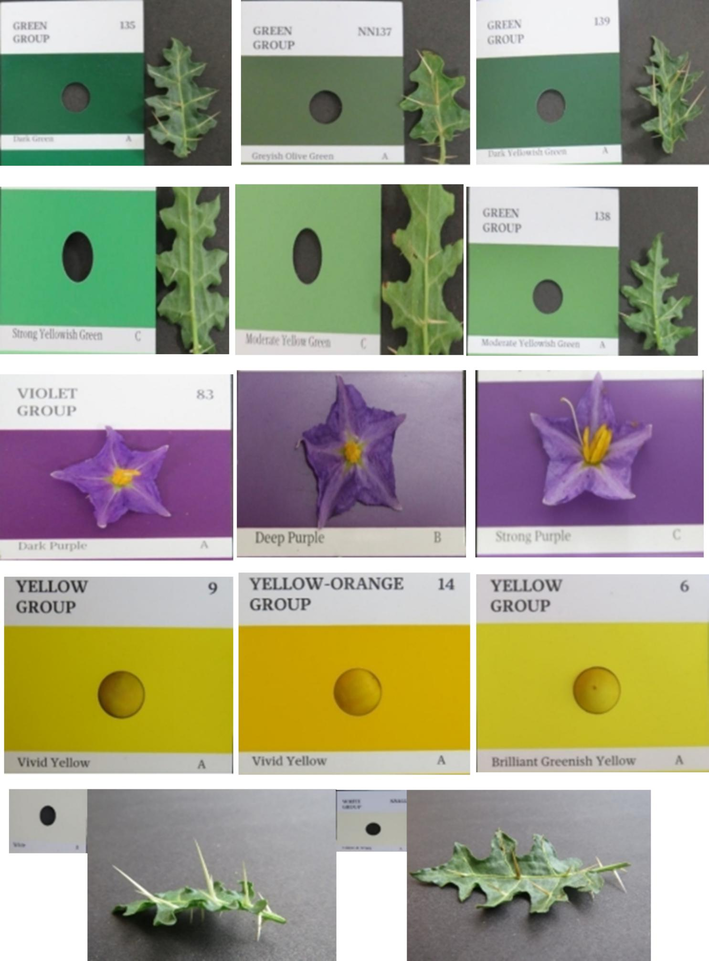
Lane 1: Variation in leaf colour (upper side); Lane 2: Leaf colour (lower side); Lane 3:Flower colour; Lane 4: Dry berry colour; Lane 5: Thorn colour.
2.2 Extraction of genomic DNA
Genomic DNA analysis was performed according to the protocol outlined by Doyle and Doyle (1990). On the day of extraction, fresh young leaves of S. virginianum L. were collected from each accession, washed with tap water, and wiped with 70 % (aq) ethanol. The cleaned leaf blades were then cut into small pieces and macerated in 1000 µL of slightly modified CTAB buffer with 10 µL ofmercaptoethanol. Ground samples were incubated in a water bath at 60 °C for 45 min. Subsequently, 600 µL of a phenol, chloroform, and isoamyl alcohol solution (25:24:1) was added, and the mixture was centrifuged in a refrigerated centrifuge at 12,000 rpm for 10 min. The supernatant was collected, to which 600 µL of chloroform and isoamyl alcohol mixture (24:1) was added and centrifuged again. Because of the high phenol concentration of S. virginianum L. leaves, this procedure was performed twice to remove the phenols. Finally, 50 µL of sodium acetate (7.5 M) was added to enhance nucleic acid precipitation, and an equal amount of frigid isopropanol was added. The samples were kept overnight at 4⁰C. The DNA pellets precipitated were subsequently rinsed with 70 % ethanol on the following day after the samples had been centrifuged at 10,000 rpm for 8 min. The pellets were dried until the alcohol Odor disappeared. The pellets were then reconstituted in TE buffer and kept at −20 ⁰C for storage. A nanodrop spectrophotometer (JenwayTM Genova) was used to evaluate the quantity and purity of DNA samples at 260 and 280 nm. Using 0.8 % (w/v) agarose gel electrophoresis and 6 X DNA loading dye (Thermo Fisher Sci, Cat. No. R06111), the DNA was examined for quality.
2.3 RAPD amplification
Ten decamer oligonucleotides derived from Operon series (OP) RAPD primers (Eurofins Advinus Agrosciences Services Pvt. Ltd., Bengaluru) (Table 1) were used to evaluate genetic polymorphisms in S. virginianum L. Amplification was performed in a 10 µL reaction volume, with 2 µL of 100 ng DNA, 2 µL of primer and 6 µL of 2X mastermix (smartPRIME). In a Proflex Thermal Cycler, PCR reactions were performed with an initial denaturation at 94 °C for 5 min, 45 cycles at 94 °C for 1 min, 37 °C for 1 min, and 72 °C for 1 min, and a final extension at 72 °C for 5 min. The amplified products were separated using a 1.5 % agarose gel in 0.5X TBE buffer and then electrophoresed at 90 V for 3h. The Gel Documentation System was used to visualize the results using EtBr staining. Using GeneDirex Cat. No. DM0150 as a molecular standard, the 1-kb marker RTU was used to quantifythe amplified product size.
Primers
Sequence 5′→3′
Molecular Weight (bp)
Annealing Temperature (°C)
OPA-02
TGCCGAGCTG
200–2500
47
OPA-20
GTTGCGATCC
400–2500
44
OPD 02
GGACCCAACC
300–2000
46
OPS-20
TCTGGACGGA
400–1000
46
OPT-15
GGATGCCACT
300–3000
44
OPT-18
GATGCCAGAC
300–2000
44
OPT 20
GACCAATGCC
400–2000
44
OPT 17
CCAACGTCGT
200–2500
44
OPP 09
GTGGTCCGCA
300–2500
45
OPR 02
CACAGCTGCC
200–2000
40
After gel electrophoresis, the amplified fragments were scored in a binary fashion, and a phylogenetic tree was created using the neighbour joining approach with 100 bootstraps in the DARWIN computer program (Perrier and Jacquemoud-Collet, 2006). The PIC values were calculated using the formula, where, “f” − represents the “ith” allele frequency (Botstein et al. 1980).
The formula for calculating resolving power was also as follows: where, EMR is the multiple of number of polymorphic loci and fraction of polymorphic loci (Milbourne et al. 1997) where, Ib (band informativeness) and 'p' is the number of individuals containing the band (Prevost and Wilkinson, 1999). Using AMOVA, which is a feature of the GenAlEx 6.5 Excel software suite, molecular variation within and across populations was analyzed (Peakall and Smouse, 2012).
3 Results and discussion
3.1 Variation in phenotypic traits
Table 2 represents the assessment of variance results unequivocally demonstrated significant accession-level differences for each of the twenty-four characteristics.
S.No.
Character
Source of Variance
Replication
Accession
Error
Degrees of freedom
2
53
106
1
Plant spread (N-S) (cm)
18.92
906.96**
99.42
2
Plant spread (E-W) (cm)
276.18
589.14**
139.94
3
Number of branches
0.50*
2.14**
0.18
4
Number of flower clusters per plant
7.14*
37.04**
1.10
5
Days to the first flowering
7.79
218.29**
10.72
6
Days to 50 % flowering
2.34
216.61**
3.08
7
Leaf length (cm)
1.71*
8.80**
0.49
8
Leaf width (cm)
0.84
8.56**
0.51
9
Stem diameter (mm)
1.13
5.34**
0.49
10
Petiole length (cm)
0.19
5.17**
0.29
11
Total no. of thorns on the upper leaf surface
0.20
3.92**
0.79
12
Internode length (cm)
6.47
396.99**
138.82
13
Total no. of thorns on the lower leaf surface
0.71
4.41**
0.37
14
Number of berries
1.36
2271.25**
35.35
15
Berry diameter (mm)
0.17
8.07**
0.57
16
Fresh single berry weight (g)
0.004
0.97**
0.01
17
Fresh berry yield per plant (g)
2864.94*
15433.38**
1113.82
18
Dry single berry weight (g)
0.02*
0.03**
0.01
19
Dry berry yield per plant (g)
6.04*
964.60**
31.97
20
Phenolic content (mg GAE/g)
0.002
8.16**
0.03
21
Protein content (mg/g)
0.03
26.40**
0.13
22
Flavonoid content (mg QE/g)
14.67
2641.67**
12.27
23
Total antioxidant activity (mg ASAE/DW)
3.17
148.55**
8.40
The observation of qualitative traits also revealed variation within the accessions. Three leaf-colour classes were observed: 16 accessions showed dark green and strong yellowish green leaf colour whereas 43 showed dark yellowish green and moderate yellowish green colour and only one accession was categorized in the greyish olive green and moderate yellowish green group (Fig. 2; Lanes 1 and 2). In case of thorn colour, there were two types (Fig. 2; Lane 5). Three groups were observed in flower as well as berry colour (Fig. 2; Lanes 3 and 4).
3.2 Genetic divergence
Genetic diversity is one of the most significant features of plant breeding. Measures of genetic divergence can be used to optimise accession selection for breeding programmes by providing information on both the type and amount of diversity present within plant populations (Smith et al., 2015). The significance of parental accessions selected based on a set of critical qualities may outweigh those selected based on a single characteristic. In order to develop novel variability and suitable recombinants with improved yield and quality, genetically diverse parents must be included. Therefore, multivariate analysis using Mahalanobis D2 statistics has been employed to quantitatively measure phenotypic divergence (Kovacic, 1994). Table 3 revealed that these 54 kantakari accessions clustered into six groups with appreciable diversity. Fresh single berry weight, days to 50 % flowering, berries plant−1, flower clusters plant−1 and dry berry yield plant−1 were the most significant contributors to overall differentiation (Fig. 3).
Cluster
No. of accessions
Name of the accessions
I
16
Ss49, Ss42, Ss45, Ss26, Ss3, Ss25, Ss2, Ss34, Ss17, Ss35, Ss31, Ss62, Ss24, Ss14, Ss63, Ss18
II
17
Ss53, Ss54, Ss55, Ss41, Ss10, Ss6, Ss33, Ss4, Ss7, Ss11, Ss13, Ss36, Ss2, Ss1, Ss19, Ss6, Ss39
III
08
Ss22, Ss27, Ss21, Ss38, Ss58, Ss23, Ss50, Ss9
IV
10
Ss51, Ss56, Ss57, Ss32, Ss64, Ss15, Ss44, Ss48, Ss52, Ss43
V
2
Ss12, Ss65
VI
1
Ss20
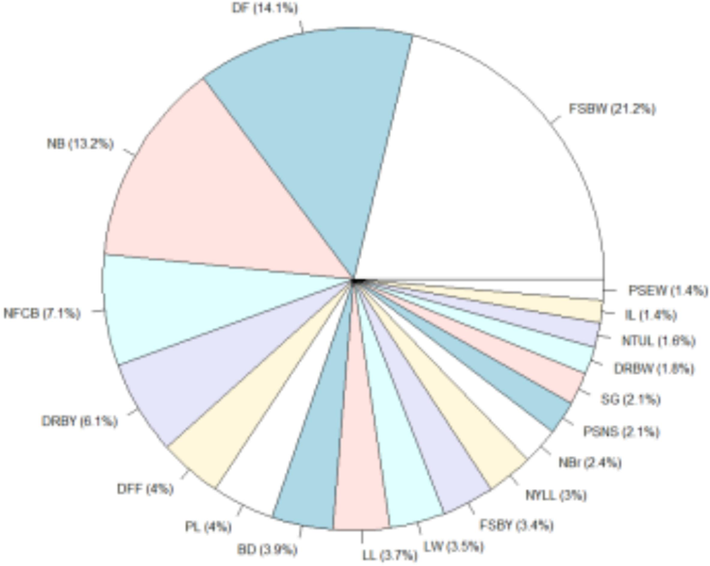
Percent contribution of characters towards genetic divergence in kantakari. * FSBW- Fresh weight of a berry, PSEW −Plant spread (E-W), IL −Internode length, NTUL- Number of thorns on upper leaf surface, DRBW- Dry weight of single berry, SG- Stem girth, PSNS- Plant spread (N-S),NBr- Branches per plant, NYLL- Number of thorns on lower leaf surface, FSBY- Berry yield (fresh), LW- Leaf width, LL- Length of the leaf, BD-Diameter of the berry PL- Petiole length, DFF- First flowering (days),DRBY- Yield of berry (Dry), NFCB- Flower cluster per branch, NB- number of berries and DF- days to 50 % flowering.
The inter-cluster values of D2 analysis ranged from 1183.81 (between Cluster-V and VI) down to 674.46 (between Cluster-III and IV) whereas, the highest intra- cluster distance was observed in Cluster-IV (D2= 275.67) with nine accessions (Table 4). Considering that the greatest phenotypic distance between clusters VI and V, the accessions selected from these clusters for hybridization should yield broad variation in segregating generations, perhaps including transgressive segregates. Similarly, Boomiga et al. (2021b) classified Solanum surattense accessions into six groups based on quantitative traits. These findings are consistent with studies on other Solanaceous crops, including tomato (Meena and Bahadur, 2015), eggplant (Begum et al., 2013), and chili (Rahevar et al., 2021). Bold values on the diagonals indicate the intra-cluster distance.
Cluster I
Cluster II
Cluster III
Cluster IV
Cluster V
Cluster VI
Cluster I
139.96
338.29
225.51
438.70
647.57
335.17
Cluster II
252.07
394.79
484.85
361.14
638.26
Cluster III
237.52
674.46
783.72
417.50
Cluster IV
275.67
590.80
683.64
Cluster V
135.27
1183.81
Cluster VI
0.00
3.3 Quantitative trait cluster mean performance
In represent to Table 5 plant spread (N-S) showed the widest plants in cluster II (mean = 106.10 cm) whereas cluster VI (at 105.86 cm) recorded the widest plants for plant spread (E-W). In addition, cluster VI produced the most branches per plant (6.14). The highest number of flower clusters per branch was observed in clusters I and VI (15.20). The fewest thorns on the upper and lower sides of the leaf were also noted in cluster VI (11.90 and 12.20 respectively). Cluster II recorded the highest mean number of berries (85.52). The yield attributes: fresh (3.26 g) and dry (0.75 g) single berry weight, and fresh (238.09 g) and dry (74.07 g) berry yield per plant was highest in cluster V. Hence, the selection of parental lines for hybridization from diverse clusters results in greater variability. Dutta et al. (2009) have similarly observed similar findings in aubergine. Hybrids with desired segregants could potentially result from accessions originating from the most divergent clusters. These results are in line with the kantakari divergence studies of Boomiga et al. (2021) and research demonstrated substantial variation in the yield of dried berries/plant among the 34 traits analyzed. and that 49 accessions could be grouped into six groups using cluster analysis.
Characters
I
II
III
IV
V
VI
Plant spread (N-S) (cm)
102.18
106.10
95.46
97.41
96.18
103.47
Plant spread (E-W) (cm)
101.75
98.58
91.12
97.63
87.75
105.86
Branches/ plant
5.41
5.27
5.21
6.00
5.54
6.14
Flower clusters/plant
15.20
15.06
13.73
14.90
14.82
15.20
Length of the leaf (cm)
8.35
9.76
9.03
9.84
8.71
8.59
Leaf width (cm)
6.44
6.99
7.88
6.46
5.71
4.51
Diameter of the stem (mm)
7.90
8.97
8.51
7.89
8.93
8.22
Leaf Petiole length (cm)
4.27
5.45
4.75
5.31
4.99
3.44
Internodal distance (cm)
7.97
8.58
7.47
8.14
6.62
8.15
Number of thorns on upper leaf surface
13.01
13.10
13.18
12.59
12.74
11.90
Number of thorns on lower side of the leaf
13.52
12.85
13.37
12.81
12.35
12.20
Days to first flowering
39.09
37.92
40.42
43.93
28.78
34.67
Days to 50 % flowering
52.94
55.28
52.38
56.79
47.57
45.67
Number of berries
66.75
85.52
62.52
61.98
78.91
83.46
Berry diameter (mm)
16.59
16.55
16.53
16.83
16.57
16.00
Fresh single berry weight (g)
2.49
2.42
2.47
2.72
3.26
1.73
Fresh berry yield (g/plant)
168.75
193.18
144.71
167.86
238.09
133.78
Dry single berry weight (g)
0.63
0.61
0.61
0.69
0.75
0.62
Dry berry yield (g/plant)
53.10
60.59
47.18
51.66
74.07
43.56
Total phenol content (mg GAE/g)
6.68
6.64
7.50
7.72
10.09
7.96
Total flavonoid content (mg QE/g)
127.57
127.16
123.24
140.67
210.37
148.89
Total protein content (mg/g)
12.76
12.72
12.32
14.07
21.04
14.89
Total antioxidant activity (mg ASAE/DW)
133.16
130.38
132.32
125.57
143.76
129.50
3.4 AMOVA
Data from Table 6, revealed that just 3 % of variation was identified among populations, whereas 97 % of the total geneticdifference was found within populations. This significant level of within-population variation may be indicative of elevated gene flow or the presence of allelic variation that was not resolved in the observed banding patterns. High levels of within-population variation allow populations to better adapt to changing environments (Danusevičius et al., 2024). Future studies should investigate these RAPD banding patterns to determine whether single bands are truly mono-allelic, and, if so, whether those alleles are identical by descent. The findings of this study echo earlier research conducted by Akaffou et al. (2020), wherein molecular variance analysis revealed 14 % of molecular variance among groups, with the remaining 86 % attributed to within-group diversity in brinjal. Additionally, Shimira et al. (2021) reported that within-population variation in scarlet eggplant accounted for 81 %, while among-population variation constituted 19 %. In the case of potato, analysis of molecular variance demonstrated 3 % variation among locations, with 97 % stemming from diversity within locations, and further among the elevations, 2 % variability coupled with 98 % attributable to diversity within elevation (Anoumaa et al., 2017).
Source
df
SS
Variance component
Variation (in per cent)
Among Pops
1
12.218
0.310
3 %
Within Pops
52
463.542
8.914
97 %
Total
53
475.759
9.224
3.5 Molecular characterization by RAPD primers
Ten RAPD primers (Table 7), producing repeatable, polymorphic banding patterns (Fig. 4), were used to characterize the 54 kantakari accessions. Out of total 106 scorable bands, 79 were polymorphic, average of 7.9 polymorphic bands per primer. Among the ten primers, six showed polymorphism levels above 80 %, whereas primers OPP 09 and OPR 02 were fully polymorphic. The marker index was determined for all markers, as it quantifies their discriminatory strength. A marker index value of 2.46 was determined for this set of RAPD primers, a value resulting from a higher multiplex ratio component (7.49), results consistent with those of previous authors (Ansari and Singh, 2013; Tiwari et al., 2009; Verma et al., 2012,).(See Fig. 5). *NB- Number of bands, NPB – Number of polymorphic bands, PP- Percentage of polymorphism, PIC- Polymorphism Information Content, MI- Marker Index, Rp- Resolving power.
Primers
NB
NPB
PP
PIC
MI
RP
OPA-02
9
5
55.5
0.28
2.15
4.57
OPA-20
8
3
37.5
0.22
2.30
3.81
OPD 02
11
9
81.8
0.34
2.55
4.81
OPS-20
8
2
25.0
0.11
2.03
3.56
OPT-15
10
4
40.0
0.32
2.51
4.39
OPT-18
11
9
81.8
0.33
2.40
4.52
OPT 20
11
10
91.0
0.36
2.42
4.67
OPT 17
13
12
92.3
0.35
2.96
7.74
OPP 09
11
11
100
0.33
2.55
5.33
OPR 02
14
14
100
0.37
2.73
4.22
Mean
10.6
7.9
70.46
0.30
2.46
4.76
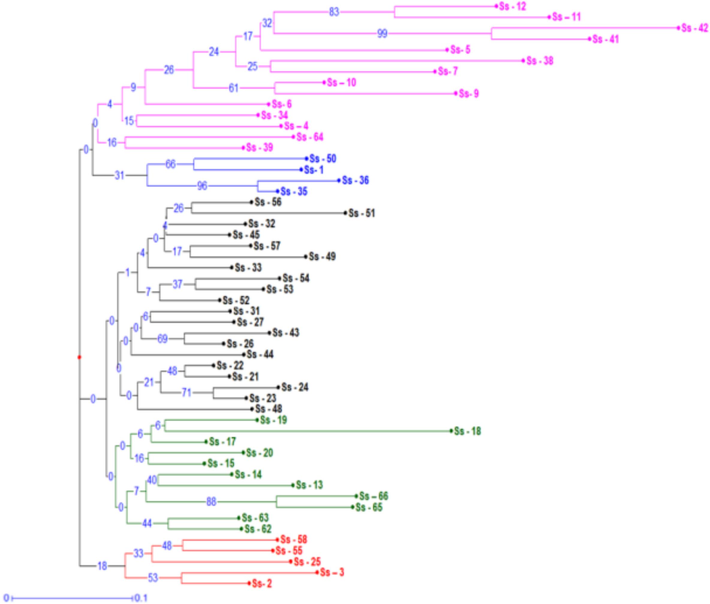
Dendrogram using neighbour-joining method, utilizing kantakari populations screened with RAPD markers. (The number following accession names denote individual genotypes with boot-trap values, expressed as a percentage of 100 replicates, indicated at the nodes.).
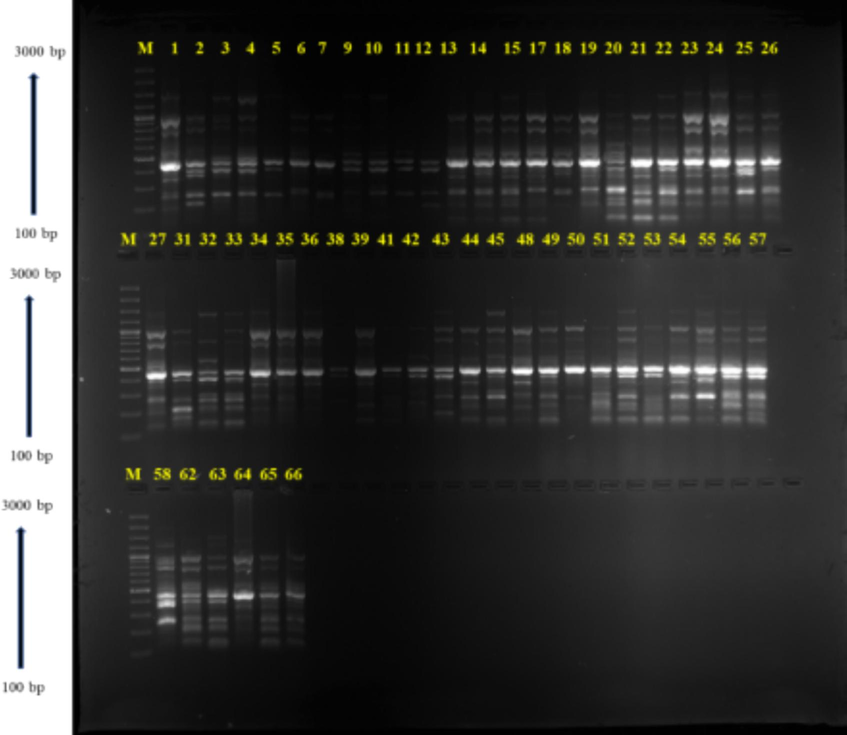
Gel image of OPT −17 RAPD primer showing amplified bands of 54 kantakari accessions.
PIC of a primer is a crucial component that shows how well it can distinguish between different species. An average PIC of 0.30 was observed for the ten RAPD primers, whereas the highest PIC was observed for primer OPR 02 (0.37) (Table 6). In addition, the resolving power of each marker was assessed, indicating the primer's ability to effectively differentiate between genotypes or individuals. Across the primers, the mean resolving power was 4.76 with the highest value (7.74) detected for primer OPT 17. A neighbour-joining algorithm was used to generate a cluster analysis for the RAPD markers (Fig. 4). Larger differences in bootstrap values, greater divergence in genotypes and greater stability within clusters. The tree produced three major groupings (but with very low bootstrap values 18 accessions form Cluster I with two sub-clusters (shown in pink and blue); 31 accessions form Cluster II also with two sub-clusters (in black and green), and 5 accessions form Cluster III (in red). In an earlier study involving 24 accessions of S. surattense from Yadav et al. (2013), accessions were divided into 4 groups using UPGMA dendrogram with a 40 % resemblance for RAPD and ISSR markers. In this study, it is noteworthy that the dendrogram did not unveil a discernible pattern of geographic grouping. Similar agro-climatic conditions and widespread gene flow may be the cause of these associations between accessions from various locales (Saengprajak and Saensouk, 2012). Parallel research outcomes were documented by prior investigations conducted by Mastan et al. (2012) for Jatropa and Sarwat et al. (2011) for Terminalia. Semagn (2002) explained that the low relationship between molecular markers and phenotypical traits is indeed relevant to our study. Molecular markers, such as RAPD, encompass a broader portion of the genome, spanning both coding and non-coding regions, unlike morphology. Furthermore, molecular markers are not subject to artificial selection as morphology is. Consequently, phenotypic and molecular data approaches might not always be tightly linked. Enhanced association between them might be achieved with the inclusion of additional morphological markers in the analysis or by utilizing a wider array of RAPD primer combinations.
4 Conclusions
This is the first report of an evaluation of the genetic and phenotypic diversity of kantakari populations gathered from diverse regions of India. Investigating diversity and group accessions may be done using any of the examined approaches; yet, no two approaches may be used in the same way. The selection of a genetic diversity estimation method will largely depend on the resources available to the researcher and how these integrate with the breeding strategy. Thus, it is impossible to reliably distinguish between closely related genotypes and analyse the genetic similarities between them using phenotypic evaluations. Among the 54 assessed accessions, Ss-13, Ss-14, Ss-34, and Ss-66 exhibited superior performance concerning yield and associated traits, while Ss-44 displayed a reduced number of thorns. These accessions could be recommended for commercial cultivation of kantakari. Additionally, Ss-48 demonstrated elevated solasodine content, and its methanolic extract showed potential antibacterial properties.
It is crucial to implement proactive conservation and breeding strategies for the economic cultivation of kantakari. Exploring genetic diversity of Solanum virginianum through molecular work will provide a strong foundation in developing new varieties with superior yield and quality traits useful for various phytomedicine industries. To prevent genetic diversity loss and for further crop development work, it is imperative to cultivate and preserve high-solasodine lines and other genetically diverse accessions for future exploitation.
CRediT authorship contribution statement
Dheebisha Chandhirasekaran: Writing – review & editing, Writing – original draft. Sandeep Gunalan: Methodology, Conceptualization. Suresh Jesuraj: Visualization, Validation. Arumugam Thangaiah: Validation, Formal analysis. Manikanda Boopathi Narayanan: Methodology, Formal analysis. Nalina Lakshmanan: Methodology, Formal analysis. Mohamad S. AlSalhi: Validation, Funding acquisition. Sandhanasamy Devanesan: Validation, Formal analysis. Aruliah Rajasekar: Supervision.
Acknowledgements
The authors express their sincere appreciation to the Researchers Supporting Project Number (RSP2024R398) King Saud University, Riyadh, Saudi Arabia. We the authors, Acknowledge the Department of Medicinal and Aromatic Crops; Centre for Plant Molecular Biology and Biotechnology, Tamil Nadu Agricultural University, Coimbatore for providing financial support and research facilities.
Funding
The authors express their sincere appreciation to the Researchers Supporting Project Number (RSP2024R398) King Saud University, Riyadh, Saudi Arabia. This research was funded by the National Medicinal Plants Board, Ministry of AYUSH, Government of India under the Project No. R&D/GUJ-03/2017-18 “Breeding Medicinal Plants for Improved Yield and Quality”.
Ethical approval
No falsification, deformation, or modification of data was used in the presentation of the results, and the article was not submitted anywhere else. There is no risk to national security or public health from research.
Declaration of competing interest
The authors declare that they have no known competing financial interests or personal relationships that could have appeared to influence the work reported in this paper.
References
- Genetic diversity of exotic and local eggplants (Solanum spp.) cultivated in Côte d'Ivoire based on ISSR markers. Biodiversitas. 2020;21:3650-3657.
- [CrossRef] [Google Scholar]
- Genetic diversity and core collection for potato (Solanum tuberosum L.) cultivars from Cameroon as revealed by SSR markers. Am. J. Potato Res.. 2017;94:449-463.
- [CrossRef] [Google Scholar]
- Molecular diversity of brinjal (Solanum melongena L.) genotypes revealed by RAPD marker. J. Res. (BAU). 2013;25:41-48.
- [Google Scholar]
- Morphological diversity of eggplant (Solanum melongena) in Bangladesh. Emir. J. Food Agric.. 2013;25:45-51.
- [CrossRef] [Google Scholar]
- Effect of different seed treatments on germination and seedling growth of Solanum surattense. Med. Plants-Int. J. Phytomed. Related Industries. 2021;13(4):596-600.
- [Google Scholar]
- Genetic diversity analysis in Solanuumsurattense–An endangered medicinal plant. Electron. J. Plant Breed.. 2021;12(4):275-1280.
- [CrossRef] [Google Scholar]
- Stronger genetic differentiation among within-population genetic groups than among populations in Scots pine provides new insights into within-population genetic structuring. Sci. Rep.. 2024;14(1):2713.
- [Google Scholar]
- Multivariate genetic divergence in brinjal (Solanum melongena L.) J. Crop Weed. 2009;5(1):67-70.
- [Google Scholar]
- Solanum alkaloids and their pharmaceutical roles: A review. J. Anal. Pharm. Res.. 2016;3(6):00075.
- [CrossRef] [Google Scholar]
- Kovacic, Z., 1994. Multivariate analysis. Faculty of Economics. University of Belgrade, Serbian, pp 293.
- Characterization of released and elite genotypes of guar (Cyamopsis tetragonoloba (L.) Taub.) from India proves unrelated to geographical origin. Genet. Resour. Crop Evol.. 2013;60(7):2017-2032.
- [CrossRef] [Google Scholar]
- Wound healing activity of Solanum xanthocarpum Schrad & Wendl. fruits. Indian J. Nat. Prod. Resour.. 2010;1(4):470-475.
- [Google Scholar]
- Kunwar, L., Gautam, S., Dhami, N., Jan, H.A., Turi, M.A., Hussain, W., Abbasi, A.M., Sher, H., Kunwar, R.M., Bussmann, R.W., 2021.Solanum aculeatissimum Jacq. Solanum nigrum L. Solanum surattenseBurm. f. Solanaceae. In Ethnobotany of the Himalayas, 1-26. Springer.DOI: 10.1007/978-3-030-45597-2_230-1.
- Mahalanobis, P.C., 1936. On the generalized distance in statistics. National Institute of Science of India, pp 49–56.
- Breeding potential of indeterminate tomato (Solanum lycopersicum L.) accessions using D2 analysis. SABRAO J. Breed. Genet.. 2015;47:49-59.
- [Google Scholar]
- Comparison of PCR-based marker systems for the analysis of genetic relationships in cultivated potato. Mol. Breed.. 1997;3:127-136.
- [Google Scholar]
- Variability estimation and genetic divergence in Cymbopogon winterianus for development of superior genotype. Agron. J.. 2021;113(2):993-1007.
- [CrossRef] [Google Scholar]
- Wild edible plants used by the Kattunaikka, Paniya and Kuruma tribes of Wayanad District, Kerala. India. J. Med. Plants Res.. 2011;5(15):3520-3529.
- [Google Scholar]
- Antibacterial and free radical scavenging activity of a medicinal plant Solanum xanthocarpum. Int. J. Food Prop.. 2018;21(1):313-327.
- [CrossRef] [Google Scholar]
- NMPB, 2014. Agro-techniques of Selected Medicinal Plants. New Delhi, National Medicinal Plants Board, Department of AYUSH, Ministry of Health and Family Welfare, Government of India, 2014.
- Solanum xanthocarpum (yellow berried night shade): A review. Pharm. Lett.. 2010;2(4):373-383.
- [Google Scholar]
- Anti-psoriatic potential of Solanum xanthocarpum stem in Imiquimod-induced psoriatic mice model. J. Ethnopharmacol.. 2017;198:158-166.
- [CrossRef] [Google Scholar]
- Medicinal significance, pharmacological activities, and analytical aspects of solasodine: A concise report of current scientific literature. J. Acute Dis.. 2013;2(2):92-98.
- [CrossRef] [Google Scholar]
- A simple technique for rapid quantitative determination of solasodine from cultured hairy roots of Solanum surattense. J. Herb. Med.. 2008;2:7-10.
- [Google Scholar]
- GenAlEx 6.5: Genetic analysis in Excel. Population genetic software for teaching and research-an update. Bioinformatics. 2012;28:2537-2539.
- [Google Scholar]
- Perrier, X., Jacquemoud-Collet, J.P., 2006.DARwin software: Dissimilarity analysis and representation for windows. https://darwin.cirad.fr/[accessed 1 March 2013].
- A new system of comparing PCR primers applied to ISSR fingerprinting of potato cultivars. Theor. Appl. Genet.. 1999;98:107-112.
- [Google Scholar]
- Genetic diversity study in chilli (Capsicum annuum L.) using multivariate approaches. Electron J Plant Breed. 2021;12:314-324.
- [Google Scholar]
- Variations in the L-DOPA Content, Phytochemical Constituents and Antioxidant Activity of Different Germlines of Mucuna pruriens (L.) DC. Asian J. Chem.. 2021;33(8):1881-1890.
- [Google Scholar]
- Traditional knowledge on medicinal plants used by the Irula tribe of Hasanur Hills, Erode District, Tamil Nadu, India. Ethnobot. Leaf. 2010;2:4.
- [Google Scholar]
- Genetic diversity and species identification of cultivar species in subtribe Cucumerinae (Cucurbitaceae) using RAPD and SCAR markers. Am. J. Plant Sci.. 2012;3(8):1092-1097.
- [CrossRef] [Google Scholar]
- AFLP and SAMPL markers for characterization of genetic diversity in Terminalia arjuna: A backbone tree of Tasar silk industry. Plant Syst. Evol.. 2011;293(1–4):13-23.
- [CrossRef] [Google Scholar]
- Genetic relationships among ten endod types as revealed by a combination of morphological RAPD and AFLP markers. Hereditas. 2002;137(2):149-156.
- [CrossRef] [Google Scholar]
- Revival, modernization and integration of Indian traditional herbal medicine in clinical practice: Importance, challenges and future. J. Trad. Complement. Med.. 2017;7(2):234-244.
- [CrossRef] [Google Scholar]
- Shimira, F., Boyaci, H.F., Çilesiz, Y., Nadeem, M.A., Baloch, F.S., Taşkin, H., 2021. Exploring the genetic diversity and population structure of scarlet eggplant germplasm from Rwanda through iPBS-retrotransposon markers. Mol. Bio. Rep. 48 (9):6323-6333.https://link.springer.com/article/10.1007/s11033-021-06626-0.
- Singh, B.M., Mahajan, R.K., Srivastava, U., Pareek, S.K., 2003. Minimal descriptors of Agri-Horticultural Crops Part IV: Medicinal and Aromatic Plants. National Bureau of Plant Genetic Resources, Pusa Campus, New Delhi-110012.
- Phytochemistry of Solanum xanthocarpum: an amazing traditional healer. J. Sci. Ind. Res.. 2010;69(10):732-740.
- [Google Scholar]
- Smith, S., Bubeck, D., Nelson, B., Stanek, J., & Gerke, J. (2015). Genetic diversity and modern plant breeding. Genetic diversity and erosion in plants: Indicators and prevention, 55-88.
- Heat stress-induced transposon activation correlates with 3D chromatin organization rearrangement in Arabidopsis. Nat. Commun.. 2020;11(1):1886.
- [Google Scholar]
- Thippeswamy, M. G., Kubera, S. C., Achur, R., Ravikumar, H., Siddaraju, T. R., & Shivaiah, N. Transcriptome Analysis Identifies Genes Involved in Vitamin B Biosynthesis in Solanum virginianum Whole Fruit. In Computational Approaches in Biotechnology and Bioinformatics (pp. 297-315). CRC Press.
- Genetic diversity of Indian brinjal revealed by RAPD and SSR markers. Indian J. Hortic.. 2012;69(4):517-522.
- [Google Scholar]
- Assessment of diversity in Solanum surattenseBurm. f. using morphological and molecular markers and implication for its conservation. Natl. Acad. Sci. Lett.. 2013;36(5):541-549.
- [CrossRef] [Google Scholar]
Appendix A
Supplementary material
Supplementary data to this article can be found online at https://doi.org/10.1016/j.jksus.2024.103376.
Appendix A
Supplementary material
The following are the Supplementary data to this article:


