

Experimental and simulation investigations of CPV/TEG hybrid system
⁎Corresponding author at: Physics Department, College of Applied Science, Umm Al Qura University, Makkah, Saudi Arabia. mmsalaheldin@uqu.edu.sa (Mohamed Sabry),
-
Received: ,
Accepted: ,
This article was originally published by Elsevier and was migrated to Scientific Scholar after the change of Publisher.
Peer review under responsibility of King Saud University.
Abstract
Concentrator photovoltaic (CPV) technology is a leading approach for increasing the utilization and deployment of PV systems. A major disadvantage is the need for cooling to maintain the performance of the solar cell. Active cooling is power-consuming and complex. A proposed passive cooling subsystem, uses a thermoelectric generator (TEG), besides cooling the solar cell, it generates power from waste heat. Three TEG modules with different sizes and numbers of junctions were tested. The performance of the TEGs was simulated using the finite element method and heat transfer analysis. The simulated model was validated for each TEG against the manufacturer datasheet and demonstrated good agreement between the simulated and measured performances. A CPV/TEG hybrid system was investigated experimentally and compared with the obtained simulation results. The proposed system was proven to deliver a net electrical power higher than obtained using the CPV system only. Compared to only a CPV cell on top of a heat sink, the generated power of the CPV/TEG hybrid system increased by 7.4%, 5.8%, and 3% corresponding to using the
Keywords
Concentrated photovoltaics
CPV
Thermoelectric generator
TEG

1 Introduction
Photovoltaic (PV) cells have proven to be durable and capable of operation over decades. It is well known that the performance of PV cells is affected by the increase in their operating temperature. This is because part of the incident solar energy is converted into electricity while the remaining part is converted into heat, which reduces the open-circuit voltage and hence the efficiency (Skoplaki and Palyvos, 2009; Meneses-Rodrı́guez et al., 2005; Sabry and Ghitas, 2007). Exploiting such waste thermal energy by converting it to power would increase the overall PV system efficiency.
To further reduce the costs of the PV system, either stationary or tracking solar concentrator subsystems could be used. Concentrator photovoltaic (CPV) technology is a predominant approach for expanding the use and deployment of PV systems especially at locations with a clear sky. Current CPVs are highly efficient and can withstand light concentration ratios on the order of a few hundreds. The increase in temperature of such CPV systems operating under high concentration ratios is a major problem facing this technology. CPV operation requires active or passive cooling, depending on the operating light concentration levels (Aldossary et al., 2016). Active cooling systems have the disadvantage of being energy-consuming and complex. On the other hand, passive cooling is not so efficient, compared to active cooling, but is less complex and does not require energy to operate.
A CPV/thermoelectric generator (TEG) hybrid system may be a good solution for two reasons. Firstly, it offers a passive cooling subsystem for the CPV cells for maintaining solar cell efficiency at acceptable levels. Secondly, it utilizes the excess heat released from the CPV by converting it into power that is added to that produced by the main CPV system.
A study on the electrical performance in a partially illuminated TEG (Lashin et al., 2020) has been performed. The results may provide deeper insight into the incorporation of TEGs into an integrated CPV/TEG system to passively cool the solar cell as well as to produce extra thermoelectric power.
The incorporation of thermoelectric devices into CPV modules has been investigated in many studies. An integrated system with a beam spectral splitter called a hot mirror has been studied (Universitas Hasanuddin, Indonesia et al., 2018). In the system, shorter wavelength light is transmitted to the PV module, while longer wavelength light is transmitted to the TEG module. Another study investigated the partitioning of the solar spectrum to yield the maximum conversion efficiency of a PV-TEG hybrid system with a solar cell operating at ambient temperature (Kraemer et al., 2008). A solar-driven hybrid generation system in an integrated design consisting of a silicon thin-film solar cell, TEGs, and a heat collector has been examined (Deng et al., 2013). The waste heat from solar cells as well as parts of the incident solar energy are collected and used in the TEGs for thermoelectric conversion.
In a recent work (Lashin et al., 2020) CPV/TEG hybrid system has been tested against two different CPV cells, namely silicon LGBC and multijunction Ga0.35In0.65P/Ga0.83In0.17 solar cells. The results showed that the multijunction solar cell maintained a persistent electrical output under high levels of concentrated light, while the TEG generated additional output power
TEG units have been modeled and simulated in a few studies. A concentrated solar thermal TEG was modeled and simulated using a three-dimensional finite element scheme (Chen et al., 2014). In the study, three different geometries were tested and compared to study the effect of both the substrate area and the geometry of the TEG on the performance of the TEG. The results showed that for a fixed length of the TEG element, the output increases when the cross-sectional area is decreased.
The current in a photovoltaic cell is related to the applied voltage by the well-known one-diode model (Yoon and Garboushian, 1994) as given in Eq. (1):
Because the generated current is directly proportional to the incident solar irradiance, solar concentrators are used to increase the solar irradiance. Unfortunately, the increase in the incident irradiance will also elevate the device temperature, thereby reducing its output voltage accordingly. This will reduce the PV conversion efficiency
Multijunction (MJ) solar cells made of III–V compound semiconductors have high efficiencies and are used in space and terrestrial applications. The CPV used in this work is the C1MJ (Kinsey et al., 2009), which has an effective area of
TEGs, on the other hand, are potential candidates for such passive cooling of CPVs, and can generate additional energy as well. A TEG is a simple and reliable solid-state device that converts thermal energy directly into electrical energy based on the Seebeck effect, Thomson effect as well as Joule heating. TEG modules have the advantages of being environmentally friendly and have a quiet operation and no moving parts (Hsu et al., 2011). The major disadvantage of TEGs is their relatively low conversion efficiency.
A typical TEG module consists of a fixed number of P-N semiconductor junctions sandwiched between two ceramic bases. The P-N junctions are electrically connected in series, thermally connected in parallel. The application of temperature difference between the two sides of the TEG generates an electric potential which is directly proportional to the temperature difference (Bell, 2008).
The generated voltage across each P-N junction of the TEG is related to the temperature difference by
The open-circuit voltage of the TEG is the sum of the generated voltages across all the P-N junctions.
The maximum power that can be generated by a TEG is given by
In this study, the performance of a CPV/TEG hybrid system comprising of a high-efficiency multijunction concentrator solar cell coupled to a TEG module was modelled. Three TEG modules with different sizes and numbers of junctions were used in the study. The effect of the TEG size and number of junctions as well as the percentage of the TEG area covered by CPV was simulated using a CFD package, and the electrical output was calculated for each of the TEGs under study. The simulation results were verified experimentally against the three TEG modules. Finally, the total electrical output of the CPV/TEG system was measured for each of the TEG modules. In this work, the performance of the CPV/TEG system was linked to the internal structure of the TEG modules. Both experimental and simulated results support the explanations provided in this work.
2 Materials and methods
2.1 Building-up a TEG simulation model
The simulation analysis was performed based on three TEG modules with the dimensions, number of junctions, and manufacturer (European Thermodynamics Limited) codes listed in Table 1. For each TEG, a simulation was performed followed by a validation process to verify the simulation results for further investigations.
| Dimensions | No. of Junctions | Internal Resistance | Code |
|---|---|---|---|
|
|
31 | 0.18 Ω ± 15% | GM250-31-28-12 |
|
|
127 | 2.28 Ω ± 15% | GM200-127-14-10 |
|
|
49 | 0.22 Ω ± 15% | GM200-49-45-25 |
The simulation was performed via the following steps:
-
The CAD drawings of the components were produced and the modules were assembled based on the manufacturing specifications provided in the module datasheet.
-
A meshing process was performed on the resultant CAD drawings. The size of the mesh elements was adjusted based on the variation of the TEG component sizes as well as the computing capabilities and execution speed of the computer.
-
Physical parameters for each component such as electrical and thermal conductivities and the Seebeck coefficients of the P- and N- semiconductor materials were imputed into the simulation program along with the physical properties of the remaining TEG components. The variation of these physical parameters with the temperature was taken into consideration.
-
A heat transfer simulation was established for each of the three modules. The simulation took into account the many thermal processes occurring in the laboratory such as the conductive heat transfer to the heat sink, convective heat transfer to the surrounding air, and radiative heat transfer to the environment. Because the coefficients of these thermal processes are hard to measure, reasonable values that match the measurements in the datasheet were estimated and used, and the simulation was performed accordingly. Fig. 1 shows the cross-sectional temperature distribution in the junction on the top side of the
-
After obtaining the temperatures at several points in each module based on the input energy, a series of calculations were performed to calculate the generated voltage of each P-N junction based on its temperature. Then, the voltages of all the junctions in the TEG module were summed to obtain the open-circuit voltage of each module.
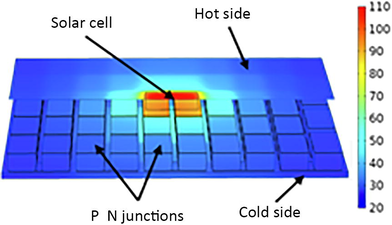
- Temperature distribution in a
Parameters used in the simulations including the boundary conditions, material properties, and mesh details are listed in Table 2.
| Component | Physical parameter | Value |
|---|---|---|
| TEG | Seebeck Coefficient (P-Type), V/K |
|
| Seebeck Coefficient (N-Type), V/K |
|
|
| Electrical Conductivity (P-Type), S/m |
|
|
| Electrical Conductivity (N-Type), S/m |
|
|
| Thermal Conductivity (P-Type), W/(m⋅K) |
|
|
| Thermal Conductivity (N-Type), W/(m⋅K) |
|
|
| Heat Capacity (P- and N-Type), J/K | 154 | |
| Alumina Thermal Conductivity, W/(m⋅K) |
|
|
| Boundary | Ceramic-Air Convective Heat Transfer, W/(m2.K) | 50 |
| Heat sink-Water Convective Heat Transfer, W/(m2.K) | In-field calculated | |
| Heat sink Walls | Smooth, No-Slip | |
| Alumina Emissivity | 0.9 | |
| Mesh | Element type | Tetrahedral |
| Maximum element size, m | 0.002 | |
| Minimum element size, m | 5.4E−4 | |
| Maximum element growth rate | 1.4 | |
A sample simulation of the temperature distribution in the
According to the manufacturer datasheets, all the chosen TEGs can operate efficiently at the hot-side temperature of approximately 200 °C to 250 °C. These temperature values match the CPV temperatures generated under the optical concentration levels used in the modeling and the experiments.
2.2 Validation
The open-circuit voltage outputs calculated from each module were validated by comparing them against those listed in the manufacturer datasheet. The cold-side temperature of each TEG was fixed at 30 °C, while the hot side temperature was varied between 50 °C and 250 °C. Fig. 2 shows the simulation results for the three TEGs. The measured open-circuit voltage was extracted from the plots given in the manufacturer datasheet. The simulation results for all the TEGs show a good match with the measured voltages given in the datasheet. The simulated open-circuit voltage values of the
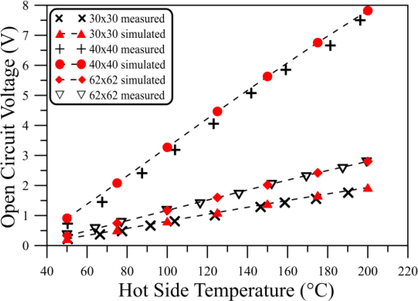
- Simulated TEG open–circuit voltage plotted against datasheet values for the three TEGs at the cold side temperature of 30 °C.
The rate of change of the solar cell efficiency with the variation of both the optical concentration ratio and the operating temperature (Kinsey and Edmondson, 2009; Wang et al., 2015) were considered in the calculations of the heat absorbed by the TEG module. The considered heat dissipation coefficients, including the conductive heat transfer coefficient between the solar cell and the TEG hot side, the conductive heat transfer coefficient between the TEG cold side and the heat sink, the convective heat transfer coefficient between the water and the heat sink, and the radiative heat transfer coefficient to the surrounding ambient were obtained from the preliminary simulations performed as described previously.
2.3 Experimental setup
A GaInP/GalnAs/Ge triple-junction photovoltaic cell with a large-area ceramic base for heat dissipation was used in the experimental study. The light source used is a custom-made solar simulator with the specifications listed in Table 3. The light source is equipped with a honeycomb-type homogenizer and produces a collimated homogeneous light from a standard Xenon lamp with variable light concentration ratios from 65 to 104 suns. The solar cell’s electrical output was measured using a standard source meter unit which traces the I–V characteristic curve of the solar cell and finds its maximum power.
| Concentrated Solar Simulator | Illuminated Area Spatial Uniformity Collimation Half Angle Temporal Instability Spectral Match Lamp Type |
0.1 m × 0.1 m <±2.5% over 0.1 m × 0.1 m <±2.5° Class A Class B for ASTM AM1.5G 1600 W Xenon Arc Lamp |
| Experimental Setup | Solar cell area Solar cell type Ceramic base area Heat sink Water bath temperature |
1 cm × 1 cm GaInP/GalnAs/Ge triple-junction 3 cm × 2 cm Aluminum (W:10 cm, L:10 cm, H:7cm) 20 °C |
The ceramic base of the solar cell was set in thermal contact with each of the three TEGs. Only the active area of the solar cell was illuminated, and both the remaining area of the solar cell ceramic base as well as the hot side of the TEGs were shaded. The electrical output of the system could not be evaluated when two or more solar cells set in contact with the TEGs. This is because the large areas of the solar cell ceramic bases created a separation between the active areas of the cells. The parameters of the experimental setup are listed in Table 3.
The solar cell was first brought in direct thermal contact with a heat sink, using a thin film of silicone grease (thermal conductivity 3.6 W/m.K), and the output power was measured. The heat sink fins were immersed completely in a water bath at a fixed temperature of 20 °C throughout the whole experiment. Then the solar cell was exposed to the desired illumination intensity, and the output power was measured along with the cell temperature.
A TEG module was then placed between the solar cell and the heat sink and attached to both. The system was illuminated, and the electrical outputs of the solar cell and the TEG as well as their temperatures under various incident light intensities were recorded.
To calculate the power generated by the TEGs, an attempt was made to measure the voltage and the current across a matched load resistance connected in parallel to the TEG. It was found that the wiring of the sample added a significant additional resistance to the system (note that the internal resistance of e.g. the
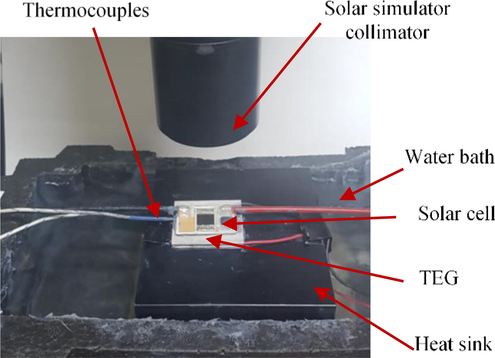
- The setup used showing the solar cell on top of the TEG attached to the heat sink that is immersed in a water bath at 20 °C.
3 Results and discussion
The temperature of each of the CPV cells and the TEG is the most significant parameter in the CPV/TEG hybrid system. An increase in the temperature will deteriorate the PV output voltage and thereby degrade the CPV performance. In contrast, the increased temperature difference between the sides of the TEG increases the electrical output of the TEG module. Fig. 4 (dotted lines with axis to the right) shows the measured solar cell temperature as a function of the optical concentration ratio for the cases where the cell was attached directly to the heat sink and where the TEG module was placed between the cell and the heat sink.
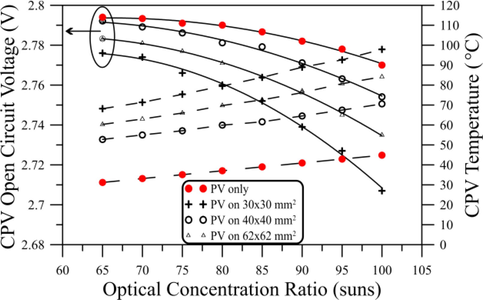
- Open-circuit voltage (left axis, solid lines) and temperature (right axis, dotted lines) when the CPV was set on top of each of the TEGs and when it was set directly on the heat sink.
The addition of the TEG modules between the solar cell and the heat sink elevated solar cell temperature. The solar cell temperatures were the highest when the
The temperature of the solar cell is reflected in its performance, especially its voltage. Fig. 4 (solid lines with axis to the left) depicts the reduction in the open-circuit voltage as a function of the optical concentration ratio.
In contrast, it is shown in Fig. 5 that the measured short circuit current of the solar cell on top of the TEGs was higher than that of the cell attached to the heat sink directly. This increase may be attributed to the positive temperature coefficient of the CPV current.
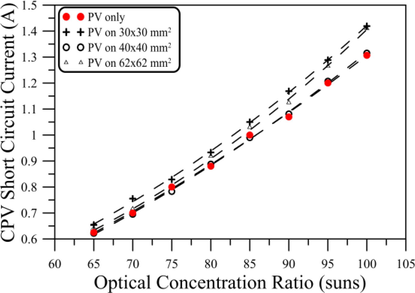
- Short circuit current of the CPV when it was set on top of each of the TEGs and when it was set directly on the heat sink.
The maximum electric power generated by the solar cell attached to the heat sink directly as well as with that generated while the cell was on top of the TEGs is shown in Fig. 6. The output power of all the cell configurations tested increased with the optical concentration ratio (or temperature). The increase in the cell output current hence masked the decrease in the output voltage due to the increase in the cell temperature. This result agrees with the results shown in Figs. 4 and 5. The largest voltage reduction of about 2.5% with increasing temperature occurred when the cell was attached to the
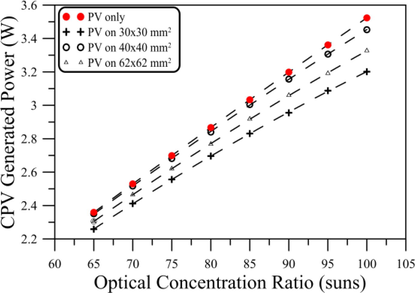
- The power generated by the CPV when it was set on top of each of the TEGs, and when it was set directly on the heat sink.
As expected, the cell output power was higher when the cells were attached directly to the heat sink compared to that generated while TEGs were inserted between the cell and the heat sink under all the tested optical concentrations. This is due to the inability of all three TEGs to reduce the solar cell temperature efficiently. This reduction in the generated power due to the use of TEGs as heat dissipation devices was compensated by the power generated by the TEGs.
The generated power of each TEG module under test was calculated by measuring the open-circuit voltage of the TEG at each illumination level and applying Eq. (4). These results are shown in Fig. 7. The
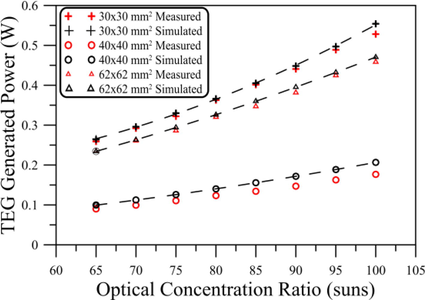
- Measured (red) and simulated (black) power generated by each of the TEGs.
The simulated powers of both the
The total power produced by the CPV/TEG hybrid system is the sum of the power produced by the solar cell and that produced by the TEG module. Fig. 8 shows the total generated power for all the CPV/TEG systems under test, as a function of the optical concentration ratio. The CPV coupled to the
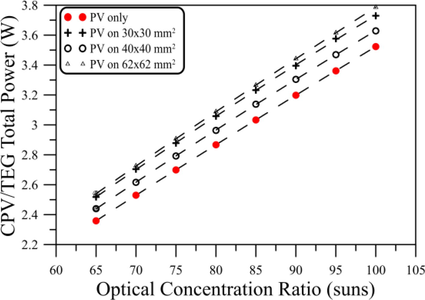
- CPV/TEG generated power for each of the TEGs as a function of concentration ratio. The output power of the CPV only (the red-dotted curve) is plotted as a reference.
This result implies that the role of the TEG in hybrid CPV/TEG systems depends on multiple factors. Although the
4 Conclusion
A passive cooling subsystem incorporating TEG was proposed. In addition to dissipating excessive heat from the solar cell, the TEG utilizes the waste heat to generate additional power. Three TEG modules with different sizes and numbers of junctions were chosen to investigate the effect of the size and number of junctions on the total system performance.
The electrical output of the selected TEG modules was simulated using the finite element method and heat transfer analysis. The simulated output was validated for each TEG module against the manufacturer datasheet and demonstrated a good match with the measurement results.
Finally, a CPV/TEG hybrid system was investigated experimentally and compared with the obtained simulation models for each TEG module under study. The results proved that the proposed system delivered a higher net electrical power than that of the CPV system only. Compared to using only the CPV on a heat sink, the power generated by the CPV/TEG hybrid system was increased by 7.4%, 5.8%, and 3% using the
Acknowledgments
This work was funded by the National Science, Technology and Innovation Plan (MAARIFAH), King Abdulaziz City for Science and Technology (KACST), Kingdom of Saudi Arabia, grant number (14-ENE2310-10).
Declaration of Competing Interest
The authors declare that they have no known competing financial interests or personal relationships that could have appeared to influence the work reported in this paper.
References
- On the temperature dependence of photovoltaic module electrical performance: a review of efficiency/power correlations. Sol. Energy. 2009;83(5):614-624.
- [CrossRef] [Google Scholar]
- Photovoltaic solar cells performance at elevated temperatures. Sol. Energy. 2005;78(2):243-250.
- [CrossRef] [Google Scholar]
- Influence of temperature on methods for determining silicon solar cell series resistance. J. Sol. Energy Eng. 2007;129(3):331-335.
- [CrossRef] [Google Scholar]
- Technical feasibility study of passive and active cooling for concentrator PV in harsh environment. Appl. Therm. Eng.. 2016;100:490-500.
- [CrossRef] [Google Scholar]
- Performance of a thermoelectric generator partially illuminated with highly concentrated light. Energies. 2020;13(14)
- [CrossRef] [Google Scholar]
- A new hybrid of photovoltaic-thermoelectric generator with hot mirror as spectrum splitter. JPS. 2018;29(supp. 2):63-75.
- [CrossRef] [Google Scholar]
- Photovoltaic-thermoelectric hybrid systems: a general optimization methodology. Appl. Phys. Lett.. 2008;92(24):243503.
- [CrossRef] [Google Scholar]
- Enhanced performance of solar-driven photovoltaic–thermoelectric hybrid system in an integrated design. Sol. Energy. 2013;88:182-191.
- [CrossRef] [Google Scholar]
- Concentrated photovoltaic/thermal hybrid system coupled with a thermoelectric generator. Energies. 2019;12(13)
- [CrossRef] [Google Scholar]
- Modeling and simulation for the design of thermal-concentrated solar thermoelectric generator. Energy. 2014;64:287-297.
- [CrossRef] [Google Scholar]
- Reduced temperature dependence of high-concentration photovoltaic solar cell open-circuit voltage (Voc) at high concentration levels. In: Proceedings of 1994 IEEE 1st World Conference on Photovoltaic Energy Conversion - WCPEC (A Joint Conference of PVSC, PVSEC and PSEC). 1994. p. :1500-1504.
- [CrossRef] [Google Scholar]
- Cost studies on terrestrial photovoltaic power systems with sunlight concentration. Sol. Energy. 1977;19(3):255-262.
- [CrossRef] [Google Scholar]
- Operating characteristics of multijunction solar cells. Sol. Energy Mater. Sol. Cells. 2009;93(6-7):950-951.
- [CrossRef] [Google Scholar]
- Experiments and simulations on low-temperature waste heat harvesting system by thermoelectric power generators. Appl. Energy. 2011;88(4):1291-1297.
- [CrossRef] [Google Scholar]
- Cooling, heating, generating power, and recovering waste heat with thermoelectric systems. Science. 2008;321(5895):1457-1461.
- [CrossRef] [Google Scholar]
- Spectral response and energy output of concentrator multijunction solar cells. Prog. Photovolt: Res. Appl.. 2009;17(5):279-288.
- [CrossRef] [Google Scholar]
- The effect of concentrated light intensity on temperature coefficient ofthe InGaP/InGaAs/Ge triple-junction solar cell. Open Fuels Energy Sci. J.. 2015;8(1):106-111.
- [CrossRef] [Google Scholar]
- “Thermoelectric generator performance enhancement by the application of pulsed heat power. In: Presented at the 6th International Conference on Fluid Flow Heat and Mass Transfer. 2019.
- [CrossRef] [Google Scholar]
- A comprehensive review of thermoelectric generators: technologies and common applications. Energy Rep.. 2020;6:264-287.
- [CrossRef] [Google Scholar]
- Design of high-efficient converter for on-board Thermoelectric Generator. In: 2014 IEEE Conference and Expo Transportation Electrification Asia-Pacific (ITEC Asia-Pacific). 2014. p. :1-6.
- [CrossRef] [Google Scholar]


