

Translate this page into:
Evolution and thematic changes of Journal of King Saud University – Science between 2009 and 2019: A bibliometric and visualized review
⁎Corresponding author. xintul@126.com (Xin-Tu Lei)
-
Received: ,
Accepted: ,
This article was originally published by Elsevier and was migrated to Scientific Scholar after the change of Publisher.
Peer review under responsibility of King Saud University.
Abstract
For the purpose of evaluating scientific output, examining literature utilization, and predicting the direction of publication for Journal of King Saud University – Science (JKSU-S). This paper explored the hot topics and new trends through the statistics of the journal between 2009 and 2019 from the perspective of bibliometric and visualization technologies. After excluding letters, book reviews, editorial materials, proceedings papers, etc., 543 valid records were screened out from Scopus database ultimately. The data were analyzed and mapped in terms of dynamics and trends of publications, productive and influential contributors and thematic and hot topic change, etc. Through these results, we also concluded the findings from these three aspects and presented a comprehensive picture of the journal. Correspondingly, this paper also provided the suggestion to authors, editorial board, publishers involved based on the findings.
Keywords
Bibliometric analysis
Journal of King Saud University – Science
Evolution and thematic changes
Visualized review
Publishing service

1 Introduction
Journal of King Saud University – Science (JKSU-S) is an official refereed publication of King Saud University and the publishing services is provided by Elsevier. Currently it is published 4 times a year. It publishes peer-reviewed research articles in the fields of physics, astronomy, mathematics, statistics, chemistry, biochemistry, earth sciences, life and environmental sciences on the basis of scientific originality and interdisciplinary interest (Elsevier, 2019a,b). After more than 10 years of development, JKSU-S has been highly recognized by professionals in the scientific community. In the 2018 Web of Science journal citation report, JKSU-S has an impact factor of 2.835, ranking 22nd among 69 journals in the Multidisciplinary Sciences category and Q2 in the JCR division.
Bibliometrics is a discipline that is commonly seen in the fields of philology, information science, mathematics, and statistics. It has been widely used due to its own characteristics (Godin, 2006). At present, bibliometrics has been widely used in natural sciences (Fu, et al., 2013), social sciences (Allen et al., 2017; Tran et al., 2018), biomedicine (Liao et al., 2018; Shekhani et al., 2017), management (Merigo and Yang, 2017; Podsakoff et al., 2008) and economics (Bonilla et al., 2015; Nagarajan et al., 2017) and many other fields, and produced many valuable results.
In addition, the bibliometrics method and technology are used to comprehensively analyze all the papers in a particular journal to showcase their research trends and influential publications, which is currently one of the research hotspots in the field of bibliometrics (Calma and Davies, 2015; Glanzel and Moed, 2002; Senel and Demir, 2018). For example, Kamdem et al. (2019) analyzed the research trend of food chemistry through bibliometrics. According to the research of Zeleznik et al. (2017), the number of articles published by Journal of Advanced Nursing is slightly decreased, but there is a positive trend in literature creation. On the 50th anniversary of the European Journal of Marketing, Martinez-Lopez et al. (2018) conducted a bibliometric analysis of its publications in the past 50 years and studied the most prolific authors, institutions and countries.
In summary, bibliometric analysis can be used to measure the progress of journals, determine the factors and performance that affect publishers, and further understand the development of research. A more in-depth analysis can reveal research collaborations between organizations, authors, or countries, as well as the evolution of topics in selected knowledge areas (Glanzel and Moed, 2002; Sugimoto et al., 2019). JKSU-S is an important journal in the field of science, it is necessary to make a systematic retrospective analysis of its development, so as to help scholars in this field have a deeper understanding of JKSU-S journal and provide some references for their research.
In this paper, based on the 543 JKSU-S publications retrieved in the Scopus database, we have carried out bibliometric analysis, which mainly includes the following three aspects:
Basic overview of JKSU-S publications over the years, including publication volume, citations, authors, knowledge dissemination, etc.
The most prolific authors, institutions, and countries;
According to the changes of key words in different stages, this paper explored the changes of research topics and hot topics.
2 Materials and methods
2.1 Data collection
In recent years, with the rapid development of computers and the Internet, information collection has become easier and easier, and most information collection does not need to be done manually.
In this study, we searched the title of the publication “Journal of King Saud University – Science” in the Scopus database (Archambault et al., 2009; Harzing and Alakangas, 2016), and then selected 524 articles and 19 reviews published in 2009–2019 as data sources for analysis (as of August 1st, 2019).
The Scopus database is the research management and subject planning database launched by Elsevier, the world’s largest publisher. It is the world’s largest peer-reviewed journal abstract and citation database. It contains more than 23,000 peer-reviewed academic journals, more than 7 million academic conference papers, and 190,000 books published by 5000 publishers around the world, covering the natural sciences, technology, engineering, medicine, social sciences, arts and humanities. It is an important tool for researchers to track the development of disciplines (Elsevier, 2019a,b).
2.2 Glossary and methods description
As mentioned above, we extracted 543 publications published by JKSU-S in the past 10 years as a source of research data, and analyzed them in detail according to the year or specific period. The following indicators were designed to describe the characteristics of the 543 publications.
TP: Total publication number, including article and review
TC: Total Citation number
ATC: Average citation number
TCR: Total cited references
ACR: Average cited references
NA: Number of authors
ANA: Average number of authors per paper
h: H-index, proposed by physicist Hirsch in 2005, a person’s h-index means that at least one of the papers published by him in a certain period of time is not less than h times. (Alonso et al., 2009; Hirsch, 2005, 2007).
In this study, we used the statistical function of the Scopus database itself to perform statistics on the publication of JKSU-S over the years, including publications, citations, references, authors, institutions, country distributions, etc., and input the statistical results into Excel. Then, this paper adopted VOSviewer to count keywords, and subsequently standardized some keywords by merging the synonyms manually (e.g., “topological space” and “topological spaces” were replaced by “topological space”, “homogenous balance” and “homogeneous balance” were replaced by “homogeneous balance”).
In addition, in order to obtain a comprehensive view of the results, we also used the VOSviewer software (van Eck and Waltman, 2010) to conduct the graphical visualizations of cited sources co-citation (Boyack and Klavans, 2010; Shiau et al., 2017), sources citation (Kolahi, 2018; Van Eck and Waltman, 2017) and keywords co-occurrence (Cheng et al., 2018; Li et al., 2016; Radhakrishnan et al., 2017). And Microsoft Visio was employed to demonstrate the results of JKSU-S’s knowledge exchange with other journals.
3 Results and discussions
3.1 Dynamics and trends of publications
3.1.1 Annual publications and trends
Table 1 shows the overview of the publication of the JKSU-S from 2009 to 2019. As the table suggests, the trend of the total publication (TP) of the JKSU-S tends to be fluctuated, it boosted from 16 to 58 during the first three years, while it showed a declining trend between 2012 and 2014, then, it gradually increased and peaked at 76 in 2018. As for the total citations (TC) and average citation number (ATC), it can be seen that these two indicators have the similar trend, they witnessed an upward trend first and reached the peak in 2014, while showed a downward trend after that. We can see that TC and ATC both decreased dramatically since 2014, this is mainly due to the hysteresis of citing, an article might take 4–5 years to reach its citation burst after it was published, therefore, the low number of TC and ATC is reasonable. As for total cited references (TCR), it generally showed an increasing trend between 2009 and 2019, and the average cited references (ACR) increased a lot compared with a decade ago, this is probably because the development of network technique made it easier for authors to access to online resources, meanwhile, the concept of “information sharing” also promotes academic communication. In terms of number of authors, basically, it shows an upward trend from 2009 to 2019 and it increases with the increase of TP, and its growing rate is evident, the average number of authors per paper (ANA) was only 2.13 in 2019 while it rocketed to 3.33 this year, the mean of ANA is also higher than 3. This could reflect that, currently, a author tend to work with multiple authors to publish articles compared with a decade ago. The trend of H-index is basically consistent to ATC, however, although the peaks of TC and ATC occurred in 2014 and the peaks are considerably higher than other years, H-index reached its highest point at 16 in 2013. Note: 2019 data was uncompleted, as of August 19, 2019. Indicators in the table: TP: Total publication number; TC: Total Citation number, ATC: Average citation number, TCR: Total cited references, ACR: Average cited references, NA: Number of authors, ANA: Average number of authors per paper, h: h-index.
Year
TP
TC
ATC
TCR
ACR
NA
ANA
h
2009
16
102
6.38
392
24.50
34
2.13
5
2010
39
455
11.67
964
24.72
79
2.03
12
2011
58
597
10.29
1307
22.53
144
2.48
11
2012
52
540
10.38
1425
27.40
145
2.79
14
2013
43
675
15.70
1409
32.77
140
3.26
16
2014
41
1013
24.70
1789
43.63
110
2.68
13
2015
49
573
11.69
1632
33.31
186
3.80
13
2016
59
519
8.80
1796
30.44
194
3.29
13
2017
58
362
6.24
2559
44.12
190
3.28
11
2018
76
200
2.63
2413
31.75
267
3.51
6
2019
52
129
2.48
2090
40.19
173
3.33
6
Total
543
5165
9.51
17,776
32.74
1662
3.06
3.1.2 Knowledge flow
Fig. 1 shows the flow of knowledge between JKSU-S and other journals, each side of the figure has 15 journals. The left side of the figure represents the top 15 journals cited by Journal of King Saud University – Science, while the right side of the figure are the 15 journals citing from JKSU-S most. Applied Mathematics and Computation is the most influential journal to JKSU-S, there were 236 publications in Applied Mathematics and Computation ever cited by JKSU-S, this citation number is significantly higher than other journals. As for citing journals, JKSU-S itself cited from JKSU-S most, there were 62 publications in JKSU-S ever cited itself. As can be seen from the figure, the scope of cited journals is more related to mathematics and chemistry, while the scope of citing journals focus more on physics and environment.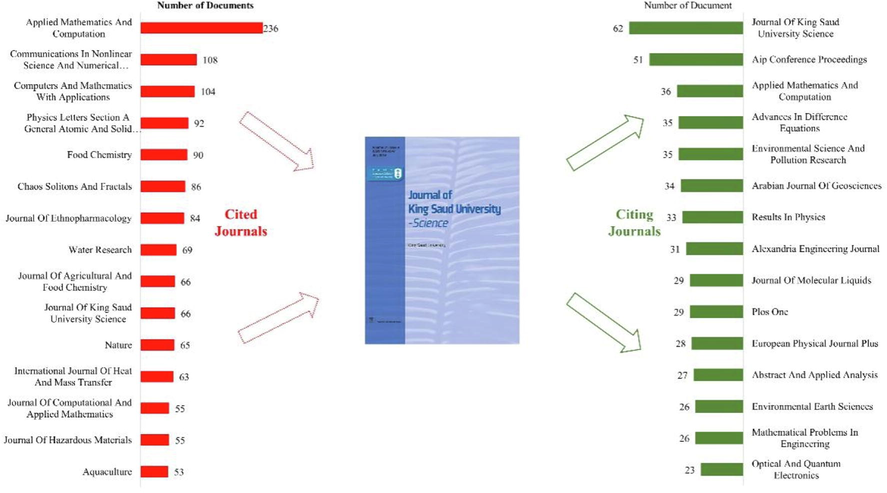
Knowledge flow between JKSU-S and other sources.
Fig. 2 demonstrates the node distribution of JKSU-S’s citation from 2009 to 2019. The size of the node reflects how often JKSU-S references these journals, and the larger the node is, the higher the frequency of the citation is. In addition, the lines between journals mean the connections between journals, and more lines represent more connections between those journals. From the figure, we can see that Applied Mathematics and Computation has the largest node, and as mentioned in Fig. 1, it has 236 publications cited by JKSU-S, which exerts huge impact on JKSU-S. Moreover, journals like Applied Mathematics and Computation, Communications in Nonlinear Science and Numerical Simulation, Computers And Mathematics with Applications and Food Chemistry are in Q1 of JCR (Journal Citation Reports) division, which is at a relative high level, largely citing from these world class journals could ensure the quality of article.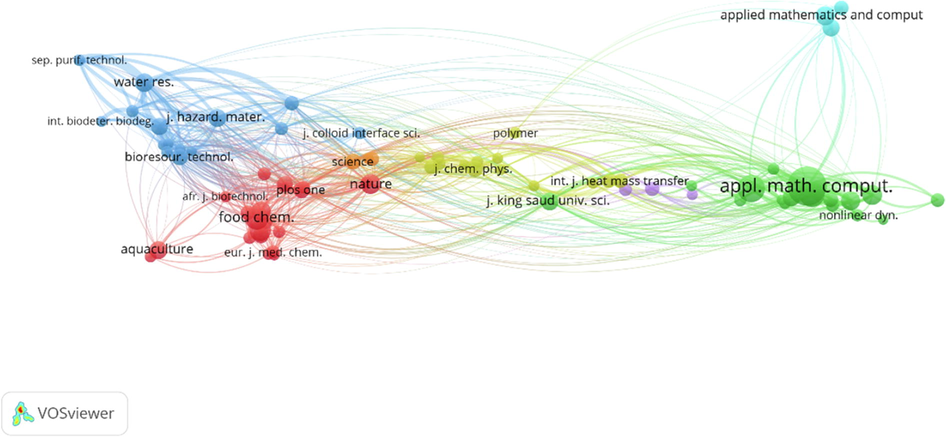
Journals that are cited by JKSU-S.
Similar to Figs. 2 and 3 shows the journals cited from JKSU-S between 2009 and 2019, unlike the journals cited by JKSU-S, the distribution nodes of the journals in Fig. 2 tend to be even. JKSU-S itself and AIP Conference Proceedings are the two sources that cited from JKSU-S most, followed by Applied Mathematics and Computation, Advances in Difference Equations, Environmental Science and Pollution Research and Arabian Journal of Geosciences, etc. Many of them belong to Q1 or Q2 of JCR division, a large amount of citations by these high-level journals could manifest that the quality of JKSU-S is accepted by many other journals.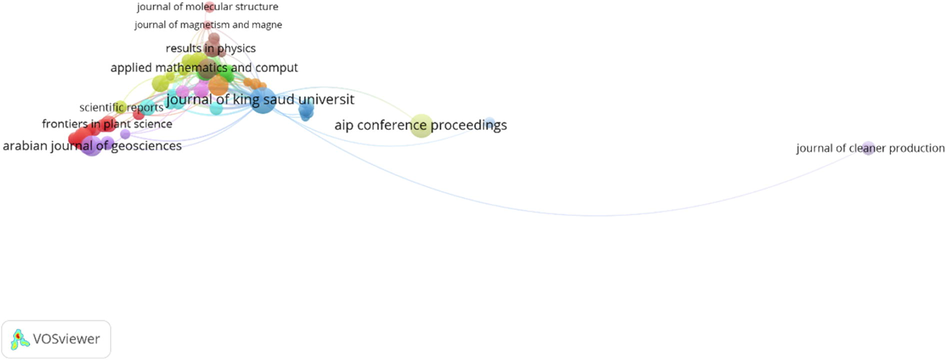
The map of citing publication of JKSU-S.
3.2 Productive and influential contributors
3.2.1 Leading authors and knowledge sources
As Table 1 presented previously, there were 1662 authors ever published their articles or reviews on JKSU-S, here, the 15 most productive authors were selected and their data were analysed, as shown in Table 2 below.
Rank
Authors
Institutions
Number of publications (NP)
Total citations
Countries/territories
Total citations/publications
Percentage
H-index
1
Yildirim A.
Ege University
16
221
Turkey
13.81
2.95%
7
2
Mohyud-Din S.T.
HITEC University
9
97
Pakistan
10.78
1.66%
6
3
Khan Y.
Zhejiang University
7
160
China
22.86
1.29%
5
4
Biazar J.
Islamic Azad University (Rasht Branch)
6
74
Iran
12.33
1.10%
5
5
Faraz N.
Shanghai University
6
159
China
26.50
1.10%
5
6
Noor M.A.
COMSATS Institute of Information Technology
5
44
Pakistan
8.80
0.92%
2
7
Torres D.F.M.
University of Aveiro
5
85
Portugal
17.00
0.92%
4
8
Yousif E.
Al-Nahrain University
5
61
Iraq
12.20
0.92%
4
9
Al-Sehemi A.G.
King Khalid University
4
20
Saudi Arabia
5.00
0.74%
3
10
Biswas A.
Delaware State University
4
36
United States
9.00
0.74%
3
11
Dkhil M.A.
Helwan University
4
13
Egypt
3.25
0.74%
3
12
Ebrahimi M.
Islamic Azad University
4
49
Iran
12.25
0.74%
4
13
Eslami M.
University of Guilan
4
60
Iran
15.00
0.74%
3
14
Ghanbari B.
Faculty of Science Islamic Azad University
4
53
Iran
13.25
0.74%
4
15
Hossain M.A.
University of Nizwa
4
70
Oman
17.50
0.74%
4
As Table 2 shown, these 15 authors were arranged in order of the number of publications from highest to lowest. Yildirim is undoubtedly the author that contributed to JKSU-S most, he ranks first in number of publications, total citations, percentage and H-index, and his number of publications and total citations are significantly higher than other 14 authors. Besides, there are also two authors who work in China should be noticed, Khan (NP = 7) and Faraz (NP = 6), their articles were cited for 160 times and 159 times respectively and their average citation numbers are both greater than 20, which even exceeded Yildirim’s.
3.2.2 Leading institutions
As an international journal, JKSU-S has attracted many institutions around world to make contribution to them. This paper chose the top 15 institutions that published most articles on JKSU-S and analyzed their data, as Table 3 presented below.
Rank
Institutions
Country
Number of publications
Total citations
Total citations/publications
Percentage
TOP 1%
1
King Saud University
Saudi Arabia
105
926
8.82
19.34%
Y
2
Ege Üniversitesi
Turkey
16
199
12.44
2.95%
Y
3
King Khalid University
Saudi Arabia
15
104
6.93
2.76%
N
4
King Abdulaziz University
Saudi Arabia
12
111
9.25
2.21%
Y
5
The University of Guilan
Iran
11
90
8.18
2.03%
N
6
Donghua University
China
10
156
15.60
1.84%
Y
7
Universiti Kebangsaan Malaysia
Malaysia
9
92
10.22
1.66%
Y
8
Taibah University
Saudi Arabia
8
38
4.75
1.47%
N
9
Islamic Azad University
Iran
8
74
9.25
1.47%
Y
10
Aligarh Muslim University
India
8
508
63.50
1.47%
Y
From 2009 to 2019, these 15 institutions have published 202 papers on the JKSU-S in total, accounting for 37.2% of the total number of JKSU-S publications. Since Journal of King Saud University – Science is an official refereed publication of King Saud University, it is no surprise to see King Saud University ranks first, they published 105 articles or reviews on JKSU-S alone, which takes up almost one fifth of total publications of JKSU-S. They do not only have the highest publication number, but also have the highest total citations, and these two indicators of King Saud University are considerably higher than rest of institutions. Besides, Donghua University only contributed 10 papers to JKSU-S while its average citation number is as high as 15.60, which ranked second place in terms of average citation number. In addition, surprisingly, the average citation number of Aligarh Muslim University is 63.50, which reflects the high quality of their articles to some extent. Interestingly, except for Donghua University, the other 9 institutions are all from Muslim countries.
Among these 10 institutions, 7 universities are listed in the top 1% of institutions by the Essential Science Indicators (ESI). ESI ranks universities based on the number of citations and updates them every two months. It is an important indicator used today to evaluate the international academic level and impact of academic institutions and universities (Vieira and Gomes, 2010).
3.2.3 Leading countries/territories
Table 4 shows the most productive countries/territories of JKSU-S. The 10 most prolific countries/territories are listed in the table and sorted by the number of publications (NP). From 2009 to 2019, Saudi Arabia has published 128 manuscripts, which accounts for 23.57% of total publications of JKSU-S, in addition, Saudi Arabia’s publications were cited for 967 times in total and their H-index reached 16.
Rank
Country
Number of publications
Total citations
Total citations/publications
Percentage
H-index
1
Saudi Arabia
128
967
7.55
23.57%
16
2
India
81
1409
17.40
14.92%
17
3
Iran
55
594
10.80
10.13%
14
4
Malaysia
49
531
10.84
9.02%
14
5
Pakistan
43
316
7.35
7.92%
10
6
Egypt
41
315
7.68
7.55%
10
7
China
29
297
10.24
5.34%
10
8
Turkey
25
286
11.44
4.60%
9
9
United States
21
208
9.90
3.87%
8
10
Nigeria
19
135
7.11
3.50%
7
Generally, total citations should increase with the increase of number of publications, however, high publication number does not represent high total citations. The number of publications of Saudi Arabia is greater than India’s, while its average citation number and H-index are lower than India.
As for geographic distribution, among these 10 countries, 6 countries (Saudi Arabia, India, Iran, Malaysia, Pakistan and China) are Asian countries, Egypt and Turkey are from Africa, the US comes from North America, even 97% of territory of Turkey is in Asia, but it is more regarded as an European country. Moreover, we can see that Saudi Arabia, Iran, Egypt and Turkey are located in the Middle East.
3.3 Thematic and hot topic change
Table 5 demonstrates the top keywords used in JKSU-S from 2009 to 2019, the whole period was divided into three different stages, which are Subset I (2009–2011), Subset II (2012–2015) and Subset III (2016–2019), each stage has 20 keywords. Different stages have their own priorities, and the change of these keywords also could reflect the change of hot spots and concerns in JKSU-S. If we take the first two keywords of each subset out, it can be seen that the first two keywords of each subset could reflect the research emphasis of different stage. From “Homotopy perturbation method” and “Homotopy analysis method”, it is easy to see that Subset I focus on Homotopy; In Subset II, “Antibacterial activity” is the keyword that ranks first, “Antioxidant activity”, “Antioxidant” and “Antimicrobial” tie for second place, these four keywords can show that this subset concentrate on Antibacterial and Antioxidant stuff. As for Subset III, the first two keywords are “Fractional calculus” and “Fractional differential equations”, which could demonstrate that Subset III puts fractional calculus in the first place.
2009–2011 (Subset I)
2012–2015 (Subset II)
2016–2019 (Subset III)
Keywords
Frequency
Keywords
Frequency
Keywords
Frequency
Homotopy perturbation method
8
Antibacterial activity
8
Fractional calculus
9
Homotopy analysis method
5
Antioxidant activity
5
Fractional differential equations
6
Topological space
4
Antioxidant
5
Porous medium
4
Rough set
4
Antimicrobial
5
Antioxidant activity
4
Saudi Arabia
3
Oxidative stress
4
Antioxidant
4
Boussinesq equation
3
Variational iteration method
3
Variational iteration method
3
Variational inequalities
2
Solitary wave solution
3
Simulation
3
Ultrastructure
2
Riccati equation
3
Silver nanoparticles
3
Solitons
2
Phytochemical screening
3
Quercetin
3
Sensillae
2
Optimal control
3
Oxidative stress
3
Optimization
2
Integrability
3
Monte Carlo
3
Near set
2
Homotopy perturbation method
3
MHD
3
Modified Riemann-Liouville derivative
2
Homotopy analysis method
3
HPLC
3
Mittag-Leffler function
2
G’G-Expansion method
3
Essential oil
3
Meta-heuristics
2
Essential oil
3
Caputo fractional derivative
3
Homogeneous balance
2
Diabetes
3
Antifungal activity
3
He’s variational iteration method
2
X-ray diffraction
2
Zinc oxide
2
GPT
2
WSSV
2
X-ray diffraction
2
GOT
2
Weight function
2
Varian
2
Fuzzy polynomials
2
Travelling waves
2
Total phenolic content
2
Table 6 demonstrates more about the keywords change in three different stages. Keywords in a column means that the keywords only showed up in the corresponding stage, for example, “Topological space” only appeared in subset I and other two subsets did not have the keyword. As the table suggests, it can be seen that Subset I has little connection with Subset II and there were no common keywords between Subset I and Subset III, besides, Subset II & III have a few common keywords, which could manifest that the focuses of these two subsets are relatively close. If we summarize the characteristic of each subset, most of the top keywords in Subset I are belong the scope of mathematics, many Subset II’s top keywords are related to chemistry or biochemistry, and the top keywords of Subset III are more like the combination of chemistry and mathematics. Although JKSU-S publish articles in various fields, the top keywords of them mainly concentrate on chemistry and mathematics.
2009–2011 (Subset I)
2012–2015 (Subset II)
2016–2019 (Subset III)
Subset I & II
Subset II & III
Subset I & III
Topological space
Antibacterial activity
Fractional calculus
Homotopy perturbation method
Antioxidant activity
Rough set
Antimicrobial
Fractional differential equations
Homotopy analysis method
Antioxidant
Saudi Arabia
Solitary wave solution
Porous medium
Variational iteration method
Boussinesq equation
Riccati equation
Simulation
Oxidative stress
Variational inequalities
Phytochemical screening
Silver nanoparticles
Essential oil
Ultrastructure
Optimal control
Quercetin
X-ray diffraction
Solitons
Integrability
Monte Carlo
Sensillae
G’G-expansion method
MHD
Optimization
Diabetes
HPLC
Near set
WSSV
Caputo fractional derivative
Modified Riemann-Liouville derivative
Weight function
Antifungal activity
Mittag-leffler function
Travelling waves
Zinc oxide
Meta-heuristics
Varian
Homogeneous balance
Total phenolic content
He’s variational iteration method
GPT
GOT
Fuzzy polynomials
Fig. 4 shows the keywords co-occurrence network map in JKSU-S, which can directly illustrate Table 5. The size of the nodes represents the frequency of the keywords, the larger the node is, the higher the frequency is. Therefore, we can see that “antioxidant activity”, “antioxidant”, “antibacterial activity” and “oxidative stress” are the four keywords that appeared in JKSU-S most between 2009 and 2019.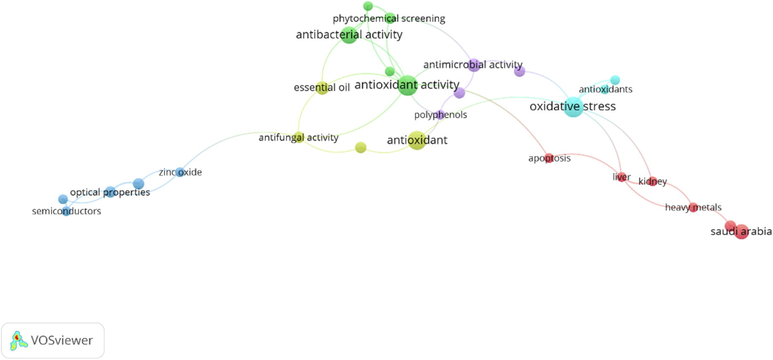
Keywords co-occurrence from 2009 to 2019.
4 Conclusion
From the angle of dynamics and trends of publications, the publishing profile of JKSU-S and the knowledge flow between JKSU-S and other journals were presented in the paper. The current total publications of JKSU-S increased compared with a decade ago, while the total citations and H-index generally showed an upward trend followed by a downward trend from 2009 to 2019. And interestingly, more authors of JKSU-S tend to collaborate on one same article, which shows the cooperative trend in current research. Besides, the knowledge flow has shown that Applied Mathematics and Computation is the journal that affect JKSU-S most and AIP Conference Proceedings is the source citing JKSU-S most other than JKSU-S itself.
As for the productive and influential contributors, Asia undoubtedly made the most contribution to JKSU-S, most of the most prolific authors and institutions are from Asian countries.
In terms of the thematic and hot topic change, different stages have their own priorities, “antioxidant activity”, “antioxidant”, “antibacterial activity” and “oxidative stress” are the four keywords that mentioned by JKSU-S most between 2009 and 2019, and from those tables, it can be seen that the concerned keywords of these 3 subsets changed significantly, and the top keywords of them mainly concentrate on chemistry and mathematics.
Therefore, we could provide suggestions to publisher, editorial board of JKSU-S and authors. From the aspect of publisher, this article could help them to under the condition of JKSU-S, which may further assist them to evaluate the journal. As for the editorial board of JKSU-S, this paper provided a publishing profile of JKSU-S as well as the most productive authors, institutions and countries, besides, we also presented the keywords change of JKSU-S and keywords comparison between publications of JKSU-S and hot papers, which could help them to adjust their research direction and pursuit the trend of international hot topics. Lastly, in terms of author, they could know the topics that JKSU-S prefers through this paper, thus, they can be clear that whether they should submit their manuscripts to JKSU-S or not.
Declaration of Competing Interest
The authors declare that they have no known competing financial interests or personal relationships that could have appeared to influence the work reported in this paper.
References
- Quantifying research output on poverty and non-communicable disease behavioural risk factors in low-income and lower middle-income countries: a bibliometric analysis. BMJ Open. 2017;7(11):7.
- [CrossRef] [Google Scholar]
- H-index: a review focused in its variants, computation and standardization for different scientific fields. J. Informetr.. 2009;3(4):273-289.
- [CrossRef] [Google Scholar]
- Comparing of science bibliometric statistics obtained from the Web and Scopus. J. Am. Soc. Inf. Sci. Technol.. 2009;60(7):1320-1326.
- [CrossRef] [Google Scholar]
- Economics in Latin America: a bibliometric analysis. Scientometrics. 2015;105(2):1239-1252.
- [CrossRef] [Google Scholar]
- Co-citation analysis, bibliographic coupling, and direct citation: which citation approach represents the research front most accurately? J. Am. Soc. Inf. Sci. Technol.. 2010;61(12):2389-2404.
- [CrossRef] [Google Scholar]
- Studies in higher education 1976–2013: a retrospective using citation network analysis. Stud. High. Educ.. 2015;40(1):4-21.
- [CrossRef] [Google Scholar]
- Mapping knowledge structure by keyword co-occurrence and social network analysis evidence from library hi tech between 2006 and 2017. Libr. Hi Tech. 2018;36(4):636-650.
- [CrossRef] [Google Scholar]
- Elsevier, 2019a. Journal of King Saud University – Science. https://www.journals.elsevier.com/journal-of-king-saud-university-science (accessed on 1 August 2019).
- Elsevier, 2019b. Scopus. https://www.elsevier.com/solutions/scopus (accessed on 1 August 2019).
- Mapping of drinking water research: a bibliometric analysis of research output during 1992–2011. Sci. Total Environ.. 2013;443:757-765.
- [CrossRef] [Google Scholar]
- Journal impact measures in bibliometric research. Scientometrics. 2002;53(2):171-193.
- [CrossRef] [Google Scholar]
- Google Scholar, Scopus and the Web of Science: a longitudinal and cross-disciplinary comparison. Scientometrics. 2016;106(2):787-804.
- [CrossRef] [Google Scholar]
- An index to quantify an individual's scientific research output. Proc. Natl. Acad. Sci. USA. 2005;102(46):16569-16572.
- [CrossRef] [Google Scholar]
- Does the h index have predictive power? Proc. Natl. Acad. Sci. USA. 2007;104(49):19193-19198.
- [CrossRef] [Google Scholar]
- Research trends in food chemistry: a bibliometric review of its 40 years anniversary (1976–2016) Food Chem.. 2019;294:448-457.
- [CrossRef] [Google Scholar]
- Co-citation sources of Dental Hypotheses. Dental Hypotheses. 2018;9(1):1-2.
- [CrossRef] [Google Scholar]
- Evolutionary features of academic articles co-keyword network and keywords co-occurrence network: based on two-mode affiliation network. Physica A. 2016;450:657-669.
- [CrossRef] [Google Scholar]
- A bibliometric analysis and visualization of medical big data research. Sustain. Basel. 2018;10(1):18.
- [CrossRef] [Google Scholar]
- Fifty years of the European Journal of Marketing: a bibliometric analysis. Eur. J. Marketing. 2018;52(1–2):439-468.
- [CrossRef] [Google Scholar]
- A bibliometric analysis of operations research and management science. Omega Int. J. Manage. Sci.. 2017;73:37-48.
- [CrossRef] [Google Scholar]
- The impact of population ageing on economic growth: a bibliometric survey. Singap. Econ. Rev.. 2017;62(2):275-296.
- [CrossRef] [Google Scholar]
- Scholarly influence in the field of management: a bibliometric analysis of the determinants of university and author impact in the management literature in the past quarter century. J. Manage.. 2008;34(4):641-720.
- [CrossRef] [Google Scholar]
- Novel keyword co-occurrence network-based methods to foster systematic reviews of scientific literature. PloS One. 2017;12(3):16.
- [CrossRef] [Google Scholar]
- Bibliometric and scientometric analysis of the articles published in the journal of religion and health between 1975 and 2016. J. Relig. Health. 2018;57(4):10.
- [CrossRef] [Google Scholar]
- Bibliometric analysis of manuscript characteristics that influence citations: a comparison of six major radiology journals. Am. J. Roentgenol.. 2017;209(6):1191-1196.
- [CrossRef] [Google Scholar]
- Co-citation and cluster analyses of extant literature on social networks. Int. J. Inf. Manage.. 2017;37(5):390-399.
- [CrossRef] [Google Scholar]
- Factors affecting sex-related reporting in medical research: a cross-disciplinary bibliometric analysis. Lancet. 2019;393(10171):550-559.
- [CrossRef] [Google Scholar]
- A bibliometric analysis of the global research trend in child maltreatment. Int. J. Environ. Res. Pub. Health. 2018;15(7):25.
- [CrossRef] [Google Scholar]
- Software survey: VOSviewer, a computer program for bibliometric mapping. Scientometrics. 2010;84(2):523-538.
- [CrossRef] [Google Scholar]
- Citation-based clustering of publications using CitNetExplorer and VOSviewer. Scientometrics. 2017;111(2):1053-1070.
- [CrossRef] [Google Scholar]
- A bibliometric analysis of the Journal of Advanced Nursing, 1976–2015. J. Adv. Nurs.. 2017;73(10):2407-2419.
- [CrossRef] [Google Scholar]


