

Evaluation of the capacity of PET bottles, water aeration, and water recirculation to reduce evaporation in containers of water
⁎Corresponding author. MArganisJ@iingen.unam.mx (Maritza Liliana Arganis Juárez),
-
Received: ,
Accepted: ,
This article was originally published by Elsevier and was migrated to Scientific Scholar after the change of Publisher.
Peer review under responsibility of King Saud University.
Abstract
Objectives
To evaluate the effectiveness of an evaporation reduction method in which the greater part of the water surface was covered with PET-type plastic bottles. The capacity of this method to diminish natural evaporation was compared to water aeration, water recirculation, and the control (without intervention). With evolutionary computation, including genetic algorithms and genetic programming, equations for calculating evaporation were developed based on meteorological factors.
Methods
Four containers of water were placed on a flat roof in Mexico City (thus exposed to the factors of weather), and evaporation was measured daily with an evaporimeter. Each container was assigned to one of the evaporation reduction methods (PET bottles, water aeration, or water recirculation) or to the control (without intervention). Evaporation-related variables were selected according to previous reports and principal component analysis, and their values were acquired from a nearby meteorological station. The study was conducted from April of 2020 to February of 2021.
Results
Covering the water surface with PET bottles avoided 38.61% (a total of 139 mm) of natural evaporation, which is represented by the control. The water aeration and water recirculation methods diminished evaporation by 7.22% (26 mm) and 2.22% (8 mm), respectively. The best equations for estimating evaporation were obtained with genetic programming for the control container and a genetic algorithm for the container with PET bottles.
Conclusions
The PET bottle method of evaporation reduction was 7 and 17 times more effective than water aeration and water recirculation, respectively. The 38.61% decrease in evaporation achieved by covering the water surface with PET bottles constitutes a substantial savings in water. Hence, the implementation of such a method should be considered to contribute to water conservation in reservoirs. The use of PET bottles is a practical and inexpensive method requiring only a few cleaning maneuvers to prevent the proliferation of unwanted aquatic fauna.
Keywords
Water evaporation
Evaporation reduction
PET plastic bottles
Principal component analysis
Genetic algorithms
Genetic programming

1 Introduction
Evaporation constitutes an essential part of the water cycle, being natural and gradual process in which liquid water enters the atmosphere as vapor (Aparicio, 1992: Aranda, 1998). It occurs when more molecules detach from a given surface of water (escaping into air as vapor) than those that reenter this surface. The process of evaporation increases with greater wind speed, a rise in temperature, and a decrease in humidity (Mostafa and Thamer, 2009), as well as with higher levels of rainfall and solar irradiance, then was studies about mechanicals technique (Helfer et al., 2009) and most recently even do studies more complex like artificial destratification (Helfer et al., 2018).
In Mexico, slightly over 72% of continental water undergoes evaporation (CONAGUA, 2018), representing a large loss of an essential resource for humans. The impact is more pronounced in regions that have low humidity for extended periods. On the other hand, global climate change has an increasingly negative effect on limited supply of surface water (Vilaclara, 2017), producing hardships on populations in regard to their household needs and agricultural activity.
There is an urgent need to enhance the volume of usable continental surface water by developing technology and materials capable of diminishing evaporation in reservoirs.
Each method has advantages and disadvantages. First, water aeration and water recirculation are natural techniques of water evaporation reduction, secondly floating covers are the most effective for decreasing evaporation but can be detrimental to water quality (Mostafa and Thamer, 2009). In the 1960s, protective layers began to be applied to water surfaces to impede evaporation (Mostafa and Thamer, 2009). Later was studied the design of covers (Cooley, 1970) to understand energy relationships. Additionally, the reduction of evaporation causes the water temperature to rise due to greater vapor pressure. Bursztyn (1966) experimented with techniques to diminish water temperature, including creation of a water surface cover. The best results were obtained by incorporating calcium carbonate pigments into a paraffin cover.
Roberts (1957) investigated the application of monomolecular films of fatty alcohols to impede the evaporation, Gugliotti et al. (2005) applied this study on water samples taken from the Guarapiranga and Billings reservoirs in the south of Sao Paulo, Brazil. The outcome was more favorable with the mixed hexadecanol and octadecanol films. Hassan et al. (2007) demonstrated a 74% reduction with a circular foam system, which is safe for the environment.
Also studies about the efficient self-assembling modular as cover floating (Aminzadeh et al., 2018), as partial covers (Assouline et al., 2011), and just the cover in small reservoirs (Mady et al., 2021).
In Saudi Arabia, palm leaves were tied with wires into a mesh to provide shade structures for containers (Shamshad and Abdulmohsen, 2013); later for produce shadow was the technique with shadow balls in USA (BBC, 2015) and Chile (Science is News, 2015). The technique was tested with one- and two-layer structures, leading to an average decrease in evaporation of 47 and 58%, respectively. In Chile (Silva et al., 2017), transparent covers were installed on solar ponds. The reduced evaporation caused the temperature of the water in the tank to rise, thus yielding two benefits at the same time. In Qatar, filters of different materials were mounted on the top of cooling towers to impede water evaporation, with a saving of 11–17% of evaporation (Shublaq and Sleiti, 2020). In Germany, orchids were found to absorb water from the atmosphere and conduct it to the soil, although part of the gain was lost in evaporation (Hauber et al., 2020).
The aim of the present study was to evaluate the effectiveness of an evaporation reduction method consisting of covering the greater part of the water surface with PET-type plastic bottles. The capacity of this method to diminish natural evaporation was compared to the control (without intervention) and two other techniques of evaporation reduction: water aeration and water recirculation. On a daily basis, evaporation was quantified and the values of related meteorological variables (acquired from a nearby meteorological station) were recorded (EMA Ecoguardas, 2020). The participation of each meteorological factor in evaporation was determined. The measured data were analyzed with graphs generated by using evolutionary computation, including genetic algorithms and genetic programming. The graphs were fitted with mathematical models furnished by Matlab, and trend lines were calculated with Excel©-type spreadsheets.
2 Material and methods
Water was added to four identical plastic containers for the study groups: in container 1, no evaporation reduction method was employed (the control); in container 2, the greater part of the water surface was covered with PET-type plastic bottles (Fig. 1); in container 3, the water was aerated (Fig. 2); and in container 4, the water was recirculated (Fig. 3). The experiment was carried out from April of 2020 to February of 2021.
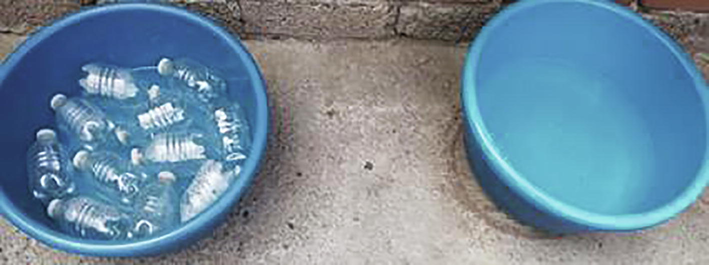
- The control container (on the right, no evaporation reduction method) and the container with the evaporation reducer currently under study (on the left, with PET bottles to cover the water surface).
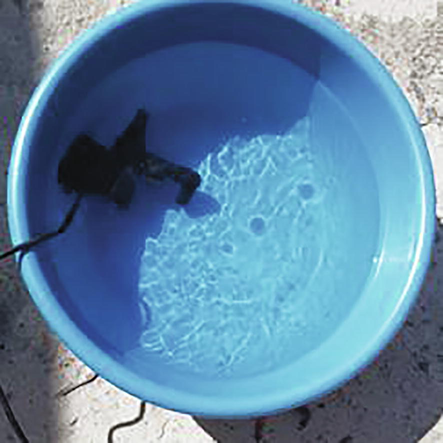
- A comparative evaporation reduction method in which an air pump and hose introduced an air bubble plume in the center of the bottom surface of the container.
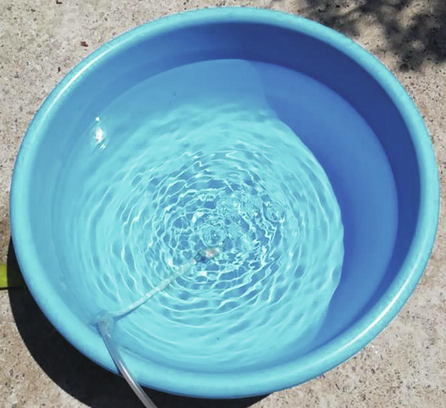
- A comparative evaporation reduction method in which water was recirculated by means of a pump.
2.1 Evaporation reduction methods
The four identical containers were placed on a flat roof to expose them to the factors of weather that contribute to evaporation. They were each initially filled to 25% of their capacity (with an equal quantity of water), and daily evaporation was recorded with an evaporimeter.
For water aeration, a small air pump with 2 W of power was connected to a plastic hose, which was fixed to the inside wall and bottom of the container (Fig. 2). The end of the hose, fitted with a non-return valve, created an air plume in the center of the container. The pump was turned on for 4 h per day during the period of greatest sunlight, established in accordance with the weather conditions predicted by the Weather Channel (TWC, 2020).
For water recirculation, a pump with 2.5 W of power was introduced into the water and directed towards the center of the container (Fig. 3). No splashing effect was produced by the submerged pump, which was turned on for 4 h per day under the same conditions as for the water aeration pump.
2.2 Determination of meteorological variables and rainfall
According to previous reports, the variables most closely related to water evaporation are wind direction and speed, air temperature, relative humidity, atmospheric pressure, solar irradiance, and precipitation. Therefore, the values of these variables were recorded (except for wind direction and wind gusts) on an hourly basis at first (averaged to afford daily data) and later on a daily basis. Information on the meteorological variables was taken from measurements at the Ecoguardas meteorological station in the Mexico City. Precipitation was recorded at the UNAM Hydrological Observatory in Mexico City (IIUNAM, 2020).
2.3 Principal component analysis (PCA)
PCA is a statistical technique for synthesizing information or reducing the size of the field (the number of variables). When faced with a data set containing multiple variables, the objective is to decrease the number of variables while minimizing the loss of information (Terrádez, 2000; Navarro et al., 2010).
The most important aspect of PCA is the interpretation of the components or factors that are relevant. Such interpretation is deduced after observing the relationship of the factors to the change in the initial variables.
2.4 Genetic algorithms
Genetic algorithms are optimization tools of evolutionary computation (Holland, 1975; Goldberg, 1989; Reed et al., 2000; Estévez, 1997; Kuri, 2000). In their simple version, they randomly generate a population of n individuals that comprise the search variables. The individuals of the population are evaluated through an objective function, which presently consisted of minimizing the mean squared error between the calculated values (
The input data are the measured values of the variables, including the evaporation of each container (the independent variable) and the climatological parameters (the dependent variables, either determined on site or at a nearby meteorological station). The genetic algorithms were carried out with 200 individuals and 10,000 generations.
2.5 Genetic programming
Genetic programming is a variant (subclass) of genetic algorithms (Koza, 1992; Koza and Poli, 2005; Whigham and Crapper, 2001; Guven and Gunal, 2008; Bamshad et al., 2015). The genetic programming algorithm (Cramer, 1985; Koza, 1989; Banzhaf et al., 1998; Arganis et al., 2015) is inspired by Darwin's theory of natural selection, where the best individuals of each generation survive, and the rest disappear. It traditionally begins by randomly forming an initial population of N individuals, which in this case are mathematical models with a set of functions and variables related to meteorological conditions.
In genetic programming, as in the case of other genetic algorithms (Goldberg, 1989), each individual is tested with an objective function to analyze its performance. The best individuals are selected with random methods, such as the roulette wheel, stochastic Universal, or tournament method. The selected individuals are subsequently recombined with the crossover operation and mutated to produce a new population of N individuals, representing the next generation (González and Mar 2013).
3 Results and discussion
3.1 Evaporation reduction afforded by the three methods evaluated
The depth of evaporation was calculated daily for each container as the difference between the initial and final water level (taking the amount of rainfall into account). The results of the four containers were compared. Based on PCA, it was decided to include all the presently recorded meteorological variables as relevant factors in evaporation.
After 83 days of evaluating the evaporation of water in the four containers, the total water evaporation was determined for each one. The total natural evaporation was established as that which occurred in the control container. The technique involving PET bottles to cover the water surface diminished the total natural evaporation by 38.61% (139 mm). The decrease in the total natural evaporation was 7.22% (26 mm) and 2.22% (8 mm) for the water aeration and water recirculation methods, respectively. In addition to the substantial savings that the PET bottle technique could generate by reducing water evaporation in reservoirs, it would also offer a constructive use of PET containers. Currently, Mexico ranks fourth in the world in the production of disposable PET containers, only after China, the United States, and the entire European Union. Furthermore, Mexico dumps 750 million empty PET containers into the ocean each year (INECC, 2020; SEMARNAT, 2021).
3.2 Numerical models
The variables utilized in the equations are evaporation (
3.2.1 Model 1. Daily data for container 1
The trend of values was established with Excel by employing a second-degree polynomial function for daily evaporation values from days 1–138 (Eq. (2)) and a fourth-degree polynomial function for values from days 139–197 (Eq. (3)).
The rules of correspondence were as follows:
3.2.2 Model 1: Daily data for container 2
The trend of the values was established with Excel by using a second-degree polynomial function for daily evaporation values from days 1–138 (Eq. (4)) and a fourth-degree polynomial function for daily values from days 139–197 (Eq. (5)).
The rules of correspondence were as follows:
3.3 Without any evaporation reduction method (container 1, control)
3.3.1 Principal component analysis (PCA)
For container 1 (the control), evaporation itself explains 43.88% of the phenomenon of evaporation, air temperature 19.25%, relative humidity 14.83%, solar irradiance 13.06%, wind speed 5.24%, and atmospheric pressure only 3.74% (Fig. 4).
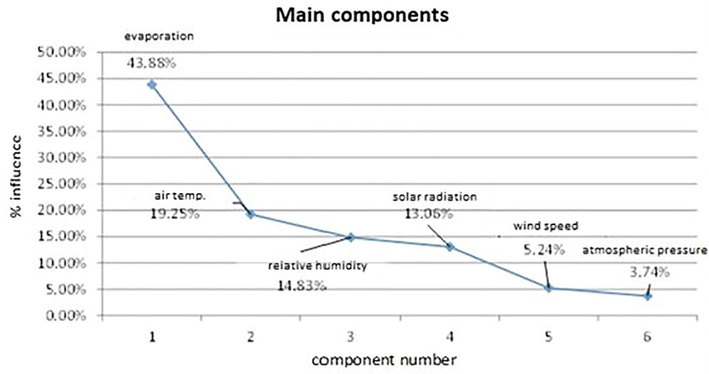
- Participation of the meteorological factors in the phenomenon of evaporation for container 1 during the dry season.
3.3.2 Genetic algorithms
The processing of data from the dry and rainy seasons with genetic algorithms afforded an equation (Eq. (6)) for estimating evaporation:
The inclusion of a random number improved the correlation coefficient of the calculated versus measured values. The variation between the measured values (during dry season) and those calculated with genetic algorithms was plotted.
3.3.3 Genetic programming
The evaporation values corresponding to container 1 during dry season were fed into genetic programming software (Matlab), resulting in Eq. (7):
Table 1 shows the calculated evaporation values for container 1 corresponding to the first month of the dry season. To determine the error, these values were compared to the real data found with an evaporimeter. For this container, there was a smaller variation between the measured and calculated values when utilizing genetic programming versus genetic algorithms.
| Date | t1 GP calculated evaporation | Error | |
|---|---|---|---|
| 1 | 08-nov | 0.6515 | −0.6516 |
| 2 | 09-nov | 1.7552 | 14.2448 |
| 3 | 10-nov | 0.9818 | 2.0182 |
| 4 | 11-nov | 2.0023 | 1.9977 |
| 5 | 12-nov | −0.5524 | 5.5524 |
| 6 | 13-nov | − 231 | 8.1231 |
| 7 | 14-nov | 1.5509 | 0.8325 |
| 8 | 15-nov | −3.1614 | −23.8386 |
| 9 | 16-nov | 1.5509 | 0.4491 |
| 10 | 17-nov | 2.5952 | 4.4047 |
| 11 | 18-nov | −0.6166 | 3.6231 |
| 12 | 19-nov | −1.2058 | 4.2058 |
| 13 | 20-nov | 1.1349 | 2.8651 |
| 14 | 21-nov | −0.2180 | −18.7820 |
| 15 | 22-nov | 3.8984 | 3.1016 |
| 16 | 23-nov | 0.5000 | 3.5000 |
| 17 | 24-nov | 4.2190 | −2.2190 |
| 18 | 25-nov | 4.2190 | −0.2190 |
| 19 | 26-nov | 1.0987 | 1.9013 |
| 20 | 27-nov | −0.5795 | −19.4205 |
| 21 | 28-nov | −0.5795 | 5.8978 |
| 22 | 29-nov | −0.5182 | 4.5182 |
| 23 | 30-nov | −2.1629 | 9.1629 |
| 24 | 01-dic | 2.3390 | −4.3390 |
| 25 | 02-dic | −0.9778 | 5.9778 |
| 26 | 03-dic | −0.0978 | −3.9014 |
| 27 | 04-dic | −0.6260 | 8.6260 |
| 28 | 05-dic | 0.9678 | 7.0322 |
| 29 | 06-dic | −1.7005 | 5.7005 |
| 30 | 07-dic | 0.3950 | 1.6050 |
The measured and calculated values were fit to a trend function (Fig. 5), which is described by an equation. Since the latter is the best fit for the data, it can provide estimates of future values through extrapolations. The Matlab program furnished a graph that represents the best result of data processing with genetic programming. The plot of the graph changes as a greater number of operators are considered. The value obtained by the iterations was 173.8107.
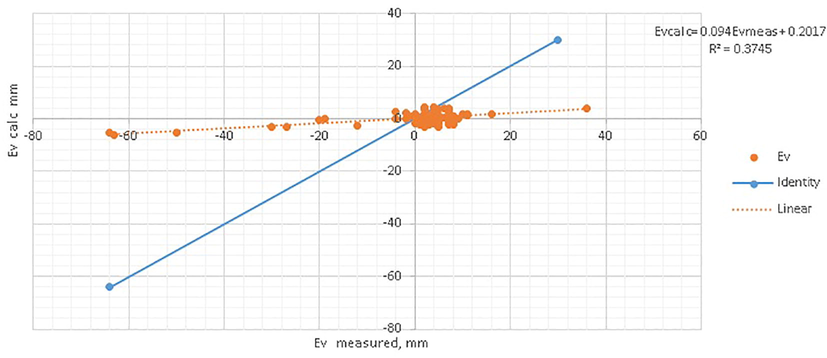
- The measured and calculated evaporation data (container 1, dry season) was fit to a trend function. The equation for the function is provided.
3.4 Evaporation reduction with PET bottles (container 2)
3.4.1 Principal component analysis (PCA)
For container 2, evaporation itself accounts for 47.2% of the phenomenon of evaporation, precipitation 15.54%, air temperature 14.25%, relative humidity 10.65%, solar irradiance 7.75%, wind speed 3.65%, and atmospheric pressure only 0.94% (Fig. 6).
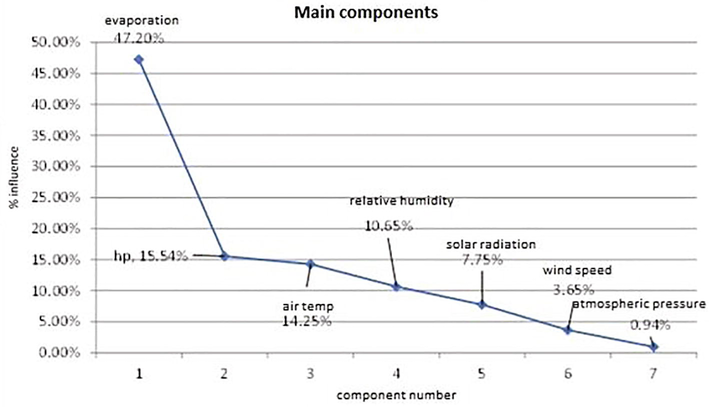
- Participation of the meteorological factors in the phenomenon of evaporation for container 2 during the dry season.
3.4.2 Genetic algorithms
The processing of data from the dry and rainy seasons with genetic algorithms afforded an equation for estimating evaporation (Eq. (8)):
The inclusion of a random number improved the correlation coefficient of the calculated versus measured values. The values calculated with genetic algorithms and the measured data (during the dry season) were plotted with the Matlab program to illustrate the variation of the best result. The value obtained was 74.0183.
3.5 Evaporation reduction based on water aeration (container 3)
3.5.1 Principal component analysis (PCA)
For container 3, evaporation itself explains 43.29% of the phenomenon of evaporation, air temperature 17.35%, relative humidity 16.26%, solar irradiance 15.07%, wind speed 4.91%, and atmospheric pressure only 3.13. % (Fig. 7).
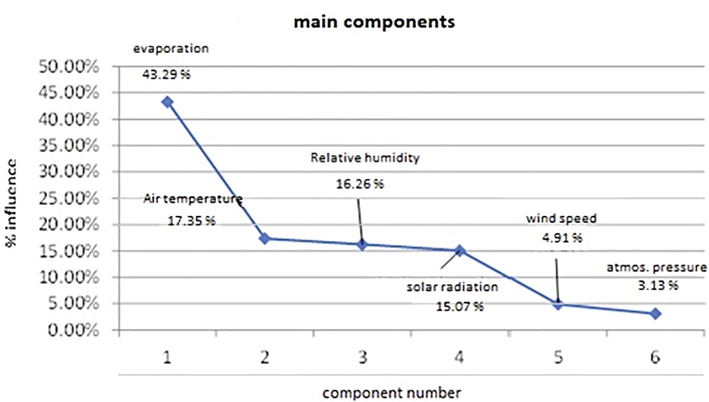
- Participation of the meteorological factors in the phenomenon of evaporation for container 3 during the dry season.
3.5.2 Genetic algorithms
Evaporation values from the dry and rainy seasons were processed with genetic algorithms, providing Eq. (9):
The inclusion of a random number improved the correlation coefficient of the calculated versus measured values. The values calculated with genetic algorithms and the measured data (during the dry season) were plotted with the Matlab program to depict the variation of the best result. The value generated by the iterations was 156.9684.
3.6 Evaporation reduction based on water recirculation (container 4)
3.6.1 Principal component analysis (PCA)
For container 4, evaporation itself accounts for 43.19% of the phenomenon of evaporation, air temperature 17.67%, relative humidity 16.35%, solar irradiance 14.77%, wind speed 4.9%, and atmospheric pressure only 3.12% (Fig. 8).
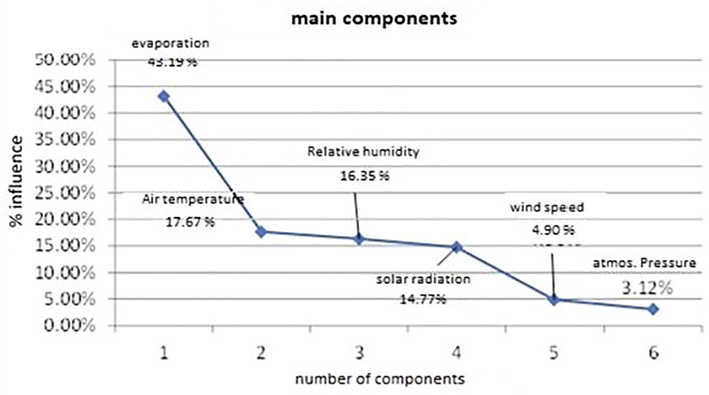
- Participation of the meteorological factors in the phenomenon of evaporation for container 4 during the dry season.
3.6.2 Genetic algorithms
Evaporation values from the dry and rainy seasons were processed with genetic algorithms, providing Eq. (10):
The inclusion of a random number improved the correlation coefficient of the calculated versus measured values. The values calculated with genetic algorithms and the measured data (during the dry season) were plotted with the Matlab program to illustrate the variation of the best result. The value produced by the iterations was 164.0895.
3.7 Summary of the most accurate models for estimating evaporation in each container
To discover which models most accurately estimate evaporation, the daily data for each container was fed into the models based on genetic programming and genetic algorithms. The error of the calculated versus measured values was expressed as the correlation coefficient (R2) for each model applied to a given container. Although the value of R2 for container 1 (the control) was not high when utilizing genetic programming, it was 142 times greater than that obtained by the mathematical model based on a genetic algorithm (Eq. (1)). For container 2 (with the pet bottle technique), the value of R2 afforded by a genetic algorithm was 1479 times greater than that found with Solver (Eqs. (6) and (10)). Hence, it was decided to use the genetic algorithm for the two remaining containers. The value for container 3 was good (0.5932, Eq. (9)), and that for container 4 was very low (0.0277, Eq. (10)).
3.8 Extrapolation of the results
To extrapolate the current results to the conditions of a real reservoir, a reduction factor must be applied to the evaporation values herein measured by the evaporimeter. In future research, it is important to use a physical model with hydraulic similarity or even a prototype in order to assess evaporation reduction methods under conditions closer to reality.
4 Conclusions
The highest reduction in natural evaporation was achieved by covering the greater part of the water surface with PET bottles, finding 38.61% less evaporation than the control. This result was over 7 and 17 times better than the water aeration and the water recirculation methods, respectively. Additionally, the use of PET plastic bottles is a low-cost technique that involves only a few cleaning maneuvers to prevent the proliferation of unwanted aquatic fauna. Thus, it represents a practical and economical solution to the current necessity of environmental protection by conserving water in reservoirs.
The mathematical models for estimating evaporation were applied to each container. For natural evaporation without intervention (container 1), the highest coefficient of determination (0.1139) was obtained with genetic programming. For the PET bottle technique (container 2), the value of the coefficient of determination closest to 1 (0.7393) was generated by a genetic algorithm. The highest coefficients of determination found for containers 3 and 4 were also provided by genetic algorithms. They were 0.5932 and 0.0277 (respectively), neither of which was very close to 1.
Acknowledgements
We are grateful to the DGPA, UNAM (within the PAPIIT IN105820 project), for the support provided during this study. We thank Bruce Allan Larsen for his kind review of the manuscript.
Funding
This work was supported by the DGPA, UNAM within the PAPIIT IN105820 project.
Conflict of interests
The authors declare that they have no conflict of interests in the materials or methods used in the study or in the writing of the manuscript.
References
- Evaporation suppression and energy balance of water reservoirs covered with self-assembling floating elements. Hydrol. Earth Syst. Sci.. 2018;22:4015-4032.
- [CrossRef] [Google Scholar]
- Aparicio, F.J., 1992. Fundamentos de hidrología de superficie. Reimpresión 1992 ed. Limusa S.A. de C.V, Mexico.
- Aranda, C., 1998. Procesos del ciclo hidrologico. Tercera reimpresión ed. Editorial Universitaria Potosina, México.
- Daily rainfall interpolation models obtained by means of genetic programming. Rev. Fac. Ing. Univ. Antioquia. 2015;75:189-201.
- [CrossRef] [Google Scholar]
- Evaporation suppression from water reservoirs: efficiency considerations of partial covers. Water Resour. Res.. 2011;47:717-727.
- [CrossRef] [Google Scholar]
- System identification using genetic programming for electro-hydraulic actuator. J. Automat. Control Eng.. 2015;3(6):457-462.
- [Google Scholar]
- Genetic Programming: An Introduction: On the Automatic. Evolution of Computer Programs and Its Applications (1st ed.). San Francisco California, USA: Morgan Kaufmann; 1998.
- BBC Mundo, 2015. Retrieved from ¿Por qué cubrieron un embalse de Los Ángeles con millones de pelotas negras?: https://www.bbc.com/mundo/noticias/2015/08/150804_eeuu_ciencia_agua_los_angeles_pelotas_goma_jg (consultado en mayo de 2020).
- Bursztyn, I., 1966. The Weizmann Institute of Science, Rehovoth, Israel. Julio 1966.
- Conagua Estadísticas del agua en México. Ciudad de México, México.: Secretaría de Medio Ambiente y Recursos Naturales. Retrieved from Acciones y Programas 2018 Consultado el 01 de diciembre de 2021.
- Energy relationships in the design of floating covers for evaporation reduction. Water Resour. Res.. 1970;6(3):717-727.
- [CrossRef] [Google Scholar]
- A representation for the adaptive generation of simple sequential programs. In: Proceedings of the 1st Int. Conf. on Genetic Algorithms and the Applications. 1985. p. :183-187.
- [Google Scholar]
- Estación Meteorólogica Automatizada, Ecoguardas. 2020. Observando el tiempo. Retrieved from Estaciones meteorologicas. https://smn.conagua.gob.mx/es/observando-el-tiempo/estaciones-meteorologicas-automaticas-emas-s.
- Genetic Algorithms in Search, Optimization and Machine Learning (1st ed.). Reading, USA: Addison Wesley; 1989.
- Reduction of evaporation of natural water samples by monomolecular films. J. Braz, Chem. Soc.. 2005;16(6a):1186-1190.
- [Google Scholar]
- Genetic programming approach for prediction of local scour downstream of hydraulic structures. J. Irrigation Drainage Eng.. 2008;134(2):241-249.
- [Google Scholar]
- Evaporation reduction from lake Naser using new environmentally safe techniques. In: Eleventh International Water Technology Conference, IWTC11. Sharm El-Sheikh, Egypt. 2007.
- [Google Scholar]
- Aerial roots of orchids: the velamen radicum as a porous material for efficient imbibition of water. Appl. Phys. A. 2020;126(885):1-17.
- [CrossRef] [Google Scholar]
- Artificial destratification for reducing reservoir water evaporation: Is it effective? Lakes Reservoris. 2018;23(4):333-350.
- [Google Scholar]
- Enhancing reservoir management through the use of mechanical evaporation reduction techniques. In: 1–10 2009 SSEE International Conference – Solutions for a Sustainable Planet. Society for Sustainability & Environmental Engineering, Melbourne, Victoria, Australia. 2009. p. :22-24. https://www.researchgate.net/publication/317662243_Enhancing_reservoir_management_through_the_use_of_mechanical_evaporation_reduction_techniques
- [Google Scholar]
- Adaptation in Natural and Artificial Systems. Ann Arbor, Michigan: University of Michigan Press; 1975.
- INECC Instituto Nacional de Ecología Y Cambio Climático. 2020. Secretaría de Medio Ambiente y Recursos Naturales. Panorama general de las tecnologías del reciclaje de plásticos en México y el mundo. https://www.gob.mx/inecc. (consultado en diciembre de 2021).
- IIUNAM. Instituto de Ingeniería de la UNAM., 2020. [Conjunto de datos].Retrieved from Observatorio Hidrológico del Instituto de Ingeniería de la UNAM. Datos_IIUNAM. https://www.oh-iiunam.mx/index.html.
- Hierarchical genetic algorithms operating on populations of computer programs. In: Proceedings of the 11th Int. Joint Conf. on Artificial Intelligence. 1989. p. :768-774. http://www.genetic-programming.com/jkpdf/ijcai1989.pdf
- [Google Scholar]
- Genetic Programming. Cambridge, MA: MIT Press; 1992.
- Genetic programming. In: Burke E., Kendall G., eds. Introductory Tutorials in Optimization, Decision Support and Search Methodology. Kluwer Press; 2005. p. :127-164. Chapter 5
- [Google Scholar]
- Genetic Algorithms. Computer research center; 2000. https://www.researchgate.net/publication/277598251_The_Best_Genetic_Algorithm_I_A_Comparative_Study_of_Structurally_Different_Genetic_Algorithms
- Evaporation suppression from small reservoirs using floating covers—field study and modeling. Water Resour. Res.. 2021;1–16
- [CrossRef] [Google Scholar]
- Evaporation from Reservoir and Reduction Methods: An Overview and Assessment Study. Domascus, Syria and Medinah, Kingdom of Saudi Arabia: International Engineering Convention; 2009. May 11-18, 2009. https://www.researchgate.net/publication/279983251_Evaporation_from_reservoir_and_reduction_methods_An_overview_and_assessment_study
- Navarro, J., Casas, G., González, E. 2010. Principal Component and regression analysis for categorical data. Application to arterial hypertension. Math magazine 2010. “Marta Abreu” Central University. La Habana, Cuba. https://kerwa.ucr.ac.cr/handle/10669/12979.
- Designing a competent simple genetic algorithm for search and optimization. Water Resour. Res.. 2000;36(2000):3757-3761.
- [CrossRef] [Google Scholar]
- Science is News, La ciencia es noticia, Chile, 2015. Un millon de bolas contra la sequía. SINC. https://www.agenciasinc.es/Reportajes/Un-millon-de-bolas-negras-contra-la-sequia (consultado en abril de 2020).
- Informe del medio ambiente. Gobierno de México. México: Residuos Sólidos Urbanos; 2021. (consultado en diciembre de 2021)
- Use of palm fronds as shaded cover for evaporation reduction to improve water storage efficiency. J. King Saud Univ.. 2013;25(1):55-58.
- [CrossRef] [Google Scholar]
- Experimental analysis of water evaporation losses in cooling towers using filters. Appl. Therm. Eng.. 2020;175:1-10.
- [CrossRef] [Google Scholar]
- An experimental and numerical study of evaporation reduction in a salt-gradient solar pond using floating discs. Solar Energy J. Elsevier. 2017;142:204-214.
- [Google Scholar]
- Análisis de componentes principales. Barcelona, España: Universidad Abierta de Catalunya; 2000.
- TWC, 2020. The Weather Channel Web site .https://weather.com/es-ES/tiempo/hoy/l/SPXX0050:1:SP.
- Modelling rainfall-runoff using genetic programming. Math. Comput. Model.. 2001;33:707-721.
- [CrossRef] [Google Scholar]


