

Translate this page into:
Evaluation of near-surface groundwater aquifers through integrated geophysical and geodetic measurements
⁎Corresponding author. ali.radwan@nriag.sci.eg (Ali M. Radwan)
-
Received: ,
Accepted: ,
This article was originally published by Elsevier and was migrated to Scientific Scholar after the change of Publisher.
Peer review under responsibility of King Saud University.
Abstract
Extensive geophysical and geodetic measurements were carried out to evaluate the groundwater aquifer, trace the basement relief, as well as detect the igneous intrusions and structural elements (mainly faults) that affect the occurrence of groundwater in the study area. The fieldwork included resistivity sounding, a geomagnetic survey, and Global Positioning System measurements. The magnetic results showed the presence of a group of main faults in East-west trend at the western part of the area and major fault at the northern part of the area of NW-SW trend. The findings also showed the presence of two igneous rock intrusions located in the middle of the eastern part of the valley. Pronounced differences in the depths of basement rocks have been identified, ranging between 0 and 900 m from the surface. Both high horizontal movements and high shear strain rates have been found to be concentrated at the southeast of the study area and it was noted that high stress was accumulated along the main observed faults and at the main groundwater aquifers. The geoelectrical results confirmed the presence of two aquifers; a shallow aquifer (Quaternary aquifer) that narrows northwards and a Nubian sandstone aquifer, which considered the main aquifer. The Nubian sandstone aquifer carries groundwater in the region, which overlies the last geoelectric unit represented by the basement complex layer and geological structures affecting the potential availability of groundwater in the study area, as proved by the geomagnetic survey and stress accumulation.
Keywords
GPS
Stress
Strain
Geomagnetic
Geoelectric
Groundwater

1 Introduction
Study area expands southwards for approximately 170 km from the South Galala Plateau to its wide fanning delta situated on the Nile Valley plain east of the town of Qena. Wadi Qena narrows from a width of 30 km to under 5 km. It features numerous ridges and high porches with their longer axes parallel to the main course. These highlights address a few phases in the down-cutting of the wadi.
The area focused on in this study lies in the southern part of Wadi Qena between latitudes 26°00′ and 27°30′N and longitudes 32°20′ and 33°10′E (Fig. 1). We extended the study area to the area surrounding Wadi Qena to enable us to use the Global Positioning System (GPS) to study the deformation stress affecting the region including Wadi Qena (Fig. 4A).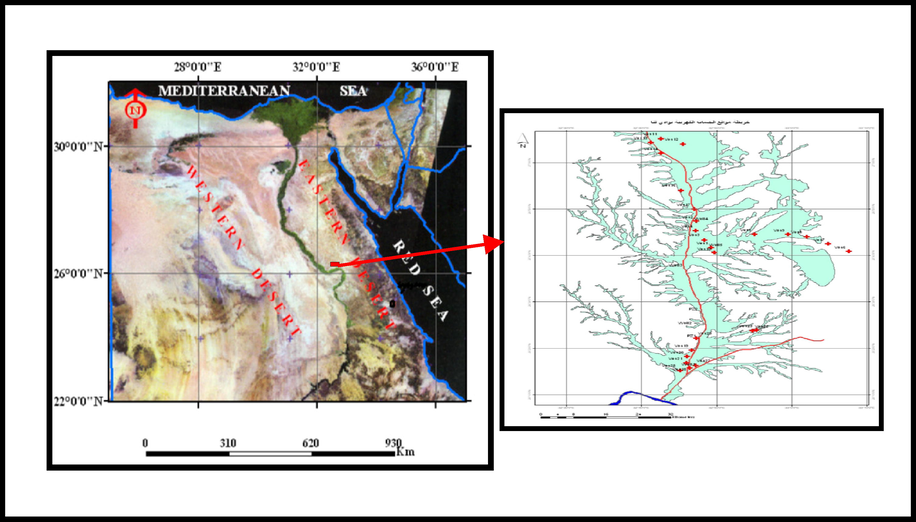
Map of the study area.
The interaction between the surface water of the Nile and the adjacent groundwater aquifers is an important issue to be examined, as well as the contribution of geological structures to the continuous recharging of the aquifers (Hussien et al., 2017; Mohammed et al., 2016). In the west of Wadi Qena it was shown that the NW–SE faults serve as recharge conduits by connecting the shallow aquifer with the deeper ones (Gaber et al., 2020).
Crustal deformation produces these geological structures and their dynamicity, while also initiating seismicity. Egypt is considered to be a region with moderate seismic activity, in which successive moderate seismic events occur. The majority of its earthquakes occur in the north of the country and the study area is suffering from low activity (Fig. 4c). Seismic hazard and risk assessment are very important to be studied in Egypt (Jena et al., 2020).
A geodetic program of eight stations was introduced in the center of the Nile Valley covering the region from Assuit in the north to Qena in the south (Fig. 4A). However, it is important to compute the stress accumulation along the observed faults using other geophysical tools such as a geomagnetic survey in order to determine whether such stress affects the recharging of the groundwater aquifers. Geomagnetic measurement is a key approach for determining structural faults. Intense magnetic studies can reveal the presence of structural faults, their size, their direction, the amount of their throw and the extent of their impact on the area and depth of groundwater aquifers. Electric resistivity measurements were also performed, applying the (VES) technique, which measures the variation in resistivity with depth. The geoelectric resistivity method combined with suitable geological information is the only approach that can accurately reflect the hydrogeological conditions and the groundwater availability.
2 Geological setting
Geologically, the whole of Middle Egypt including the Wadi Qena region comprises a sedimentary level of Eocene age, featuring a low relief topography with a general tendency towards the west course (Said, 1990). The elevation of the plateau reaches 300 m above sea level, which, on its eastern side, exhibits a sharp scarp facing the Nile Valley.
The study area is a part of the Nile Valley in Qena region and follows the Nile’s tectonic, geological, and hydrogeological setting. The Nile Valley cuts its course through the Early Eocene limestone rocks and divides Egypt into the Eastern Desert and the Western Desert. Many authors consider the valley of tectonic origin (Ibrahim et al., 2019; Abdalla and Moubark, 2018).
The principal tectonic patterns that affect Middle Egypt are a NW–SE fault tendency, corresponding to the Red Sea–Gulf of Suez, and N–S and NE–SW trends. The NW–SE fault system appears to affect the construction of Middle Egypt from the north of the Luxor–Qena twist toward the north of Assuit (Bakheit, 1989; Youssef et al., 1994). Said (1981) revealed that the Nile Valley lies along a seismo-active belt. Several geophysical examinations were performed near Qena and Assuit to reproduce the subsurface structures (e.g., El-Gamili, 1964; Senosy, 1997; El-Kottob, 2003). It was found that essentially the same surface fault trends also affect the basement of Middle Egypt. Moreover, the basement generally includes a high regional structure (dome) complicated by wedge faults. The sedimentary successions section unconformable overlying the crystalline basement has variable thickness between 500 and 3000 m (Fig. 2).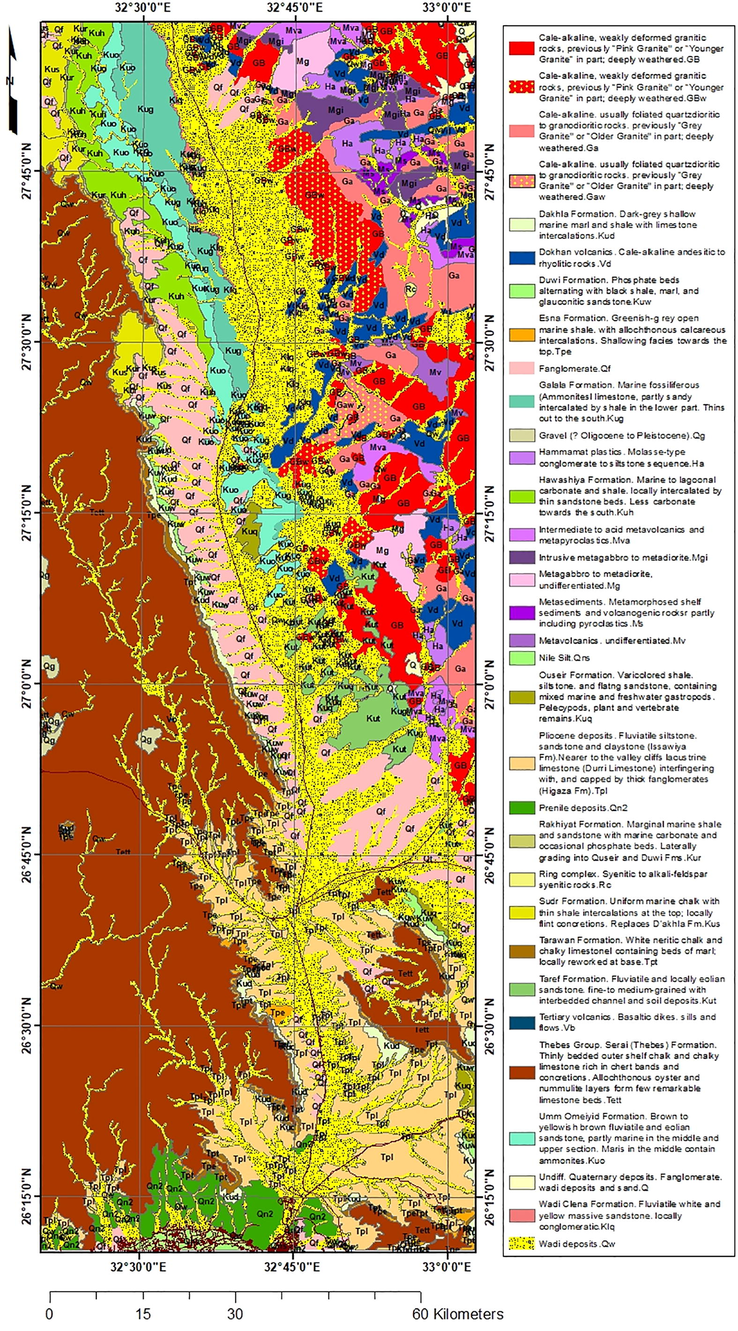
Geological map and the structures in the study area (Conoco, 198)).
The Qena bend area was shown to be affected by the N55°–N65°E trend as a shear and surface fracture trend, which was probably related to the Late Jurassic N75°E paleostress and later reactivated as a transform fault related to the Red Sea floor spread (Othman 2000). The origin of the Qena bends is anticline folds whose axes extend NE–SW (Hume 1910). Many authors have studied this area, such as Philobbos et al. (2000), Omran et al. (2001) and El-Younsy et al. (2010). These faults show N–S, NNW–SSE, NNE–SSW, and NE–SW trends. The most pronounced trend is NW–SE (Elewa and Ghallab, 2000).
3 Data acquisition
3.1 GPS observations
After the perceptible earthquake on 14 December 1998, the National Research Institute of Astronomy and Geophysics (NRIAG) started a geodetic installation program involving eight stations covering the region from Assuit to Qena to examine recent crustal deformation (Fig. 4A). The initial GPS measurements were performed in April 2000 and were repeated in September 2001 and January 2003. The surveying was carried out using Trimble 4000 SSI receivers. Most of the baselines were determined with accuracy of about 0.1 ppm and baseline length between 50 and 200 km. GPS measurements were performed with an elevation angle of 10° and the sampling interval was always 30 s.
3.2 Geomagnetic measurements
600 magnetic stations were performed using two G856 proton magnetometers. Measurements were performed with a station separation not exceed 500 m (Fig. 6), followed by a detailed survey of 252 stations with a separation 100 m.
3.3 Geoelectric measurements
DC resistivity survey was carried out in that area. 73 (VESes) were measured and arranged along 11 profiles using an instrument Syscal R2 in the hole area. In the present work, thirty on (31) sounding points were chosen for constructing a distributed three cross sections along their profiles (Fig. 3). The (AB/2) was usually increased in steps from 1 m to 1000 m.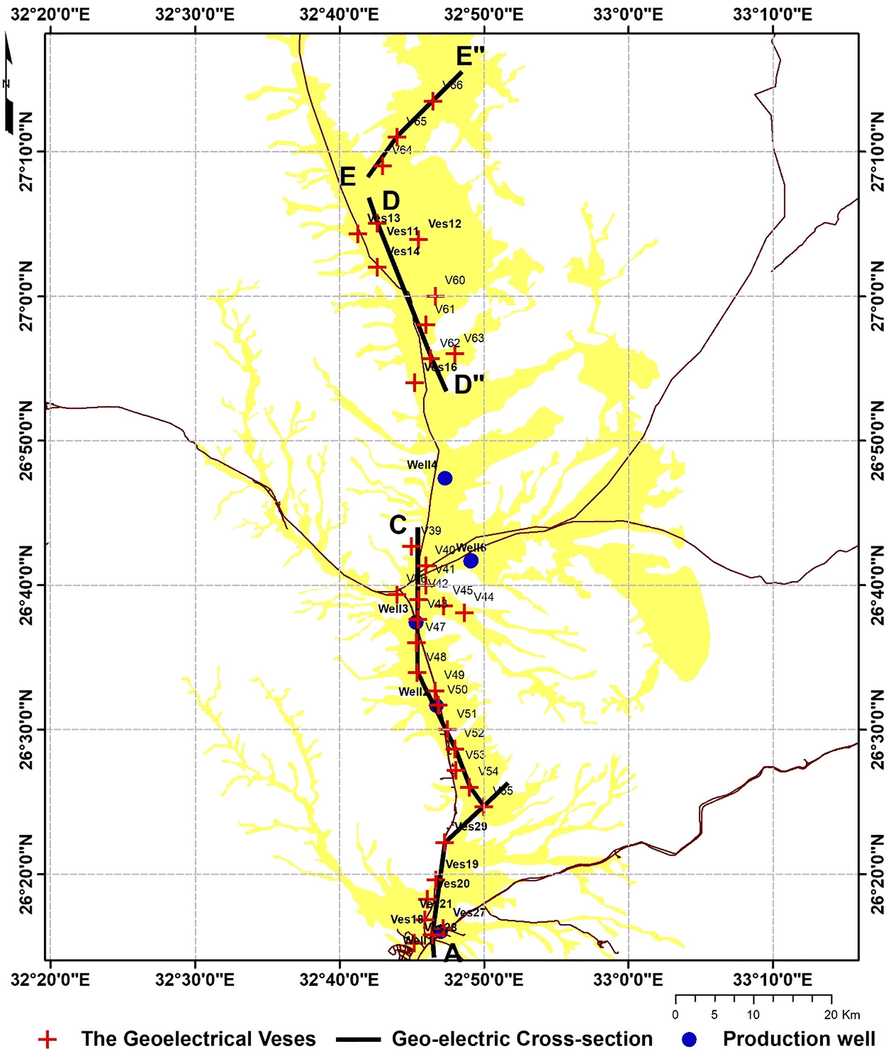
Locations of the geoelectrical profiles and the vertical electrical soundings.
4 Data processing and interpretation
4.1 GPS results
4.1.1 Horizontal displacement
Analyses and adjustments were performed using Geomatic and GPS survey 2.3 software packages (Trimble, 1997), as well as deformation programs. IGS precise ephemerides were collected from international data at the same time as the measurements. These data were applied for calculation of the baselines. The horizontal components of the displacement vectors with 95% confidence error ellipses are presented in Fig. 4B. Here, the error ellipses indicate the standard error in all directions around the observed site. Analysis of the data showed that the magnitudes of movements had an inhomogeneous distribution and quite large movements tending to the west in the southern part of the area were detected. Small-magnitude movements in the northern and eastern parts of the study area were also registered. East–west movements of relatively large magnitudes were recognized throughout the southern part of the network, including Wadi Qena area, especially at points 2–5. Meanwhile, there was no unique trend in the other sectors.
4.1.2 Deformation parameters
From the obtained results, the area can preliminarily be separated into two zones: the southern part where the compression strain is predominant and the northern part with an extension strain. Arial compressional and extensional strains reached about −0.11 and +0.03 ppm/yr, respectively. The rate of maximum shear strain was about 0.01–0.14 ppm/yr. This increased to the south and decreased to the north. The distribution of the principal axes of strains shows a contraction in nearly east–west and northeast–southwest directions in the southwestern part of the study area. The extension occurred predominantly in the eastern part of the area in nearly east–west and northwest–southeast directions. The compressional strains increase in the southern part of the studied area and decrease towards to the north (Fig. 5).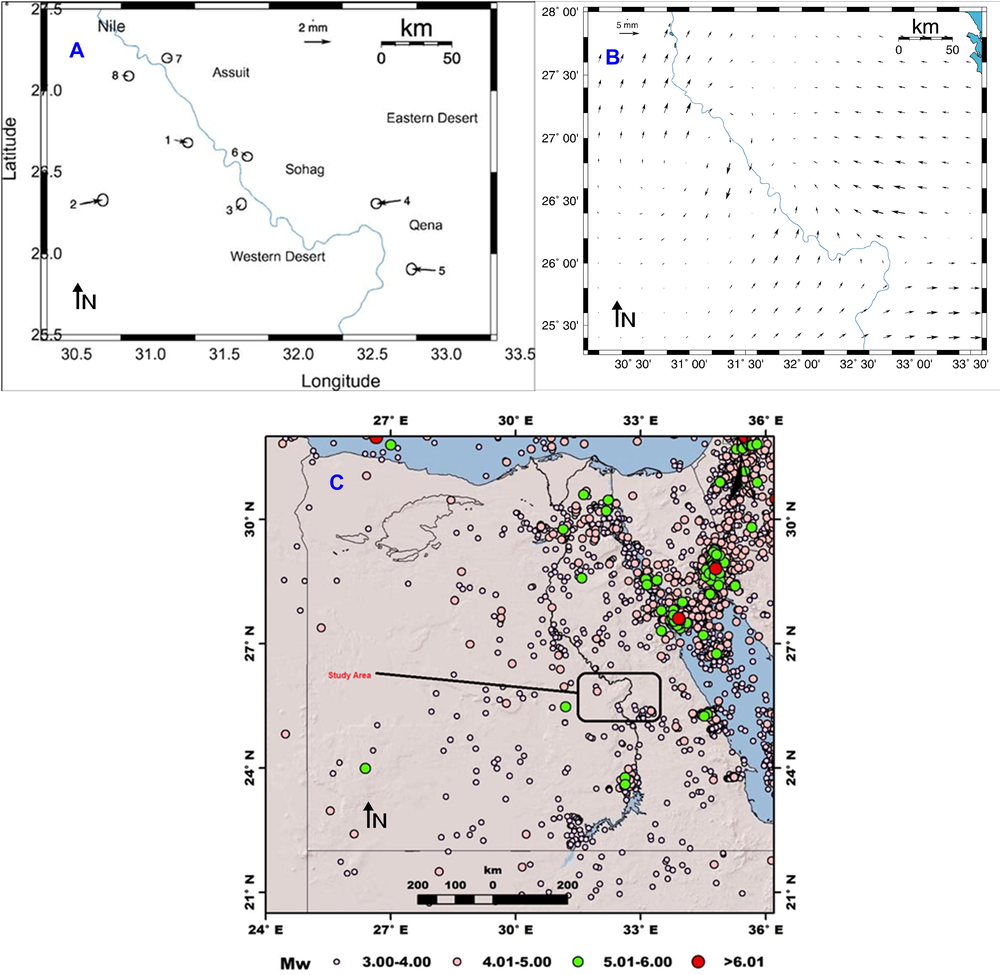
A) Rate of horizontal displacement vectors for the period from April 2000 to January 2003. B) The horizontal displacement vectors in grid points for the period from April 2000 to January 2003. C) Instrumental Earthquakes Catalogue 1900–2018 (Mohamed Ezzelarab et al., 2021).
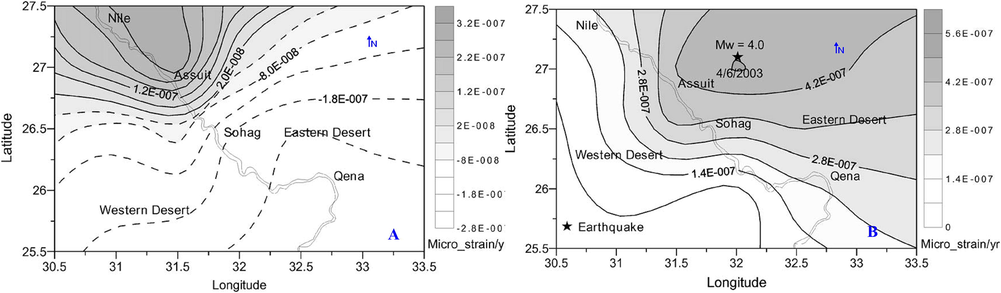
A) Distribution of the dilatation strain rates for the period from April 2000 to January 2003. B) Distribution of the maximum shear strain rates for the period from April 2000 to January 2003.
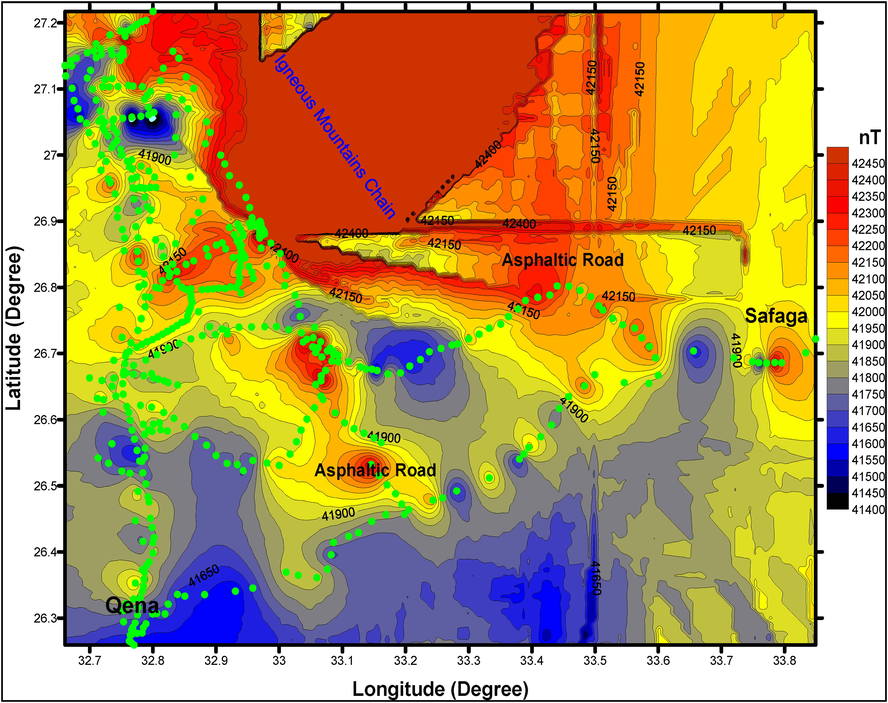
The total magnetic field with the measured magnetic stations in the study area.
4.2 Geomagnetic results
The +ve values results from high-altitude basement rocks [up thrown]. On the other hand, the magnetic field of −ve values results from low-altitude basement rocks [down thrown]. Dipole anomalies result from igneous intrusion and large areas covered by −ve magnetic field represents deep sedimentary basins. The large areas covered by a +ve magnetic field represents shallow sedimentary basins.
The map in Fig. 7 shows the presence of a group of major faults in the valley with an E-W at the southern part of the valley and with a SW-NE in the northern part. It also shows the presence of two igneous intrusions located in the middle eastern part of the valley.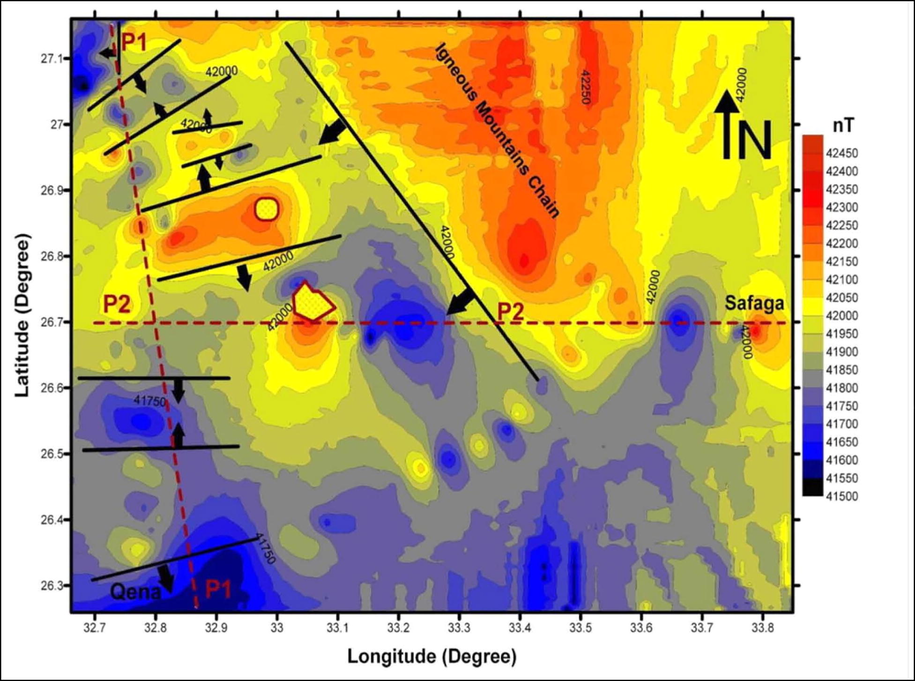
The magnetic field and the locations of subsurface structures (faults) of study area.
4.2.1 Sedimentary Sub-Basins
The presence and extension of the sedimentary sub-basins in Wadi Qena, were determined by the geological structures that were previously explained, noting that each graben between the two faults is one of the sub-basins. Here, the large areas covered by a −ve magnetic field (blue color) are considered to represent deep sedimentary basins. Meanwhile, the large areas covered by a +ve magnetic field (yellow color) represent shallow sedimentary basins.
Based on the above, a group of sub-basins in Wadi Qena were identified as a result of the influence of compositional factors and igneous interactions as follows: A-B-C-D-E-F. Here, sub-basin A is the deepest basin for the basement rocks, that is the thickest basin in terms of sedimentary rock (Fig. 8). This thickness decreases to reach the minimum thickness in the two sub-basins E and F.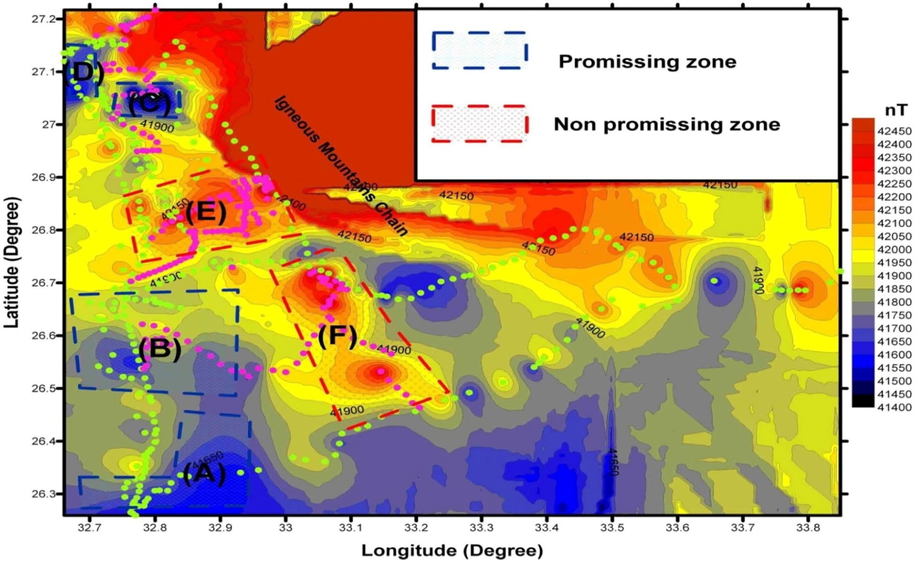
A map showing sedimentary sub-basins and their arrangement in the area.
4.2.2 Depth to basement
The 2D direct modeling algorithm was applied to calculate the depth to basement rocks along the magnetic profiles extending from south to north.
The thickness of the sedimentary cover reaches its maximum value (900 m) in the south of the valley. On the other hand, the thickness of the sedimentary cover decreases to the north until it reaches zero in the northeast of the valley, the aquifer is completely absent the level of the basement rocks rises to form the Red Sea mountains east of the valley (Fig. 9).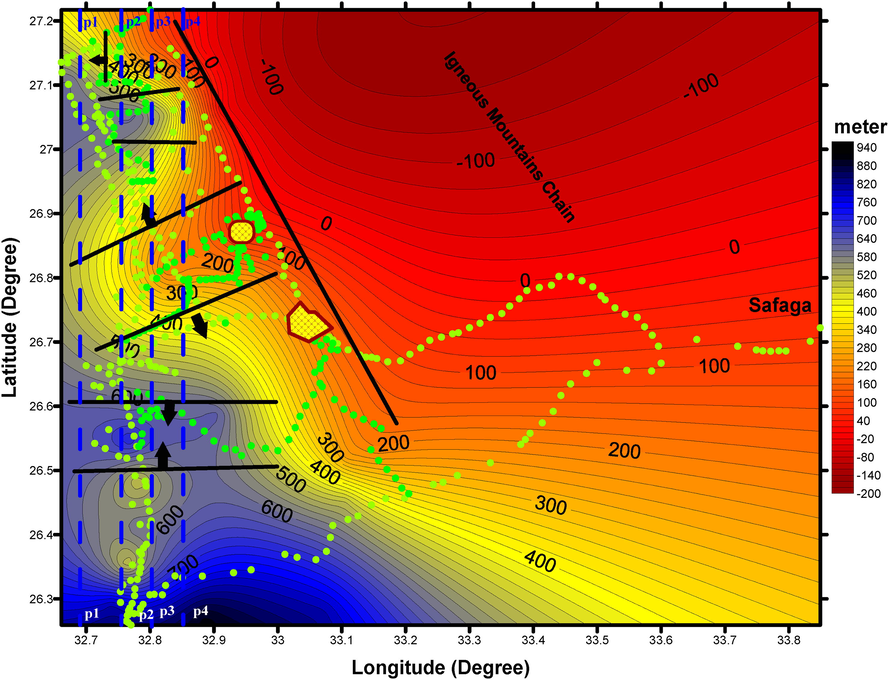
A contour map of the depths to the basement rocks in the study area with the faults, igneous intrusions, and four profiles.
4.3 Geoelectric results
For the DC resistivity data, quantitative interpretation was performed to obtain the true resistivity and thickness of subsurface layers using IPI2win software (Bobachev et al. 2008).
The geoelectric sequences (layers) were inferred from the deep geoelectric VESs, as well as identified groundwater wells, are all shown in the geoelectrical cross sections along the wadi to clarify the groundwater position, thickness, and extension of the water-bearing formation.
4.3.1 Geoelectric cross sections
Three geoelectric cross sections (Fig. 10) calibrated with the lithological and hydrogeological data that deduced from the available drilled wells in the area of study give a good picture of the subsurface conditions in the study area.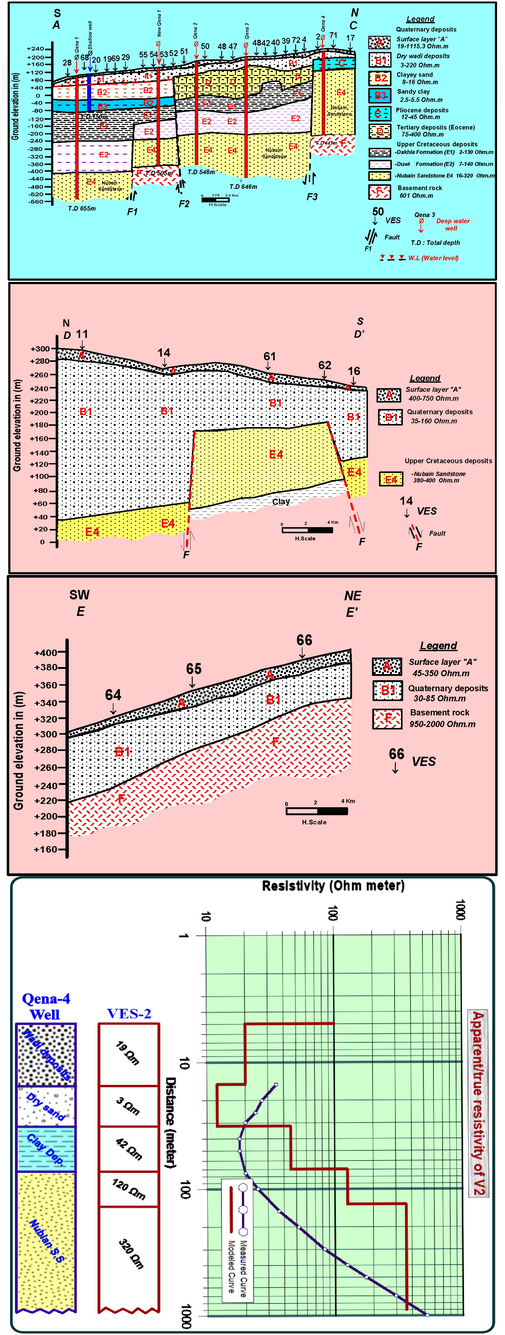
Geoelectric cross sections along profiles AC, DD′ and EE′, and an example of resistivity curves of DCR soundings of VES-2 calibrated to the lithology of Qena-4 well.
It was possible to deduce the subsurface geoelectric sequence of the study area, which was grouped together into six units of varying thickness and resistivity due to rock formation, its compaction, and its water content as follows:
-
-
The first layer (A) consists of loosened soil of sand, gravel, and mud, representing modern sediments.
-
-
The second layer (B) consists of different valley sediments of sand, gravel, mud, and sandy clay deposits. This layer can be subdivided into B1, B2, and B3. B1 represents the dry modern valley deposits, while B2 is considered as the shallow aquifer in the area consisting of sand and sandy clay deposits. As for B3, it consists of muddy sediments.
-
-
The third layer (C) is composed of sand, clay and marl. It directly covers the Nubian sandstone rocks at the location of well No. 4 and VES No. 73.
-
-
The fourth layer (D) consists of sand, clay and limestone.
-
-
The fifth layer (E) belongs to the Upper Cretaceous period and is composed of four units [unit E1, unit E2, unit E3, and Nubian sandstone layer E4], which are interspersed with thin layers of clay, and this is the main aquifer carrying groundwater in the region.
-
-
The two units E1 and E2 cover the Nubian Sandstone Formation in the southern part of the study area. Where, E1, which consists of shale and marl with interferences of limestone. Its thickness increases in the south and southeast as a result of the presence of faults F1 and F2 with a throw towards the south. While, the unit E3 is absent in the southern part of the study area. This formation overlies the Nubian sandstone (E4) at Well No. 6 and is close to VES No. 71. The Nubian Sandstone (E4) is located at the bottom of the units E1 and E2 at Well 2 and VES No. 50, and Well No. 1 and VES No. 21, respectively, in the southern part of Wadi Qena. The greatest thickness of unit E4 is expected to be found between faults F2 and F3 at well 2 and VESs No. 50 and No. 73 and next to well No. 6 as the basement rocks have a great depth there. The Nubian sandstone unit is the last range in sedimentary rocks, and it is the main deep aquifer in the study area with a resistivity ranging from 16 to 320 Ohm·m.
The sixth unit F (last geoelectric unit) is a unit of basement rock that has relatively high resistivity. This unit is found at a depth ranging between 443 m at Well No. 4 and VES No. 71 and 505 m at new well No. 1 and VES No. 53, as well as a depth greater than 655 m at Well No. 1 and VES No. 21 in the south, as shown in geoelectric sections A–C. In addition, Fig. 10 presents an example of calibartion mode of DCR sounding No.2 with the lithological data in Qena-4 well. This calibration reveals a good matching of the interpreted geoelectric layers of the neighbored borehole.
5 Discussion and conclusion
From field assessments of strain from various GPS campaigns, Middle Egypt including the Wadi Qena region has experienced variable tensions and compressions over time. The chief strains found in all of these campaigns demonstrate extensions in the NE–SW direction and compression in the NW–SE direction. The style and course of the geodetic deformations are consistent with seismic deformation (i.e., earthquakes’ focal mechanisms) in Middle Egypt. The estimated magnitudes and the inferred local deformation field agree with the regional stress pattern, where the dominating stresses are the result of both shortening due to NW convergence between African and Eurasian plates and extension due to the opening of the Red Sea.
The magnetic results of this study can be summarized as follows. There are widely differences in the depths of igneous rock, ranging between 0 and 900 m (b.g.l.). In addition, the sedimentary cover peaks in the south and southeast of the valley with a thickness of about 900 m, while it decreases in the east and northeast due to the appearance of igneous intrusion. Moreover, determining two promising regions for drilling productive wells in which the thickness of the sedimentary sequence increases in them. The magnetic results show the presence of a group of main faults in the valley towards the east–west striker and that south of the valley and toward the southwest–northeast stand in the northern part of the valley.
The geoelectric results of the deep VESes revealed the subsurface geological structures affecting the hydrogeological conditions in the area of study and showed that the geoelectric sequence consists of six units as mentioned above. The most important unit (E4), which is the main aquifer carrying groundwater in the region, consists of fine to coarse sand layers, showing differences in both horizontal and vertical orientations. On the other hand, the geoelectrical results confirmed that there are two aquifers: the (Quaternary aquifer) and the Nubian sandstone aquifer, which considered the main aquifer at the study area.
Acknowledgments
Deep thanks and gratitude to the Researchers Supporting Project number (RSP-2021/351), King Saud University, Riyadh, Saudi Arabia for funding this research article.
Declaration of Competing Interest
The authors declare that they have no known competing financial interests or personal relationships that could have appeared to influence the work reported in this paper.
References
- Assessment of well performance criteria and aquifer characteristics using step-drawdown tests and hydrogeochemical data, west of Qena area, Egypt. J. Afr. Earth Sci.. 2018;138:336-347.
- [Google Scholar]
- Geological and geophysical studies on the areas around wadi El-Assuity, Eastern Desert. Egypt: Assuit University; 1989. PhD thesis
- IPI2Win V2.0: user’s Guide. Moscow: Moscow State University; 2008.
- Conoco 1987. Geologic map of Egypt. Egyptian General Authority for Petroleum (UNESCO Joint Map Project), 20 Sheets, Scale 1500 000. Cairo.
- Elewa, A.A., Ghallab, M.H. 2000. Water-sediment interaction in front of ElRahawy drain, Rosetta branch, River Nile, Egypt. In: Presented at 4th international symposium on sediment quality assessment. Otsu, Japan. October, 24–27.
- Geological and geophysical studies on wadi El-Assuity area, Eastern Desert, Egypt. Egypt: Assuit University; 1964. MSc thesis
- Geophysical study around the epicenter of earthquake of 1 May 1999. Sohag, Western Desert, Egypt. Al-Mansoura University; 2003. p. :200. MSc thesis
- Structural characteristics and tectonic evolution of the area around the Qena bend, Middle Egypt. In: The sixth International Conference on the Geology of Africa IV. 2010. p. :23.
- [Google Scholar]
- Mapping the groundwater potentiality of West Qena Area, Egypt, Using integrated remote sensing and hydro-geophysical techniques. Remote Sens.. 2020;12(10):1559.
- [CrossRef] [Google Scholar]
- Structural depocenters control the Nubian sandstone aquifer, Southwestern Desert, Egypt: inferences from aeromagnetic data. Arab. J. Geosci.. 2019;12:335.
- [Google Scholar]
- Seismic hazard and risk assessment: a review of state-of-the-art traditional and GIS models. Arab J Geosci. 2020;13:50.
- [CrossRef] [Google Scholar]
- An integrated approach for identification of potential aquifer zones in structurally controlled terrain: Wadi Qena basin, Egypt. CATENA. 2017;149:73-85.
- [CrossRef] [Google Scholar]
- Factors affecting the stable isotopes ratios in groundwater impacted by intense agricultural practices: a case study from the Nile Valley of Egypt. Sci. Total Environ.. 2016;573:707-715.
- [CrossRef] [Google Scholar]
- Integration of local soil effect into the Assessment of Seismic Hazard at the Kharga Oasis, Western Desert, Egypt. Sci. Afr. 2021
- [CrossRef] [Google Scholar]
- Subsurface structures and sedimentary basins in the Nile Valley area as interpreted from gravity data, Egypt. J. Geol.. 2001;45:48-75.
- [Google Scholar]
- Othman, A.B. 2000. Geological interpretation of gravity data along the nile Valley and adjacent areas, Egypt. PhD thesis., Geo. Dept, Ass, U. Egypt 218, 224.
- Stages of fracture development controlling the evolution of the Nile Valley in Egypt. Egypt. J. Geol.. 2000;44:503-532.
- [Google Scholar]
- The Geological Evolution of the River Nile. New York: Springer-Verlag; 1981. p. :151.
- The Geology of Egypt. Rotterdam, Brookfield: A. A Balkema; 1990.
- Verification of the Qena-Assuit sedimentary basin by gravity data. Egypt. J. Geol.. 1997;41:797-816.
- [Google Scholar]
- GPSURVEY Software’s User Manual. Sunnyvale, USA: Trimble Navigation Limited; 1997.
- Surface and subsurface tectonic pattern of Sohag region, middle Egypt. Boll. Fac. Sci. Assuit Univ.. 1994;23:317-360.
- [Google Scholar]


