

Translate this page into:
Evaluation of cost benefit analysis of municipal solid waste management systems
⁎Corresponding authors. afzalkhan2020@student.usm.my (Afzal Husain Khan), kafeeljmi@gmail.com (Afzal Husain Khan), pervezjmi@gmail.com (Pervez Alam),
-
Received: ,
Accepted: ,
This article was originally published by Elsevier and was migrated to Scientific Scholar after the change of Publisher.
Peer review under responsibility of King Saud University.
Abstract
The rate of municipal solid waste (MSW) generation in developing countries is continuously growing in proportion to the gross national product. Landfilling, incineration, composting, and waste to energy (WtE) have a brief history as management strategies for MSW in India. Economic evaluation via cost benefit analysis (CBA) of MSW is establishing the most appropriate treatment/disposal strategy and it is often a major concern for solid waste management (SWM) policymakers. Thus, this study aims to analyze the municipal solid waste management (MSWM) activities in India’s capital, Delhi, and the CBA of MSWM systems to identify the major problems and limitations involved. Sixty-six samples totaling 6,600 kg were collected and analyzed at random from various locations, including the sources of generation, composting plants, and disposal sites. Storage, collection, transportation, and recycling information were gathered from departments such as Municipal Corporation of Delhi (MCD), New Delhi Municipal Corporation (NDMC), Central Pollution Control Board (CPCB), and self-surveys. The total costs of each MSW option were calculated for cost analysis. The results revealed a high organic moisture content, indicating the possibility of composting and bio-methanation, except for waste from commercial, institutional area and restaurants that can be used to develop Refuse Derived Fuel (RDF). It was also revealed that only about 80% of the garbage generated in Delhi is collected. In terms of treatment and disposal, the MCD has proposed additional facilities such as disposal through sanitary landfills with linings, as well as a system for leachate collection and disposal. Furthermore, construction and demolition waste are used in the construction of various pavement components, such as base coarse, surface coarse, and so on. The total social value added by garbage trade operations in Delhi is expected to be INR 358.7 crores (approximately 46.60 million USD) between 2017 and 2020. Recycling saves the municipal budget about INR 17.6 crores (approximately 2.3 million USD per year).
Keywords
Composting
Disposal
Recycling
Refuse derived fuel
Waste-to-energy

1 Introduction
Better living standards, the movement of people from rural to urban areas for employment, and most importantly the rapid growth of population are some of the major reasons for the continuous increase in the MSW (Khan, 1994). In addition, poor collection and inadequate transport contribute to the accumulation of solid waste in every corner of Indian cities (Alam et al., 2021; Pervez et al., 2022). In most cities and towns in India, approximately 90% of MSW is directly disposed of in an unscientific manner. Unscientific disposal of solid waste is shown to directly affect human health and the environment (Wang and Nie 2001). Specifically, it creates environmental hazards in terms of health risks from flies and rats, pollution of water bodies through runoff and rainfall, pollution of groundwater from leachate, air pollution from burning of wastes, and aesthetics aspects as well (Mazhar et al., 2021). Furthermore, the growing waste is responsible for the increasing methane (CH4) emissions (44%) (Mohammed et al., 2021). Therefore, MSW management (MSWM) is a serious concern for municipalities in developing countries due to its high cost and challenging implementation (Khan et al., 2022). In addition, MSWM has become a political, legal, socio-cultural, and environmental challenge that requires economic considerations as well as resource availability (Alam et al., 2020).
Usually, these issues have complex relationships in the MSWM system (Camobreco et al., 1999). For example, expensive management systems tend to have a less negative impact on the environment than inexpensive management systems, which may not provide adequate environmental protection. Therefore, the estimation of the MSW budget in order to establish the most appropriate treatment/disposal strategy is often a major concern for SWM policymakers (Gupta et al., 1998). Generally, MSW budget is divided into three cost service categories, a) MSW collection, b) disposal, and c) recycling. The total cost of each MSWM alternative is the planning cost, construction cost, and operation and maintenance costs (Idris et al., 2004; Guo et al., 2001). In most developing countries, MSWM is an expensive service, accounting for 20–50% of municipal service operating budgets (Chatterjee, 2010). However, the organization and planning of MSW collection services in these countries is very basic, as evident from the ineffective reuse and recycling initiatives that result in unknown types and quantities of MSW collected, recovered, and recycled, as well as the incorrect selection of final disposal sites (Ahring, and Johansen, 1992). Consequently, MSWM in India, and especially in urban cities like Delhi, is going through a critical phase where the disposal and treatment services available are fewer than the generated amount of MSW.
Therefore, this study aims to analyze the MSWM activities in India’s capital, Delhi, and the CBA of MSWM systems to identify the major problems and limitations involved. The amount and composition of MSW generated in the last decade, and collection, storage, transfer, treatment, disposal, and recycling activities are also explored in detail. It is anticipated that doing so could potentially help in preparing some guidelines for improving the SWM system to meet future challenges.
2 Methodology
2.1 Study area and site description
Delhi lies in northern India, between 28° 24′ 17″ and 28° 53′ 00″ North latitude and 76° 50′ 24″ and 77° 20′ 37″ East longitude. The weather in Delhi is intense in general and temperatures vary between 40 and 45 °C during summer and 4 °C during the winter with an average rainfall of 784.5 mm (Economic Survey of India, 2011). According to India's 2012 census, the population density in Delhi is roughly 9,294 people per square kilometer. The New Delhi Municipal Council (NDMC), the Municipal Corporation of Delhi (MCD), and the Delhi Cantonment Board (DCB) make up the National Capital Territory (NCT) of Delhi. Among them, MCD has the greatest jurisdiction in the entire state of Delhi, and it is organized into 12 Zones for administrative and operational purposes, with 134 municipal wards, 168 corporation members, and 70 assembly constituencies. Households are the largest source of MSW generation, but many other sources, such as agricultural markets, retail and commercial markets, hospitals and nursing homes, industries, slaughterhouses, construction and demolition activities, street sweeping, and institutional areas, also generate significant amounts of MSW in Delhi. Three municipalities were contracted to collect and dispose of municipal garbage. In most states, MCD's Conservancy and Sanitation Engineering (CSE) department manages MSW with primary duties ranging from road cleaning, MSW collection, transfer and disposal, repair and maintenance of urban waste storage facilities, trash cans, transportation vehicles, mobile devices, and other systems. The NDMC provides public facilities to VIP areas such as Rastrapati Bhawan (President's Office), Prime Minister's Office, Parliament Building, Supreme Court, Connaught Place, and adjacent areas.
2.2 Sampling of MSW
MSW samples were collected and analyzed in consultation with MCD to determine its characteristics and to ascertain the extent of recycling. As shown in Table 1 total of 66 samples (approximately 6,600 kg) were randomly collected both at the sources of generation, composting plant, and disposal sites: 36 samples from 12 zones in MCD area (3 samples/zone). The sampling and analysis of MSW have been carried out as per standard procedure (Peavy et al., 1985; Edjabou et al., 2015). In India, MSWM is directed by the Municipal Solid Wastes (Management and Handling) Rules, 2000) that provide directions to municipalities for the collection, segregation, storage, transportation, processing and disposal of MSW (MoEF, 2000).
S. No
Sampling Zone
Number of MSW samples
1.
NDMC area
3
2.
DCB
3
3.
Dwaraka
3
4.
Vegetable markets
3
5.
Commercial areas
3
6.
Institutional areas
3
7.
Landfill sites (2 sample/each disposal site)
6
8.
Bhalswa composting plant (3 samples of waste entering Bhalswa compost plant and 3 samples of waste rejected from Bhalswa compost plant)
6
2.3 MSW characteristics
The dry density and moisture content of solid waste samples has been determined as per the standard procedure. Furthermore, secondary data of organic carbon, nitrogen as N, phosphorus as P2O2, potassium as K2O, C/N ratio, and calorific value information has been gathered from MCD department. All the characteristics of MSW have been carried out as recommended by (Solid Waste Management Rules, 2016).
2.3.1 Procedure for determination of density and moisture content
To determine the density of the samples, the raw waste was collected in a conventional type wheelbarrow of known weight (60 kg) and volume (70 × 50 × 50 cm = 0.175 m3). The wheelbarrow was filled completely in refuse then it is weighed on a weighbridge to determine the weight of MSW and the MSW density can be determined using the Eqn. (1).
To determine the moisture content of the MSW, a small sample (approximately 2 kg wet weight) have been taken to the laboratory and put in the oven for 24 h under the temperature of 77 °C then weighted again to get the dry weight. The moisture can be estimated by using the Eqn. (2).
3 MSW treatment and disposal
Delhi has been disposing of its MSW in four landfills namely Okhla (OL), Ghazipur (GL), Bhalswa (BL), and Narela Bawana (NL). Narela Bawana landfill site is provided with proper lining and a leachate collection system. Rest three landfills are simple dumps with no adequate liners or leachate collection systems. Fig. 1 gives the details of the existing landfill sites. Around 250 employees work at the four landfill sites under the supervision of junior engineers, who oversee operations at the landfill sites. The MSW is weighed at the landfill site and then dumped at the specific working space. The deposited MSW is thereafter spread by a single pass of the bulldozer and then covered by soil and silt. Daily soil cover over the waste is not always applied at the landfill sites. A total of 36 bulldozers work at the different landfill sites. Rag pickers carry out the recycling operations at the landfill sites. Animals like vultures, pigs, cows, and dogs are common on the sites.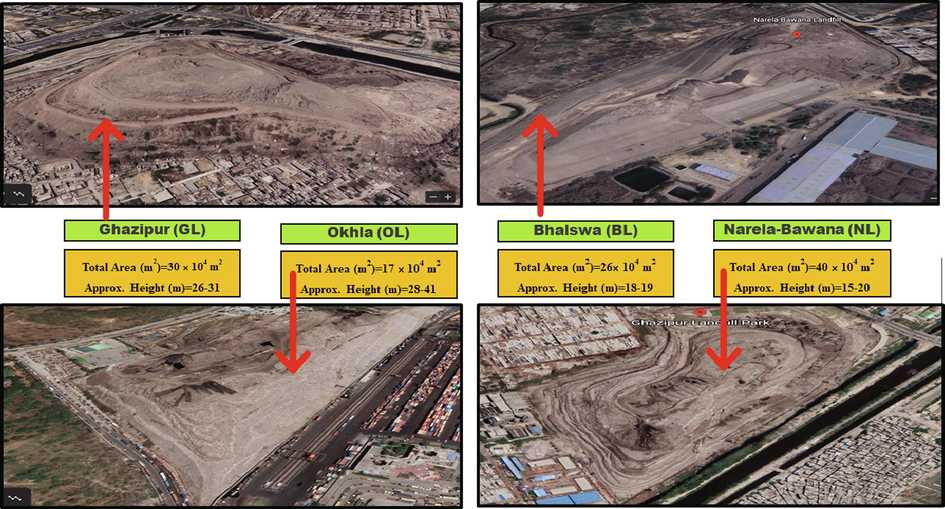
Ghazipur, Bhalswa Okhla, and Narela Bawana landfill sites in Delhi.
In addition, there are three WtE power plants, namely the Timarpur Okhla waste power plant. The Ghazipur Waste Power Plant and Narela Waste Power Plant in Delhi are also in operation. As shown in Table 2, the Timarpur Okhla WtE plant, the Ghazipur waste incinerator plant, and the Narela waste incinerator plant consume 1800, 1300, and 200 MTD of solid waste, respectively, and generating 16, 12, and 24 MW, respectively.
S. No.
Name
Plant Capacity (MTDa)
Electricity Generated (MWb)
Status
1.
Timarpur Okhla WtE power Plant
1800.0
16.0
Working
2.
Ghazipur WtE power Plant
1300.0
12.0
Working
3.
Narela WtE power Plant
2000.0
24.0
Working
4 Procedure for CBA of MSWM
The details about the storage, collection, transportation, and recycling of MSW in Delhi were collected locally and by conducting surveys as well as from departments like MCD, NDMC, CPCB. The CBA of MSWM in Delhi was done by calculating the full costs of each MSW option. This includes the annual salaries of the employers, annual costs for collection and transportation of MSW, the annual costs for general operations and maintenance (costs incurred for the purchase of capital goods and payment made for the sitting and construction of MSW facilities). The annual cost of depreciation of the purchase price of collection vehicles and other equipment (the land price is not depreciated). The annual indirect costs are the costs of support services or oversight provided to the MSWM by other departments or agencies of the local government. Any other costs that are not accounted for should also be added and the revenues (that local municipalities obtain from MSWM) which include interest income and revenue generated from the sale of recyclable materials, energy and salvaging of equipment. The revenue should be identified to calculate the net costs incurred by the local government for providing MSW services. The revenue was computed in INR and then converted to USD (one crore INR is equal to 0.13 million USD at the time of writing this article).
5 Results and discussion
To plan the most appropriate type of MSWM system, set a piece of reliable information on quantity, type, amount of reusable or recyclable material, and effective goals such as regulatory compliance, environmental protection, and valid local goals is essential. A business that uses raw materials, provides employment opportunities, and saves resources. The analysis and results obtained are described in the next section.
5.1 Composition of MSW in Delhi
After carrying out the analysis, the composition of MSW generated from different zones and areas of Delhi was computed and reported in Table 3. The results revealed the high organic content and the moisture content thus indicating the possibility for composting and bio-methanation, except for waste from commercial, hotels, and institutional areas which, can be used for RDF because this waste has low moisture content and low organic waste. The physical and chemical characteristics of MSW generated in Delhi are given in Table 4 (MCD, 2020). The waste in Delhi has 38.6 % biodegradable 5.6% paper metal 5.6% and glass and crockery 1%. Non-biodegradable waste which includes leather, rubber, bones, stones, bricks, ashes, etc. was found to be 48.6%. As far as chemical composition is concerned, the moisture, organic carbon, nitrogen (as N), phosphorus (as P2O2), potassium (as K2O), C/N ratio, and calorific value are 43.8, 20.5, 0.9, 0.3, 0.7, 24.1 and 713 kcal/kg respectively.
Samples Area
Physical Composition of MSW from Different Areas in Delhi
Biodegradablea
Paper and cardboard
Plastics
Metals
Glass and Ceramic
Othersb
Moisture %
Density kg/m3
Central zone
72.32
1.21
0.65
0.5
0.29
25.03
62
318
West zone
74.62
2.26
0.74
0.65
0.35
21.38
43
324
South zone
78.1
0.95
1.12
0.48
0.24
19.11
51
342
Karol Bagh zone
67.54
2.75
2
0.95
0.6
26.16
49
285
City zone
68.21
1.94
0.54
0.74
0.51
28.06
57
294
Sadar Paharganj zone
72.93
3.52
0.96
0.75
0.34
21.5
55
322
Shahdara (South) zone
71.21
2.54
1.25
1.1
0.26
23.64
61
305
Narela zone
71.34
0.95
1.03
0.9
0.41
25.37
47
298
Najafgarh zone
71.51
3.32
0.84
0.94
0.39
23
39
286
Shahdara (North) zone
60.25
3.98
0.42
0.84
0.57
33.94
45
269
Civil Lines zone
68.36
2.25
1.36
0.52
0.52
26.99
46
320
Rohini zone
78.32
1.7
0.75
0.35
0.28
18.6
65
395
NDMC Area
68.85
2.7
1.67
1.36
0.36
25.06
52
345
DCB Area
72.24
3.12
1.52
0.95
0.35
21.82
46
320
Dwaraka
71.26
2.65
1.38
1.05
0.51
23.15
41
316
Commercial Areas
51.31
5.4
1.99
1.16
0.84
39.29
27.5
207.67
Vegetable Markets
88.83
0.85
0.67
0.44
0.21
9
74
369
Institutional Areas
54.16
6.46
1.96
1.54
1.42
34.47
31.22
253.67
Hotels
47.43
6.41
1.72
1.8
1.17
41.46
34.25
261
Landfill sites
58.86
0.98
0.62
0.46
0.52
38.57
47.67
369
MSW entering compost plant
75.7
1.35
0.97
0.63
0.46
20.89
51
362.33
MSW rejected from compost plant
37.57
0.94
1.14
0.89
0.65
58.82
21.67
235
AVERAGE
67.31
2.65
1.15
0.86
0.51
27.51
47.56
308.94
STDEV
11.56
1.69
0.49
0.37
0.3
10.33
12.44
46.17
% Error at 95% confidence
4.83
0.71
0.2
0.15
0.13
4.32
5.2
19.29
Parameters
%
Physical composition
Non-biodegradable (rubber, leather, stones, bricks, ashes, etc.)
48.60
Paper
5.60
Plastic
6.0
Metal
0.20
Glass and crockery
1.0
Chemical composition
Moisture content
43.8
Organic carbon
20.5
Nitrogen as N
0.9
Phosphorus as P2O2
0.3
Potassium as K2O
0.7
C/N ratio
24.1
Calorific value
713 kcal/kg
5.2 Variation of MSW
The daily generation quantities of MSW in Delhi city vary as determined from the quantities received at the landfill sites (Fig. 2). In addition, the monthly quantities of MSW and its changes are shown in Table 5. Information on the daily/monthly/yearly MSW quantities received at landfills based on weighbridge data collected from MCD, NDMC and CPCB. According to the weighbridge data and features from 2016 to 2019, Delhi City alone creates approximately 8,810 tonnes of garbage every day. Approximately 6,554 tonnes (or 74.39% of total garbage generated) were collected from 2,400 secondary collection stations, however, 2,256 tonnes (or 23.5%) did not make it to the city stream. Scavengers may recycle this unaccounted garbage at various sites, or it may be left unmanaged during various stages of waste generation, collection, and transportation where services are not given in a proper manner. In Delhi, the per capita generation of solid waste is roughly around 0.5 kg per capita/day.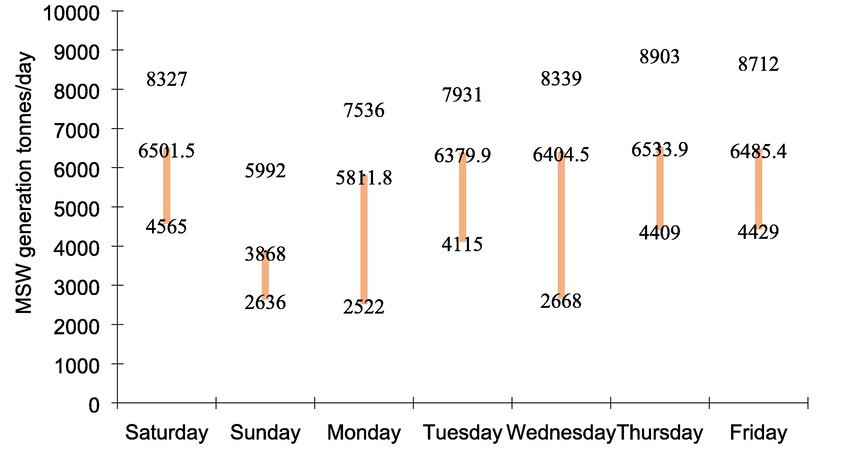
Daily variation of MSW generation during 2019.
Year
JAN
FEB
MAR
APR
MAY
JUNE
JULY
AUG
SEP
OCT
NOV
DEC
2016
184,321
216,543
223,875
221,940
231,986
229,812
237,823
270,813
216,042
229,013
219,042
272,190
2017
201,967
223,189
230,956
240,912
265,109
245,198
289,231
301,832
263,091
283,412
289,021
354,210
Increase/ decrease % (02–03)
8.7
2.9
3.06
3.70
2.6
6.2
17.7
10.2
17.88
19.19
24.2
23.15
2018
316,384
387,325
390,123
419,345
438,914
441,984
447,805
453,091
483,013
471,042
476,104
460,913
Increase/ decrease % (03–04)
29.8
32
47.7
85.1
132.8
109.8
80.9
7.8
−12.8
−7.5
−9.9
−2.5
2019
332,198
420,912
461,207
432,903
452,109
446,712
412,096
430,923
498,231
462,109
431,209
463,210
Increase/ decrease % (04–05)
11.4
4.2
−1.7
–23.2
−46.9
−50.3
−26.3
−3.3
0.4
−4.8
−9
−14.7
The annual MSW quantities generated from different zones in Delhi are shown in Table. 6 and Fig. 3 respectively. The result revealed that the maximum solid waste has been generated in 2019 in North Municipal Corporation followed by Delhi Municipal Corporation. The maximum percentage increase has been found in year 2018 in comparison to 2017. Source: Municipal Corporation of Delhi (MCD).
Municipal Corporations
MSW quantity during 2016 (tonne/year)
MSW quantity during 2017 (tonne/year)
Increase/
decrease (%)
MSW quantity during 2018 (tonne/year)
MSW quantity
during 2019
(tonne/year)
Increase/
decrease
(%)
North Delhi (ND)
4,02,827
5,98,366
32.68
6,32,011
6,50,923
2.91
Delhi Municipal Corporation (DMC)
4,55,029
4,62,709
1.66
5,29,712
5,49,013
3.52
South Delhi Municipal Corporation (SDMC)
3,20,461
3,88,986
17.62
4,16,723
4,30,971
3.31
North Delhi Municipal Corporation (NDMC)
2,98,360
3,08,831
3.39
3,38,931
3,89,123
12.90
East Delhi Municipal Corporation (EDMC)
2,15,242
2,79,267
22.93
3,01,765
3,29,871
8.52
Delhi Cantonment Board (DCB)
99,354
77,517
8.80
1,18,952
1,32,675
10.34
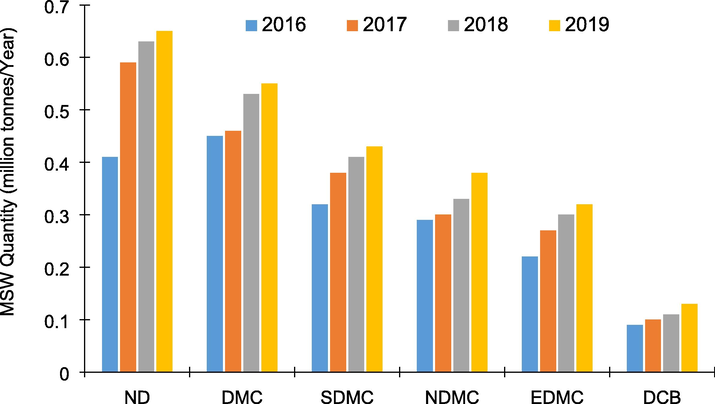
Estimated zone wise MSW generated in Delhi.
5.3 Storage and collection
As per the Delhi Municipal Corporation Act, it is the responsibility of the owners and occupants of residential houses to deposit waste in the receptacles provided by the municipality. MCD is entrusted with the collection of MSW from the receptacles and transporting it to disposal sites. MCD uses MSW receptacles of two types: Dhalaos (covered structures) and street dustbins of different designs and sizes. In addition, there are open sites in some localities, which are used for the dumping of MSW. The street sweeping and the collection of MSW from the receptacles are carried out by municipal workers. The standards adopted by MCD for street sweeping are shown in Table 7.
Categories of Areas
Standard for Sweeping (area in m2)
Congested areas
3,000
Roads more than 20 m wide
6,000
Rural areas
7,500
Roads less than 20 m wide
12,500
NDMC workers collect the waste from the households and commercial areas and bring it to the nearest waste receptacles. The collection equipment available includes 275 masonry dustbins (of 1–1.5 tonnes capacity), 400 non-moveable iron trolleys (0.5 tonne), and 16 garbage stations. The DCB has garbage collection points spread out in civil and military areas. These include 400 numbers of 1100 L bins. Street sweeping in the military area is carried out by the military, while sweeping in the civil areas is undertaken by DCB. The DCB has recently entrusted an NGO (Manorama Social Services Center) to provide door-to-door collection. However, municipalities do not collect and dispose of the total amount of MSW, and consequently, garbage collection efficiency in Delhi is often below 80%.
5.4 Transportation of MSW
MCD maintains a large fleet of vehicles for transporting MSW from various trash receptacles to disposal facilities as well as secondary collection. Refuse removal trucks (RRTs), loaders, mini dumpers, tractor-trailers, and buffalo carts are the most common vehicles utilized in rural areas. MSW is transported in a variety of ways, which are determined by the type of collecting points. MCD's MSW transportation system is in disarray; probably the lack of a sufficient number of loaders and collecting trucks is the primary reason for the poor status of MSWM in MCD. The waste is covered by jute fabric in the collection trucks, but most of the time the jute cloth is ripped and insufficiently long to entirely cover the garbage in the truck. As a result, waste is sometimes lost during transportation to the dump site. The respective bodies carry out the MSW collection and transportation, whereas MCD receives waste from NDMC and DCB at its disposal and treatment facilities (landfills and composting plants). MCD alone manages almost 95% of the total area of the city; it spends over Rs. 1000/tonnes of MSW and about 80–85 % of its budget is spent in the collection and transportation of waste.
5.5 MSW treatment and disposal
As discussed, Delhi has been dumping MSW at four landfills: Ghazipur, Okhla, Bhalswa, and Narela Bawana; these landfills are simple dumps with no liners or leachate collection systems (Table 8). The transport vehicles carrying the MSW are weighed at the landfill site and then dumped at the specific working space. The deposited MSW is thereafter spread by a single pass of the bulldozer and then covered by soil and silt. Daily soil covered over the waste is not applied always at the landfill sites (Ayub and Khan, 2014). At several dump sites, bulldozers are in use. At landfill sites, rag pickers do recycling activities. Vultures, cows, and dogs are frequent on the grounds. (MCD, 2020; NDMC, 2020, CPCB, 2020).
Name
Location
Area (hectares)
Starting year
Initial amount of MSW T/day
MSW received T/day
Bhalswa
Delhi (North)
26.0
1993
1200.0
3200.0
Ghazipur
Delhi (East)
30.0
1984
800.0
2100.0
Okhla
Delhi (South)
23.0
1994
400.0
1200.0
Narela-Bawana
North
40.0
2012
1687.0
1856.0
Source: (MCD, 2020).
There are three compost facilities for MSW treatment and processing: two in Okhla run by MCD and NDMC, and a privately-owned one in Bhalswa. MCD built a mechanical composting plant with a capacity of 150 tonnes per day in Okhla in 1980. However, due to the lack of markets in neighboring areas and the high operating costs of the plants, operations had to be shut down. In addition, as a joint venture with a private developer, MCD has built another composting plant at the Bhalswa landfill with a capacity of 500 tonnes per day. This plant is also not in full operation and currently produces 300 tonnes of compost per day. NDMC has also set up 200 tonnes composting plant per day in Okhla. The facility is not fully operational, and the compost produced is used for horticultural purposes in the NDMC operating area. Delhi also has the technology to incinerate municipal waste by constructing an incinerator with a capacity of 3.7 MW and a capacity of 300 tonnes per day in Timarpur in 1989 through the Ministry of Non-Conventional Energy Sources with Danish funding. However, due to the low calorific value of MSW, operations had to be stopped in a short period of time. There are also three waste incinerators in operation: the Timalpur Okhla waste incinerator, the Ghazipur waste incinerator, and the Narella waste incinerator in Delhi. It uses 1800, 1300, and 2000 MTD solid waste and produces 16, 12, and 24 MW of electricity, respectively.
The MCD has proposed additional facilities for the treatment and disposal of MSW (Fig. 4). These include disposal through sanitary landfills having liners, leachate collection, and treatment disposal systems. Currently, it is expected that these landfills will be developed (constructed, operated, maintained, and closed) by private agencies, with long-term post-closure care being possibly undertaken by the MCD. Further, treatment facilities are also being planned at Okhla in southern Delhi (RDF and Bio-Methanation), Ghazipur in eastern Delhi (RDF), Bakarwala in western Delhi (Bio-Methanation), and Narela Bawana in northern Delhi (RDF and Bio-Methanation).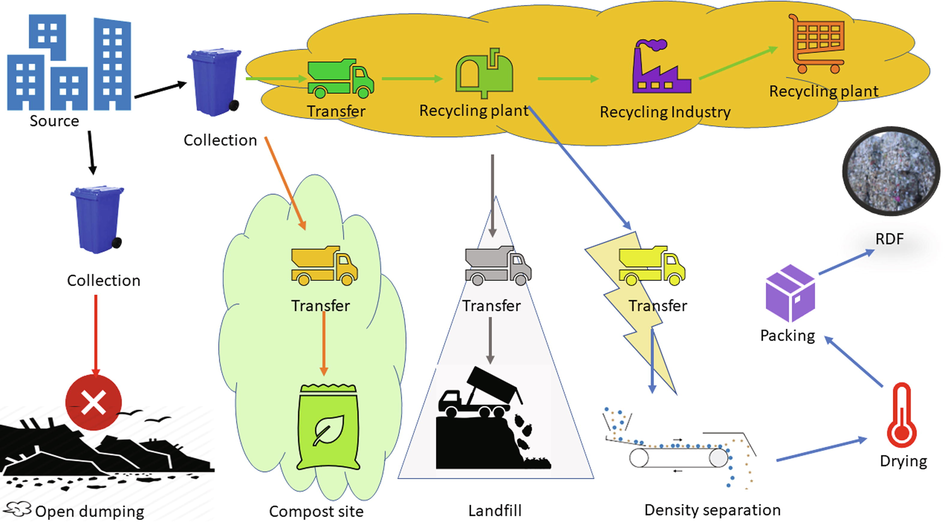
MCD proposed scheme with additional facilities for treatment and disposal of MSW.
5.6 Recycling and reuse of MSW
Recycling municipal waste is a widespread activity in Delhi, and an extensive network of informal and official stakeholders is involved in this process. Recycled waste includes materials of market resale value such as paper/cardboard, plastic, metal, glass, rubber, leather, and textiles (Pervez et al., 2021). Rag pickers collect recyclables from disposed waste also households sell recyclables to itinerant buyers who make instant payments for the items. The recyclable materials pass from the rag pickers or small waste dealers to wholesale buyers and from there it goes to market level dealers as shown in Fig. 5. End users of cleaned and sorted recyclables are recycling units or factories, which use these recyclables as raw materials for manufacturing a new product.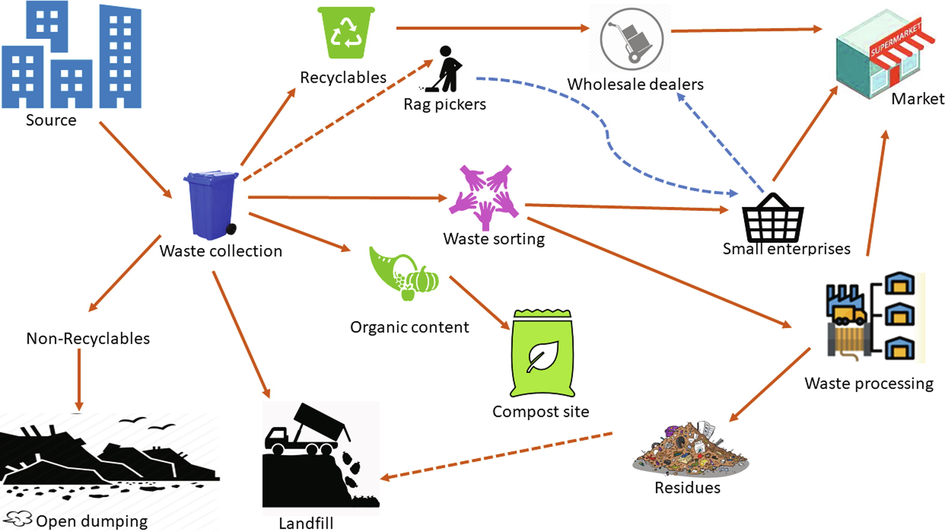
Flow diagram of MSW management and trade chain in Delhi.
The number of rag pickers in Delhi ranges from 80,000 to 100,000, each collecting approximately 15 kg of waste daily, reducing the processing and disposal burden by 1,200 to 1,500 tonnes per day. The estimated total number of shoppers traveling in Delhi is 17,587. Delhi's recycling units operate in both formal and informal departments and are spread throughout Delhi. Recycling is usually dirty and unsanitary. Solid waste often remains outside the recycling facility and causes air, soil, and groundwater pollution. Technologies are often old, and machines are rudimentary. Improper maintenance of the machine can lead to high power consumption. Manual sorting based on experience and know-how is a common method. Most areas with recycling facilities do not have sewage treatment or sanitation facilities. Table 9 shows that the total social value created through garbage trading operations in Delhi between 2017 and 2020 is anticipated to be Rs. 358.7 crores or approximately USD 46.60 million (MCD, 2012). The municipal budget saves roughly Rs. 17.6 crores or approximately USD 2.3 million per year due to recycling. However, the recycling sector's contribution to environmental conservation in terms of preserving virgin materials may be greater, albeit this is difficult to quantify.
Category
Rs. (Crores)
USD (Million)
%
A
Waste trader
178.9
23.2
49.9
Rag pickers
13.7
1.8
3.8
Itinerant buyers
61.5
8.0
17.1
Dealers
49.4
6.4
13.8
Wholesalers
54.3
7.1
15.2
B
Waste producers
162.2
21.1
45.2
Households
81.4
10.6
22.5
Business establishments
80.8
10.5
22.5
C
City administration (public cost saving)
17.6
2.3
4.9
Total (A + B + C)
358.7
104.6
100
5.7 Recycling of construction and demolition waste (CDW)
Construction and demolition waste accounts for about 10% of total waste dumped in landfills. Thus, it is necessary to reuse in different construction activities. CDW is large and bulky, making them unsuitable for composting or incineration. A waste management plan should be made to handle the CDW residues before the commencement of a construction project and control the quantity of material used in such projects, so when the building is demolished, no major consequences of the waste would appear.
Thus, by utilizing this waste, the amount of raw material utilized in the building is reduced, resulting in conservation. In general, 70% of CDW is used in the construction of different components of pavement. Such as base coarse, surface coarse, etc. In addition, energy costs associated with mining (quarrying), extraction, and transportation of aggregates would be reduced, in line with natural resource conservation and the creation of cost-effective pavements.
5.8 Cost analysis of MSWM in Delhi
The process involved in the cost analysis of MSWM in Delhi has been discussed in the methodology section. In order to know the best and optimal MSWM options, it is important to estimate both the total costs for each option (collection, transportation, operation, environmental, and construction costs) and the total benefits (incomes or revenues from different facilities) then by minimizing the net costs (total costs – benefits) the optimal SWM options can be determined (Abounajm and Elfadel, 2004). MSWM falls under Head no. 7 Conservancy, Street Cleansing (CSC) of MCD. During 2005–06 the total annual budget for CSE Department was Rs. 175 crores (22.7 USD million) and the expenditure on MSWM was Rs. 107/capita. Table 10 shows the current expenditure of MCD for MSWM, and the per capita expenditure on MSWM on the basis of a total population of 15 million in MCD’s area. Table 11 shows MCD revenues from MSWM. Street cleansing Removal of refuse Transportation Disposal of refuse Compost plant Source: (MCD, 2020). (-): Data not available. Source: (MCD, 2020)
Account
Revised budget estimate 2018–2019 (Lacs)
Revised budget estimate 2018–2019 Rs. per capita
Budget estimate 2020–2021 (Lacs)
A
Conservancy and street cleansing
36502.7
253.5
38123.7
35135.1
244
36431.2
505.5
3.5
675.6
752.8
5.2
830.7
25.1
0.2
42
84.3
0.6
144.4
B
Repairs and maintenance to buildings
0.5
0
0.5
C
Purchase of trucks, tempos and machinery
10
0.1
10
D
Improvement of conservancy services and sanitary landfills
200
1.4
1200
E
Purchase of wheelbarrows
2
0
2
F
Supervision and control
1886.1
13.1
1764.1
Total expenditure (A + B + C + D + E + F)
38601.2
268.1
41100.3
Account
Revised budget estimate 2018–2019
(Rs. Lacs)
Budget estimate 2020–2021
(Rs. Lacs)
Private removal charges
120
120
Other receipts (recycling etc.)
100
120
Sale of compost
–
–
Government contributions
–
–
Total revenue
220
240
6 Conclusion
After analyzing the composition of MSW generated in various zones and areas of Delhi, it was discovered that solid waste with high organic content and moisture content has the potential for composting and bio-methanation, except for waste from commercial, hotel, and institutional areas, which can be used for RDF due to its low moisture content and low organic waste. The study also concluded that Delhi has 38.6% biodegradable waste, 5.6% paper and metal waste, and 1% glass and crockery waste. As far as concerned with CBA aspects, that governs the appeal of a given SWM project in a profitable as well as sustainable manner. In this study, a CBA for setting up a recycling facility was successfully carried out. The analysis showed the viability of the project based on the five different scenarios tested in the sensitivity analysis.
Based on the results of the analysis, this study establishes that the strategy is profitable but could be efficiently improved by minimizing the load on dumpsites or landfill sites. In addition, the execution of waste segregation could further improve the socio-economic benefits of MSW management and contribute directly towards the sustainable development goal. Overall, such strategies not only directly benefit municipalities but also create more potential jobs from the facility. However, it should be noted that the participation of citizens, policymakers, strategic planners, researchers, and private and municipal agencies being crucial in handling MSWM challenges such as social, economic, and environmental impacts.
Acknowledgement
The authors would like to acknowledge the support provided by Researchers Supporting Project Number (RSP2022R424), King Saud University, Riyadh, Saudi Arabia.
Declaration of Competing Interest
The authors declare that they have no known competing financial interests or personal relationships that could have appeared to influence the work reported in this paper.
References
- Computer based interface for an integrated solid waste management optimization model. Environmental modeling & software. 2004;19(12):1151-1164.
- [CrossRef] [Google Scholar]
- Anaerobic digestion of source sorted household solid waste together with manure and organic industrial waste. Venice, Italy: 14–17 April; 1992. p. :203-208.
- Seasonal characterization of municipal solid waste in the city of Jammu, India. IOP Conf. Ser.: Mater. Sci. Eng.. 2021;1058(1):012061.
- [CrossRef] [Google Scholar]
- Alam, P., Sharholy, M., Ahmad, K., (2020). A Study on the Landfill Leachate and Its Impact on Groundwater Quality of Ghazipur Area, New Delhi, India. In: Kalamdhad A. (eds) Recent Developments in Waste Management. Lecture Notes in Civil Engineering, 57. Springer, Singapore. https://doi.org/10.1007/978-981-15-0990-2_27.
- Characterization and energy generation of Sharda landfill at Agra Int. J of Eng. Res. and App. SSN. 2014;2248–9622, 4:12-20.
- [Google Scholar]
- Life-Cycle Inventory of a Modern Municipal Solid Waste Landfill. Journal of Waste Management and Research. 1999;17(6):394-408.
- [CrossRef] [Google Scholar]
- Municipal solid waste management in kohima city-India. Iran J Environ health sci and eng. 2010;7(2):173-180.
- [Google Scholar]
- CPCB, (2020). Status of Municipal Solid waste Generation, Collection, Treatment and Disposal in Class I Cities, Series: CUPS/48/2005-2020.
- A flagship annual document of the Ministry of Finance, Government of India. In: Statistical Appendix. Ministry of Home Affairs; 2011. p. :1-128.
- [Google Scholar]
- Municipal solid waste composition: Sampling methodology, statistical analyses, and case study evaluation. Waste Management. 2015;36:12-23.
- [Google Scholar]
- Solid Waste Management in India: Options and Opportunities. Journal of Resources, Conservation and Recycling. 1998;24(2):137-154.
- [CrossRef] [Google Scholar]
- A System Dynamics Approach for Regional Environmental Planning and Management: A Study for the Lake Erhai Basin. Journal of Environmental Management. 2001;61(1):93-111.
- [CrossRef] [Google Scholar]
- Overview of Waste Disposal and Landfills/Dumps in Asian Countries. Journal of Material Cycles and Waste Management. 2004;6:104-110.
- [CrossRef] [Google Scholar]
- Environmental management of municipal solid wastes. Indian Journal of Environmental Protection. 1994;14(1):26-30.
- [Google Scholar]
- Current solid waste management strategies and energy recovery in developing countries - State of art review. Chemosphere.. 2022;291:133088.
- [CrossRef] [Google Scholar]
- Upgrading combined anaerobic-aerobic UASB-FPU to UASB-DHS system: Cost comparison and performance perspective for developing countries. Journal of Cleaner Production. 2021;284:124723.
- [CrossRef] [Google Scholar]
- MCD (2012) Report on Delhi's MSW Management. Delhi: Municipal Corporation of Delhi Department of Environment Management Services.
- MCD, (2020). Status of Municipal Solid waste Generation, Collection, Treatment and Disposal in Class I Cities, Series: CUPS/48/2005-2020.
- The Gazette of India. Municipal Solid Waste (Management and Handling) Rules, New Delhi, India. Ministry of Environment and Forests; 2000.
- An overview of greenhouse gases emissions in Hungary. J of Cle Prod. 2021;314:127865.
- [CrossRef] [Google Scholar]
- NDMC, (2020). Status of Municipal Solid waste Generation, Collection, Treatment and Disposal in Class I Cities, Series: CUPS/48/2005-2020.
- Environmental Engineering. Singapore: McGraw-Hill Book Company; 1985.
- Pervez, M.N., Mondal, M.I.H., Cai, Y., Zhao, Y., Naddeo, V., 2021. 21 - Textile waste management and environmental concerns, in: Mondal, M.I.H.B.T.-F. of N.F. and T. (Ed.), The Textile Institute Book Series. Woodhead Publishing, pp. 719–739. https://doi.org/https://doi.org/10.1016/B978-0-12-821483-1.00002-4.
- Energy generation and revenue potential from municipal solid waste using system dynamic approach. Chemosphere 2022134351
- [CrossRef] [Google Scholar]
- The Gazette of India. Solid Waste Management Rules. Ministry of Environment, Forest and Climate Change; 2016.
- Municipal Solid Waste Characteristics and Management in China. Journal of Air and Waste Management Association. 2001;51(2):250-263.
- [CrossRef] [Google Scholar]


