

Translate this page into:
Ethanolic extraction of flavonoids, phenolics and antioxidants from Vernonia amygdalina leaf using two-level factorial design
⁎Corresponding author. ruthoalao@gmail.com (O.R. Alara)
-
Received: ,
Accepted: ,
This article was originally published by Elsevier and was migrated to Scientific Scholar after the change of Publisher.
Peer review under responsibility of King Saud University.
Abstract
Vernonia amygdalina leaves are mostly consumed in Asia and Africa, due to its potential as a good source of antioxidants. In this study, a two-level factorial design was used to evaluate the significant extraction parameters in achieving higher recovery yield of extract, total phenolic content, total flavonoid content, and antioxidants from Vernonia amygdalina leaf. Microwave-assisted extraction technique was employed using aqueous ethanol. The independent parameters were irradiation time (1–5 min), microwave power level (500–700 W), temperature (60–80 °C), feed-to-solvent ratio (1:8–1:12 g/ml), and ethanol concentration (40–80%). Amongst the examined parameters, ethanol concentration, irradiation time, microwave power level, and feed-to-solvent ratio were significant (p < 0.05), whereas, extraction temperature was insignificant. Therefore, the recovery yield of extract, total phenolic content, total flavonoid content, and antioxidants from the ethanolic extraction of Vernonia amygdalina leaf using MAE technique are significantly affected by ethanol concentration, irradiation time, microwave power and feed-to-solvent ratio.
Keywords
Phenolic
Flavonoid
Extraction
Antioxidant
Factorial design

1 Introduction
In recent years, several epidemiological studies are being carried out on bioactive compounds like phenolics and flavonoids due to their numerous health benefits to human beings. Researchers have suggested that an initial cause of most chronic ailments is traceable to free radical attacks on biomolecules (Alara et al., 2019; Ayoola et al., 2008; Tabatabaei-Malazy et al., 2013). Thus, consumption of foods rich in phenolic compounds has been suggested capable in scavenging the reactive species. Plants have been used as an alternative medicine in treating different ailments. The herbs and spices are plants used as food and medicine, as they contain an appreciable amount of natural antioxidants (Butsat and Siriamornpun, 2016). A natural antioxidant like flavonoids, phenols, and tannins prevent diseases related to oxidative stress, like diabetes, cancer, inflammation and other related ailments (Yao et al., 2004).
Vernonia amygdalina is one of the famous plants in Asia and Africa (especially West Africa) due to its pharmacological properties like hypoglycemic and hypolipidemic, anticancer, anti-diabetes, antihelminthic, anti-tumorigenic, antimicrobial, anti-malaria, anti-inflammatory, antioxidant and among others (Asante et al., 2016; Atangwho et al., 2013; Yeap et al., 2010). It belongs to the family Asteraceae which is the largest genus with close to 1000 species (Toyang and Verpoorte, 2013). Different researchers had isolated and characterized several bioactive compounds from the plant, including flavonoids, steroids glycosides, sesquiterpenes lactones, tannins, terpenoids and saponins (Mwanauta et al., 2014). However, extraction of phenolics from plant matrix has usually been achieved through either conventional or unconventional method using different solvents.
Extraction is very important in the recovery of phytochemicals from plant matrix. For instance, microwave-assisted extraction is more effective in the recovery of higher and quality phenolics and flavonoids from plant matrix in a shorter time as compared with a conventional method like soxhlet, maceration and others (Chan et al., 2011; Desai et al., 2010). Nevertheless, this method is being affected by different extraction parameters, viz, irradiation time, temperature, microwave power level, feed-to-solvent ratio, and solvent concentration (when a mixture of solvent is used) (Raut et al., 2015). In order to minimize cost, the contributing extraction parameters need to be evaluated. Although, the one-factor-at-a-time experiment was the most used method but the approach is expensive, time-consuming and may give in inaccurate results since it does not consider interactive parameters (Frey et al., 2003).
To contain these shortcomings, two-level factorial design is being used as a statistical screening process. This approach is useful in evaluating main as well as interactive effects during the extraction with minimal experimental runs. Thus, the aim of this study is to screen the independent factors, namely irradiation time (1–5 min), microwave power level (500–700 W), temperature (60–80 °C), feed-to-solvent ratio (1:8–1:12 g/ml), and ethanol concentration (40–80%) for the recovery yield of extract, total phenolic content, total flavonoid content, and antioxidant activities from Vernonia amygdalina leaf using two-level factorial design.
2 Materials and methods
2.1 Plant material
Fresh leaves of Vernonia amygdalina were harvested from Gambang in Malaysia (Latitude: 3°42′25.183″N and Longitude: 103°6′8.982″E). The leaves were washed in a running tap and dried to constant weight at room temperature. The moisture content was 0.012 ± 0.15 g water/g dry sample before storage. The dried plant sample was crushed and sieved to an average particle size of 105 mm. Thereafter, the sample was stored in a dark airtight polyethene bag at 4 °C refrigerator before the extraction processes.
2.2 Chemicals and reagents
Ethanol, aluminium chloride salt, methanol, sodium carbonate anhydrous, Folin-Ciocateu phenol reagent, quercetin, 2,2-diphenyl-picrylhydrazyl (DPPH), and 2,2′-Azino-bis-3-ethylbenzothiazoline-6-sulfonic acid (ABTS+•) were purchased from Sigma-Aldrich (M) Sdn Bhd, Selangor. All chemicals and reagents used in this study were of analytical grade.
2.3 Extraction process
The extraction process was carried out based on a factorial design using two coded levels of each extraction variable (low and high levels) as illustrated in Table 2. The variables were irradiation time (1–5 min), microwave power level (500–700 W), temperature (60–80 °C), feed-to-solvent ratio (1:8–1:12 g/ml), and ethanol concentration (40–80%). These ranges were first determined using OFAT experiment (Table 1). 10 g of powdered Vernonia amygdalina leaf was extracted using aqueous ethanol in an enclosed ethos reflux microwave extractor (1000 W, Frequency 2450 MHz, Milestone, Italy). Three-level of microwave heating were used to minimize noise, viz, preheating for 2 min at extraction temperature, irradiation at extraction temperature and cooling to 30 °C for 2 min. The variables were set based on the two-level factorial experimental design matrix (Table 3). After extraction, the extract was filtered and concentrated to dryness using a rotary evaporator (Buchi Rotavapor R-200 coupled to Buchi Vac V-500 pump, Switzerland). The extract was then refrigerated at 4 °C until further analysis. A – Irradiation time (min); B – Microwave power (W); C – Temperature (°C); D – Feed-to-solvent ratio (g/ml); E – Ethanol concentration (%); Y1 – Extraction yield (%); Y2 – Total phenolic content (mg GAE/g d.w.); Y3 – Total flavonoid content (mg QE/g d.w.); Y4 – DPPH inhibition (%); Y5 – ABTS inhibition (%); d.w. – dry weight.
Extraction variable
Notation
Variable levels
Low (−1)
High (+1)
Irradiation time (min)
A
1
5
Microwave power (W)
B
500
700
Temperature (°C)
C
60
80
Feed-to-solvent ratio (g/ml)
D
1:8
1:12
Ethanol concentration (%)
E
40
80
Irradiation time (min)
% extraction yield (w/w)
Microwave power (W)
% extraction yield (w/w)
Temperature (°C)
% extraction yield (w/w)
F:S (g/ml)
% extraction yield (w/w)
Ethanol concentration (%)
% extraction yield (w/w)
1
21.22 ± 0.20
400
19.88 ± 0.21
20
19.21 ± 0.25
1:6
20.65 ± 0.42
20
20.56 ± 0.26
2
22.46 ± 0.23 a
500
21.25 ± 0.33
40
20.54 ± 0.80
1:8
21.45 ± 0.28
40
21.89 ± 0.31
5
21.01 ± 0.19
600
22.66 ± 0.22 a
60
21.09 ± 0.31
1:10
22.59 ± 0.15 a
60
22.86 ± 0.35 a
10
20.22 ± 0.17
700
20.32 ± 0.29
70
22.85 ± 0.22a
1:12
21.05 ± 0.33
80
20.58 ± 0.33
15
19.84 ± 0.15
800
19.77 ± 0.18
80
22.01 ± 0.18
1:16
20.28 ± 0.10
100
19.04 ± 0.30
Run
Variables
Responses
A
B
C
D
E
Y1
Y2
Y3
Y4
Y5
1
1
500
60
1:12
80
23.00
108.57
91.12
96.35
98.07
2
5
500
60
1:12
40
21.43
101.25
84.88
89.78
91.46
3
1
700
60
1:12
40
20.95
98.89
83.09
87.86
89.43
4
5
700
60
1:12
80
20.65
97.56
81.73
86.31
87.98
5
1
500
80
1:12
40
21.00
99.14
83.11
87.92
89.57
6
5
500
80
1:12
80
22.19
104.84
88.10
93.04
94.80
7
1
700
80
1:12
80
22.36
105.56
88.33
93.48
95.38
8
5
700
80
1:12
40
20.11
95.01
78.84
83.26
84.89
9
1
500
60
1:8
40
20.00
94.42
79.22
83.77
85.27
10
5
500
60
1:8
80
21.96
103.75
86.98
91.86
93.57
11
1
700
60
1:8
80
22.82
107.72
90.51
95.50
97.22
12
5
700
60
1:8
40
20.11
94.93
79.76
84.23
85.94
13
1
500
80
1:8
80
22.34
105.47
88.62
93.62
95.43
14
5
500
80
1:8
40
21.61
102.09
85.50
90.29
92.13
15
1
700
80
1:8
40
20.78
98.10
82.09
86.73
88.45
16
5
700
80
1:8
80
19.95
94.25
78.21
82.72
84.27
2.4 Total flavonoid content (TFC)
The total flavonoid content in the V. amygdalina leaf extract was determined using Oriakhi et al. (2013) method. Briefly, 2% AlCl3 dissolved in ethanol was mixed with Vernonia amygdalina leaf extract in the ratio of 1:1. After 1 h of incubation at room temperature, the absorbance of the mixture was measured at 420 nm. A standard curve of quercetin (50–500 mg/ml) was plotted with the equation y = 0.112x + 0.178, R2 = 0.9945, where y is the absorbance at 420 nm and x is the sample concentration in mg/ml. The sample concentration was then calculated from the standard curve equation and the result was expressed as mg quercetin equivalents per gram of dried weight sample (mg QE/g d.w.). The total flavonoid contents of the extracts were calculated using Eq. (1). Ethanol was used as the blank. The analyses were carried out in triplicate.
2.5 Total phenolic content (TPC)
TPC of the V. amygdalina leaf extract was evaluated based on the procedure of Saravanan and Parimelazhagan (2014) and Dahmoune et al. (2014) with little modifications. In concise, 100 µl of the extract was mixed with 0.2 ml of Folin-Ciocalteu reagent. After 5 min of incubation in the dark at room temperature, 0.6 ml of 0.2 mM Na2CO3 solution was added and then incubated for the next 120 min. The absorbance of the mixture was measured at 765 nm using a UV–VIS Spectrophotometer (Hitachi U-1800, Japan). Thereafter, the sample concentration was calculated from the gallic acid (50–500 mg/ml) standard curve equation and the result was expressed as mg gallic acid equivalents per gram of dried weight sample (mg GAE/g d.w.) The total phenolic contents of the extracts were calculated using Eq. (2). Ethanol was used as the blank. The analyses were done in triplicate.
2.6 Antioxidant activity assays
The DPPH and ABTS+• free radical scavenging activities were carried out using Alara et al. (2019) method. In concise, 2 ml of 1 mM DPPH solution was added to 0.2 ml of Vernonia amygdalina leaf extract. The absorbance of the mixture was measured at 517 nm using a UV–VIS Spectrophotometer (Hitachi U-1800, Japan) after incubated at room temperature for 30 min. Methanol was used as the blank. The percentage of DPPH inhibition was evaluated using Eq. (3).
In the same vein, stock solution was prepared by incubating a mixture of 7 mM ABTS+• solution with 2.45 mM potassium persulfate solution in the ratio 1:1 for 12 h in the dark. The fresh working solution of ABTS+• was prepared by mixing 2 ml of ABTS+• stock solution with 120 ml methanol to obtain an absorbance of 1.1 ± 0.02 at 734 nm using UV–VIS Spectrophotometer (Hitachi U-1800, Japan). Then, 0.15 ml of the extract was thoroughly mixed with 2.85 ml of fresh ABTS+• working solution. The absorbance was measured at 734 nm using UV–VIS Spectrophotometer (Hitachi U-1800, Japan) after an incubation period of 2 h in the dark. Methanol was used as the blank. The percentage of ABTS+• was determined using Eq. (3).
2.7 Experimental design and statistical analysis
In the evaluation of five variables at two coded levels, a two-level factorial design with 16 experimental trials was carried out in a randomized trend. The experimental runs and the analyses were carried out in triplicate and the results were expressed as mean ± SD. The resulting values and statistical analysis were processed using Design Expert 7.0 software® (Version 7.1.6, Stat-Ease Inc., Minneapolis, USA) and Microsoft Excel® 2013. Analysis of variance (ANOVA) was employed to determine the statistical significance of the model.
3 Results and discussion
3.1 Range determination for the extraction variables
The range of each extraction variable for the recovery yields were determined using one-factor-at-a time experiment. This was carried out by varying one extraction variable while keeping the others constant. Table 1 shows the results obtained from the experiments. It can be seen that the highest yield of recovery from the ethanolic extraction of Vernonia amygdalina leaf was obtained at 2 min of irradiation time, 600 W of microwave power, temperature at 70 °C, feed-to-solvent ratio of 1:10 g/ml, and ethanol concentration of 60%. Thus, the ranges were selected from the previous to the next point of the highest yield, for instance, irradiation time ranged from 1 to 5 min, microwave power from 500 to 700 W, temperature ranged from 60 to 80 °C, feed-to-solvent ratio ranged from 1:8 to 1:10, and ethanol concentration ranged from 40 to 80%.
3.2 Screening of MAE variables on the responses
The influence of some extraction variables can sometimes be more significant than others. The use of an insignificant variable in the extraction process may give incorrect or inappropriate results (Jalbani et al., 2006). Thus, factor screening is inevitable for the extraction process. The identification of the extraction parameters that are likely to be effective on the higher recovery of yield, TPC, TFC, and antioxidant inhibition of Vernonia amygdalina leaf was carried out using 25–1 factorial design. This was done to determine the contribution effect of an individual parameter (irradiation time, microwave power level, temperature, feed-to-solvent ratio, and ethanol concentration) on the responses (recovery yields). More so, the effect of each parameter was evaluated based on their significant levels (p < 0.05).
3.3 Influence of microwave-assisted extraction parameters on the extraction yield, TPC, TFC and antioxidant activities
In general, all the response models were significant (p < 0.05, Table 4). It can also be observed that an increase in the irradiation time, microwave power level and feed-to-solvent ratio caused a decline in the recovery yield of extract, TPC, TFC, and antioxidant activities from V. amygdalina leaf (Figs. 1–5). In contrary, an increase in ethanol concentration resulted in higher recoveries but temperature displayed the least effect. On the basis of each extraction parameters, irradiation time is one of the parameters that influence the extraction of phenolic, flavonoid and antioxidant from plant matrix (Tan et al., 2013). The highest recovery yields were obtained at 2 min of irradiation and further increment showed a declined yield. This is in agreement with the previous study on the MAE of polyphenols and caffeine from green tea leaves (Pan et al., 2003). Thus, it can be deduced that the prolonged exposure of plant matrix to microwave may cause bioactive degradation (Hithamani and Ramalakshmi, 2013). Moreover, it has been reported that higher feed-to-solvent ratio requires more energy and time even though higher yield may be obtained but for this study, higher feed-to-solvent ratio actually showed a lesser effect (Hithamani and Ramalakshmi, 2013; Pan et al., 2003). Microwave power level and solvent concentration are the major parameters that determine quality and quantity of the yields from plant matrix in MAE (Do et al., 2014; Li et al., 2012). Inappropriate selection of microwave power level and solvent concentration may lead to incorrect results. A – Irradiation time (min); B – Microwave power (W); C – Temperature (°C); D – Feed-to-solvent ratio (g/ml); E – Ethanol concentration (%); Y1 – Extraction yield (%); Y2 – Total phenolic content (mg GAE/g d.w.); Y3 – Total flavonoid content (mg QE/g d.w.); Y4 – DPPH inhibition (%); Y5 – ABTS inhibition (%); d.w. – dry weight.
Extraction variables
Percentage contribution (%)
p-values for the responses
Y1
Y2
Y3
Y4
Y5
Y1
Y2
Y3
Y4
Y5
Model
0.0001
0.0001
0.0002
0.0002
0.0002
A
10.74
10.29
11.26
11.69
11.37
0.0005
0.0005
0.0005
0.0005
0.0006
B
13.15
13.31
14.38
14.61
14.37
0.0003
0.0003
0.0003
0.0003
0.0004
C
0.13
0.12
0.47
0.44
0.32
0.4138
0.4232
0.1641
0.1884
0.2539
D
1.76
1.79
1.59
1.79
1.74
0.0225
0.0204
0.0295
0.0277
0.0307
E
33.68
33.89
31.77
31.61
31.49
<0.0001
<0.0001
<0.0001
<0.0001
<0.0001
AB
18.83
18.98
19.22
19.12
19.34
AC
0.00
1.58 × 10⁻⁵
0.019
0.027
0.058
AD
0.15
0.14
0.10
0.15
0.16
AE
15.52
15.46
14.45
14.35
14.85
BC
1.69
1.67
2.67
2.43
2.49
BD
0.66
0.64
0.69
0.70
0.65
BE
1.03
1.01
1.17
1.07
1.07
CD
0.01
0.012
3.51 × 10³
7.47 × 10⁻³
6.76 × 10⁻³
CE
2.64
2.67
2.16
1.96
1.97
DE
7.66 × 10⁻³
6.12 × 10⁻³
0.06
0.059
0.096
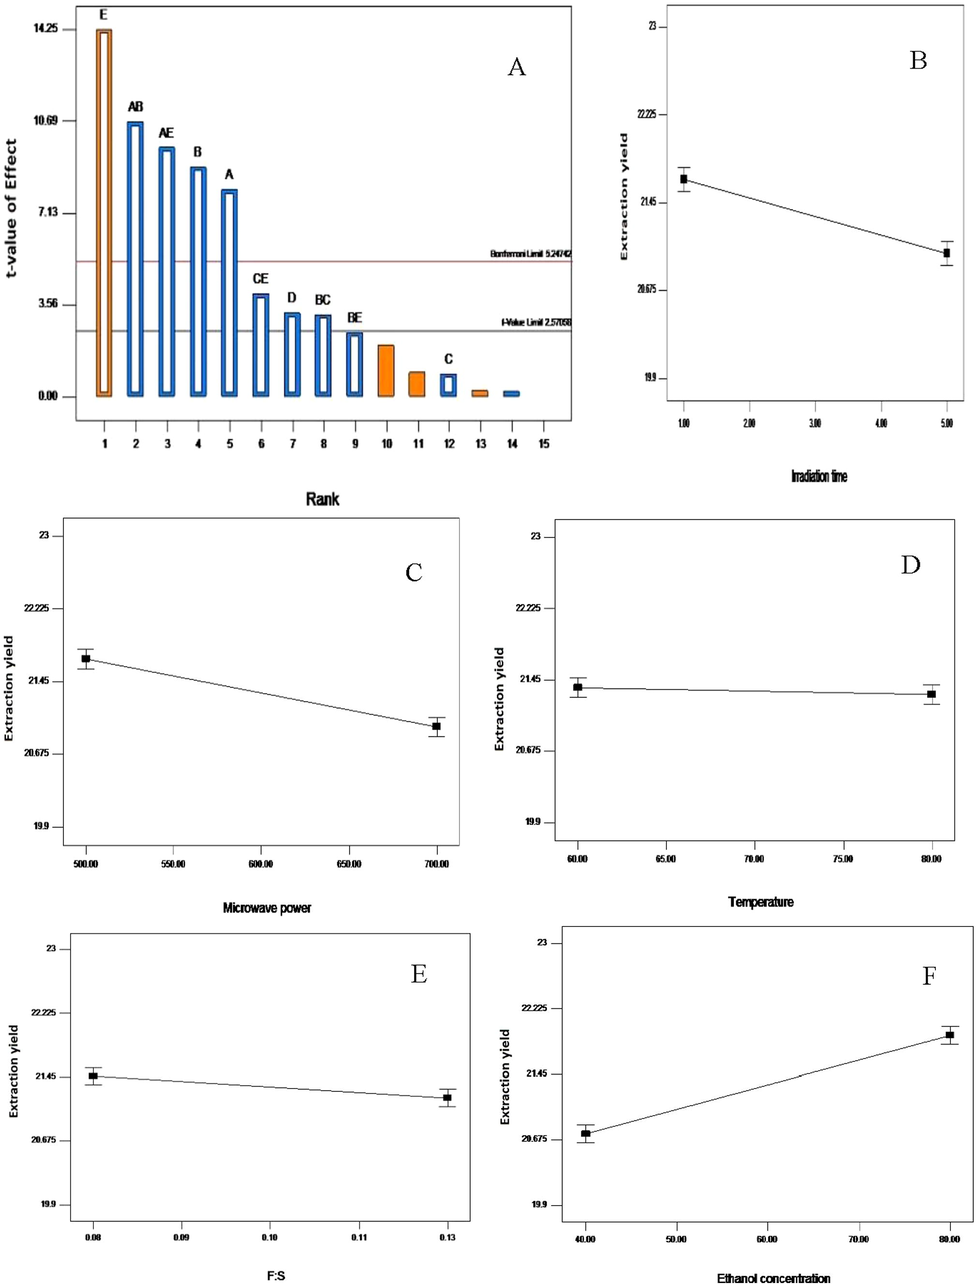
The Pareto chart (A); influence of irradiation time (B); microwave power (C); temperature (D); feed-to-solvent ratio (E) and ethanol concentration (F) on the ethanolic extraction yield from Vernonia amygdalina leaf. A greater slope shows a greater influence on the recovery.
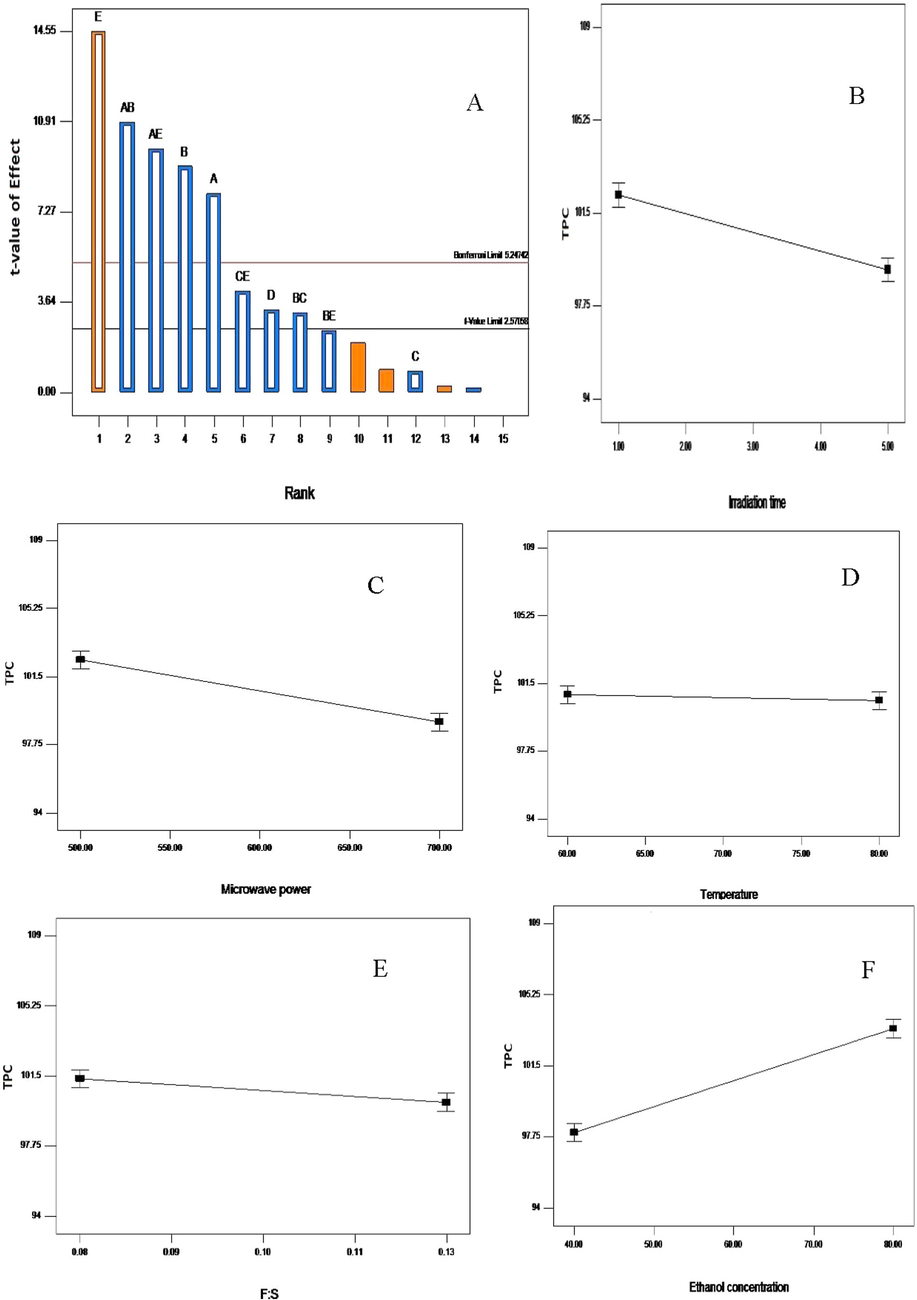
The Pareto chart (A); influence of irradiation time (B); microwave power (C); temperature (D); feed-to-solvent ratio (E) and ethanol concentration (F) on the total phenolic content recovery from V. amygdalina leaf. A greater slope shows a greater influence on the recovery.
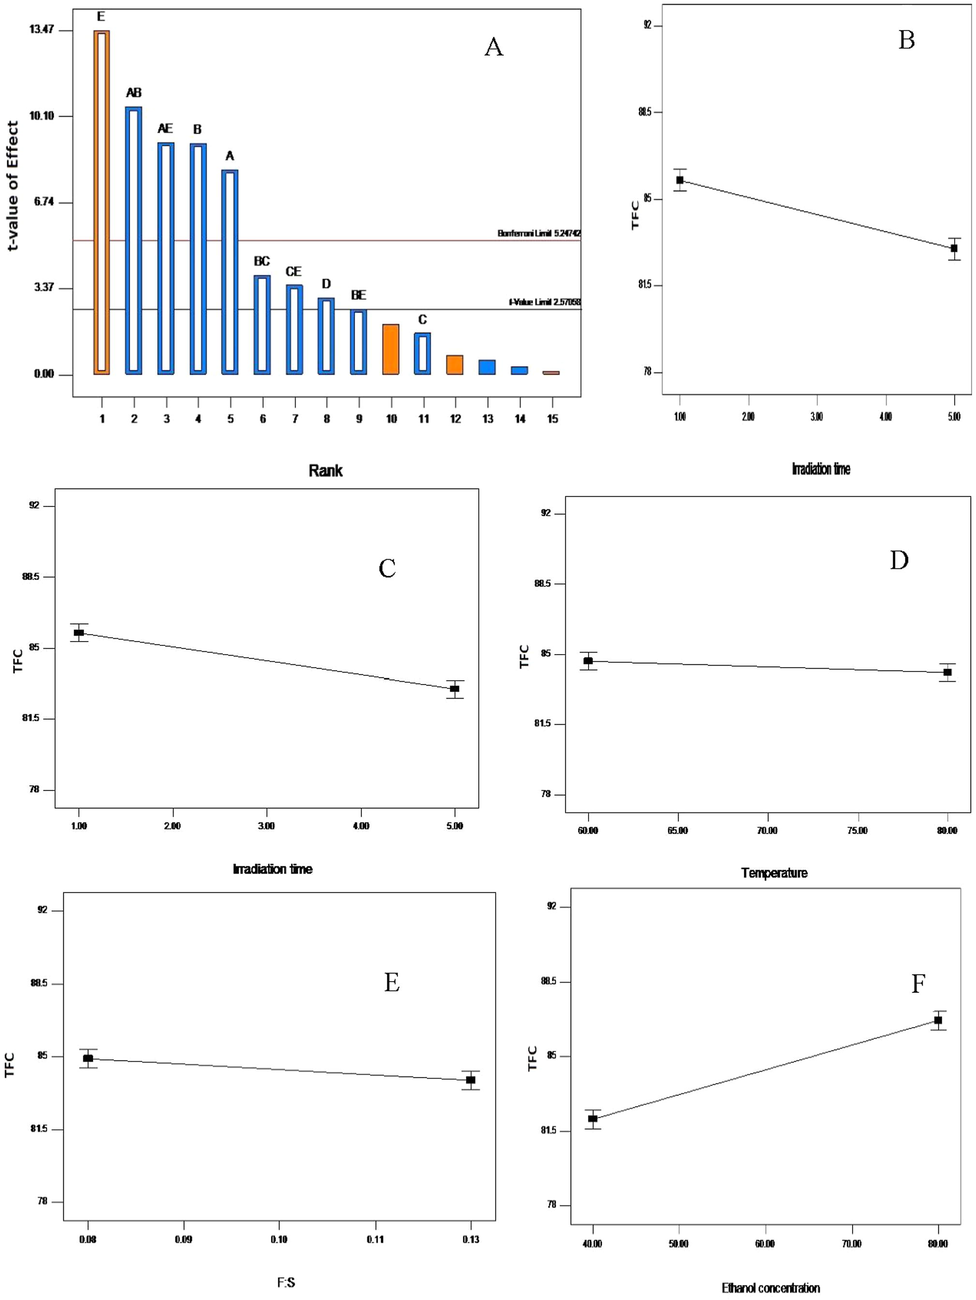
The Pareto chart (A); influence of irradiation time (B); microwave power (C); temperature (D); feed-to-solvent ratio (E) and ethanol concentration (F) on the total flavonoid content recovery from V. amygdalina leaf. A greater slope shows a greater influence on the recovery.
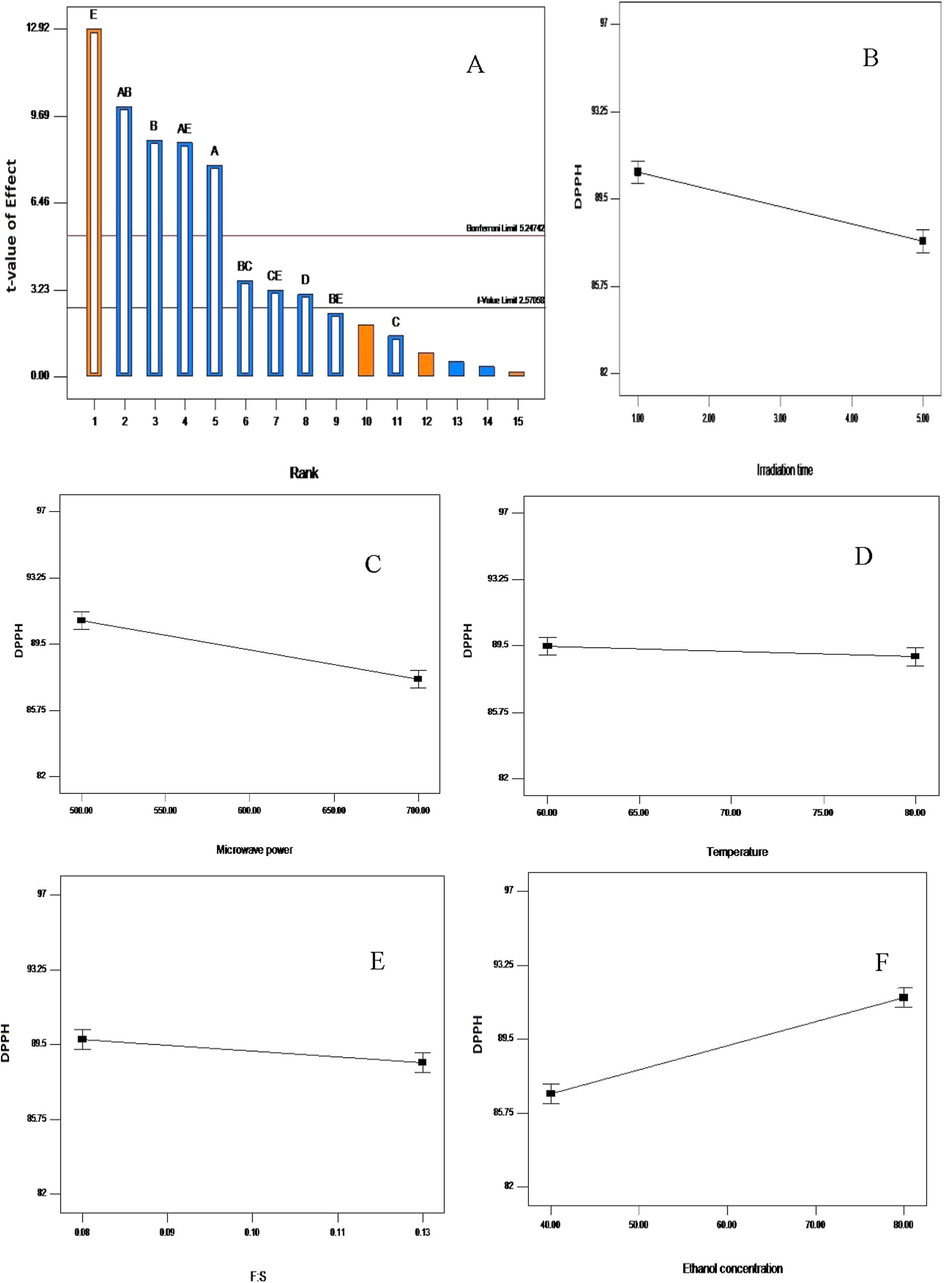
The Pareto chart (A); influence of irradiation time (B); microwave power (C); temperature (D); feed-to-solvent ratio (E) and ethanol concentration (F) on the DPPH inhibition recovery from Vernonia amygdalina leaf. A greater slope shows a greater influence on the recovery.
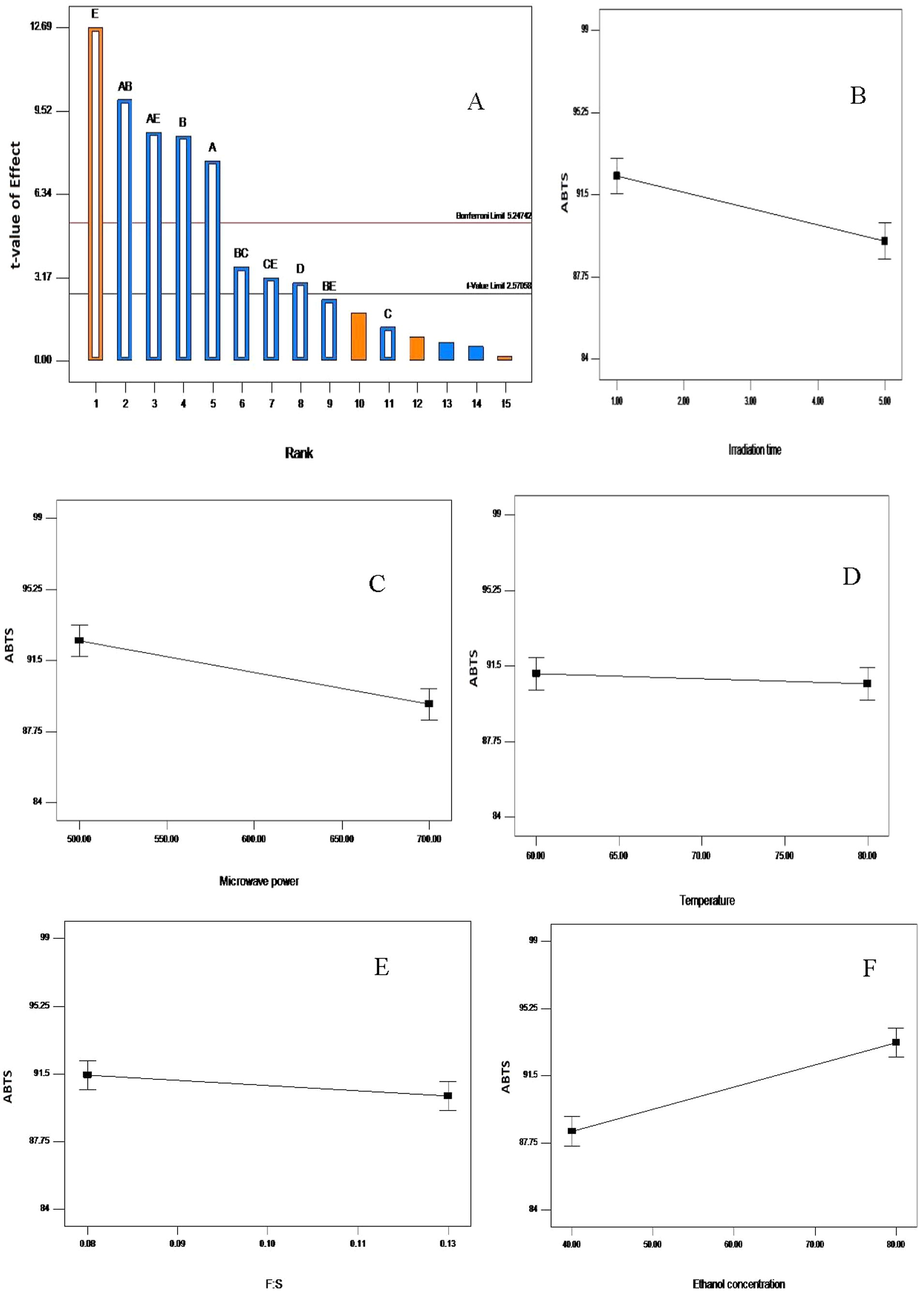
The Pareto chart (A); influence of irradiation time (B); microwave power (C); temperature (D); feed-to-solvent ratio (E) and ethanol concentration (F) on the ABTS inhibition recovery from Vernonia amygdalina leaf. A greater slope shows a greater influence on the recovery.
For the recovery yield of extract, irradiation time, microwave power level, feed-to-solvent ratio, and ethanol concentration were found very significant (p < 0.05), whereas, the temperature remains insignificant (Table 4, Fig. 1). Effect of ethanol concentration was the major contributing variable of 33.68%, followed by microwave power level (13.15%), irradiation time (10.74%) and feed-to-solvent ratio of 1.76% (Table 4). Pareto chart measures sampling errors through the standard deviation of individual variable and their interactions. In another way, it is the frequency histogram that estimates the effect of each variable on the response in decreasing order whereby the t-value scale provides a more accurate measure of the relative effects. Any variable or interaction that falls below the t-value limit of 2.26216 is insignificant. In Fig. 1A, the Pareto plot showed that ethanol concentration was the most contributing factor in attaining highest yield of extract from Vernonia amygdalina leaf. In contrary, the temperature was not significant as it fell below the t-value limit. Additionally, the line plot showed a significant gradient of the slope. One of the possible reason for this significance might be due to the solubility of Vernonia amygdalina leaf in aqueous ethanol. Thus, the percentage of ethanol concentration in the extraction medium has a significant effect on the recovery yield of V. amygdalina leaf. Chew et al. (2011) reported that water helps in swelling of the plant matrix, and increases contact surface area between the solvent and plant matrix, thereby resulting in an increasing extraction efficiency. Therefore, bioactive compounds can best be extracted using an aqueous alcohol, instead of either alcohol or water alone (Do et al., 2014; Hithamani and Ramalakshmi, 2013). More so, solvent concentration gradient within the plant matrix acts as a driving force for the extraction process whereby individual compound develops equilibrium between solvent and the plant tissues (Dahmoune et al., 2015).
Similarly, from Table 4 and Fig. 2, it is clearly seen that ethanol concentration, microwave power, irradiation time, feed-to-solvent ratio, and ethanol concentration were significant (p < 0.05), contributing 33.89, 13.31, 10.29, and 1.79%, respectively. Extraction temperature was insignificant in obtaining a higher yield of total phenolic content from Vernonia amygdalina leaf using MAE. The effect of interaction variables of irradiation time with microwave power contributed 18.98%, while with ethanol concentration, it was 15.46%. TPC increases as the ethanol concentration increased. More so, the Pareto chart showed that ethanol concentration was the most contributing factor to attain higher yield of total phenolic content (Fig. 2A) while the temperature was insignificant (falls below the t-value limit).
The effect of MAE parameters on the total flavonoid content is shown in Table 4. It can be clearly seen that the recovery yield of TFC was greatly affected by irradiation time, microwave power, feed-to-solvent ratio, and ethanol concentration (p < 0.05). The contribution of each extraction parameters were in the order, viz, ethanol concentration > microwave power level > irradiation time > feed-to-solvent ratio > temperature (Fig. 3A). Extraction temperature was insignificant in attaining higher recovery yields of flavonoids from V. amygdalina leaf. In addition, it was observed that increase in ethanol concentration from 40 through 80% resulted in an increased yield of flavonoids from 78.21 to 91.12 mg QE/g d.w. (Fig. 3F). Likewise, similar effects were observed for microwave power, irradiation time and feed-to-solvent ratio except for temperature that showed insignificant increment, whereby the gradient of the line was nearly zero (Fig. 3D).
In the same vein, the effect of MAE parameters was studied for the maximum recovery of antioxidant activities, including DPPH and ABTS (Figs. 4 and 5). The model was significant (p < 0.05) and the recovery antioxidants were mostly affected by ethanol concentration, microwave power level, irradiation time, and feed-to-solvent ratio (p < 0.05). However, temperature remained insignificant (p > 0.05). The contributing factors were in the order of ethanol concentration (31.61 and 31.49%) > microwave power level (14.38 and 14.37%) > irradiation time (11.66 and 11.37%) > feed-to-solvent ratio (1.79 and 1.74%) > temperature (0.44 and 0.32), respectively (Table 4). The Pareto chart confirmed the highest significance of ethanol concentration in attaining higher antioxidant activities from Vernonia amygdalina leaf (Figs. 4A and 5A). Likewise, the line plots in Figs. 4 and 5 reflected the significant gradient of the slope, ethanol concentration has the prominent slope and temperature the least. The insignificant effect of temperature may be due to the fact that higher temperature causes the rupture of phenolic compounds and affect the membrane structure of the plant matrix making them less active (Chew et al., 2011). In addition, few interactions between the extraction parameters also contributed to the higher recovery of antioxidant activities.
4 Conclusion
The two-level factorial design screening was used to evaluate the significance of microwave-assisted extraction parameters, which include irradiation time, microwave power level, temperature, feed-to-solvent ratio, and ethanol concentration in obtaining an higher recovery yield of extract, total phenolic content, total flavonoid content, and antioxidant activities (DPPH and ABTS) from Vernonia amygdalina leaf. The obtained results showed that ethanol concentration, microwave power level, irradiation time, and feed-to-solvent ratio were significant (p < 0.05) in attaining higher yields. Therefore, further study on optimization employing the obtained significant factors is in progress.
Conflict of interest
We declare no conflict of interest on this study.
References
- Effect of drying methods on the free radicals scavenging activity of Vernonia amygdalina growing in Malaysia. J. King Saud Univ. -Sci.. 2019;31:495-499.
- [Google Scholar]
- Antidiabetic effect of young and old ethanolic leaf extracts of Vernonia amygdalina: a comparative study. J. Diabetes Res.. 2016;2016:1-13.
- [Google Scholar]
- Antioxidant versus anti-diabetic properties of leaves from Vernonia amygdalina del. growing in Malaysia. Food Chem.. 2013;141:3428-3434.
- [Google Scholar]
- Phytochemical screening and antioxidant activities of some selected medicinal plants used for malaria therapy in Southwestern Nigeria. Trop. J. Pharm. Res.. 2008;7:1019-1024.
- [Google Scholar]
- Effect of solvent types and extraction times on phenolic and flavonoid contents and antioxidant activity in leaf extracts of Amomum chinense C. Int. Food Res. J.. 2016;23:180-187.
- [Google Scholar]
- Microwave-assisted extractions of active ingredients from plants. J. Chromatogr. A. 2011;1218:6213-6225.
- [Google Scholar]
- Effect of ethanol concentration, extraction time and extraction temperature on the recovery of phenolic compounds and antioxidant capacity of Orthosiphon stamineus extracts. Int. Food Res. J.. 2011;18:1427-1435.
- [Google Scholar]
- Optimization of microwave-assisted extraction of polyphenols from Myrtus communis leaves. Food Chem.. 2015;166:585-595.
- [Google Scholar]
- Pistacia lentiscus leaves as a source of phenolic compounds: microwave-assisted extraction optimized and compared with ultrasound-assisted and conventional solvent extraction. Ind. Crops Prod.. 2014;61:31-40.
- [Google Scholar]
- Extraction of natural products using microwaves as a heat source. Sep. Purif. Rev.. 2010;39:1-32.
- [Google Scholar]
- Effect of extraction solvent on total phenol content, total flavonoid content, and antioxidant activity of Limnophila aromatica. J. Food Drug Anal.. 2014;22:296-302.
- [Google Scholar]
- A role for one-factor-at-a-time experimentation in parameter design. Res. Eng. Des.. 2003;14:65-74.
- [Google Scholar]
- Microwave assisted extraction of phenolics from Origanum vulgare. Int. Invent. J. Agric. Soil Sci.. 2013;1:7-12.
- [Google Scholar]
- Application of factorial design in optimization of ultrasonic-assisted extraction of aluminum in juices and soft drinks. 2006;70:307-314.
- Effect of energy density and citric acid concentration on anthocyanins yield and solution temperature of grape peel in microwave-assisted extraction process. J. Food Eng.. 2012;109:274-280.
- [Google Scholar]
- Prospective bioactive compounds from Dysphania ambrosioides and Tithonia diversifolia in controlling legume insect pests. Agric. Sci.. 2014;5:1129-1139.
- [Google Scholar]
- Comparative antioxidant activities of extracts of Vernonia amygdalina and Ocimum gratissimum leaves. J. Agric. Sci.. 2013;6:13-20.
- [Google Scholar]
- Microwave-assisted extraction of tea polyphenols and tea caffeine from green tea leaves. Chem. Eng. Process.. 2003;42:129-133.
- [Google Scholar]
- Emerging microwave assisted extraction (MAE) techniques as an innovative green technologies for the effective extraction of the active phytopharmaceuticals. Res. J. Pharm. Technol.. 2015;8:800-810.
- [Google Scholar]
- In vitro antioxidant, antimicrobial and anti-diabetic properties of polyphenols of Passiflora ligularis juss. fruit pulp. Food Sci. Hum. Wellness. 2014;3:56-64.
- [Google Scholar]
- A novel management of diabetes by means of strong antioxidants’ combination. J. Med. Hypotheses Ideas. 2013;7:25-30.
- [Google Scholar]
- Effects of extraction solvent system, time and temperature on total phenolic content of henna (Lawsonia inermis) stems. Int. Food Res. J.. 2013;20:3117-3123.
- [Google Scholar]
- A review of the medicinal potentials of plants of the genus Vernonia (Asteraceae) J. Ethnopharmacol.. 2013;146:681-723.
- [Google Scholar]
- Flavonoids in food and their health benefits. Plant Foods Hum. Nutr.. 2004;59:113-122.
- [Google Scholar]
- Vernonia amygdalina, an ethnomedical used green vegetable with multiple bio-activities. J. Med. Plants Res.. 2010;4:2787-2812.
- [Google Scholar]


