

Translate this page into:
Estimation of radionuclide activity release from near surface disposal repository for a hypothetical research reactor in Saudi Arabia
⁎Corresponding author. Yalashban@ksu.edu.sa (Yazeed Alashban)
-
Received: ,
Accepted: ,
This article was originally published by Elsevier and was migrated to Scientific Scholar after the change of Publisher.
Abstract
Objectives
The purpose of this study is to estimate the activity release from near surface disposal repository for a hypothetical open pool light-water research reactor (OP-LWR) in the Riyadh region, Saudi Arabia.
Methods
mathematical model was used to model six cement barriers near surface disposal repository. Water infiltration into the repository and into the radioactive waste is assumed to be the main cause of activity release into the environment. The hydraulic conductivity, specific mass, the porosity of the cement, and the local geosphere were considered, as well as the expected radioactive waste inventory produced by this reactor.
Results
The results show that there is a direct proportionality between distribution coefficient, retardation factor, and the mean time to collapse (MTTC). Also, the results show that nickel has the highest mean time to collapse among all the other radionuclides in the proposed model. The highest activity release in the biosphere was found to be Bq for Tc-99 after 1300 years.
Conclusions
The impact of the radiological behavior of each selected radionuclide enabled finding the effect on the repository performance.
Keywords
Radioactive waste
Near surface disposal
Safety assessment

- NSDR
-
Near surface disposal repository
- LILW
-
Low and intermediate radioactive waste
- OP-LWR
-
Open pool light-water research reactor
- (MTTC)
-
Mean time to collapse
Abbreviations
1 Introduction
Nuclear research reactors are mainly used to provide a neutron source for various applications. These have a wide variety of different types of reactor that are not used for power generation. In comparison with power generation reactors, research reactors are smaller and simpler with far less fuel and fission products’ build-up. Their power ratings are designated in megawatts in a range from zero up to 200 MWt (IAEA, 2016). Around the world, 224 research reactors are operating for producing medical radiopharmaceuticals, research, education, training, material structure studies, neutron radiography and therapy, silicon doping, and neutron activation analysis (IAEA, 2009a, 2014, 2015).
Radioactive waste generation from nuclear reactors during operation is unavoidable. The types and amounts of operational waste generated depend on the reactor type, operational schedule, and main applications (IAEA, 2009b). The waste management plan is critical to ensure the protection of workers, the public, and the environment. It should consider proper classification of the waste, segregation of the waste types and stream, and a detailed inventory of the amount and type of the waste, treatment, conditioning, storage, safe handling, transport, and final deposition (IAEA, 2007, 2009b, 2009c).
For final deposition, near surface disposal repository (NSDR), which are an option for permanent storage of radioactive waste, have been developed by many countries such as Canada and Finland for low and intermediate radioactive waste (LILW) generated from nuclear reactors (IAEA, 2004; Vieno and Nordman, 1998). LILWs have a small fraction of total activity produced in the world but represent 90% of the total volume of radioactive waste. Thus, it should be managed properly to minimize the risk associated with the radioactive waste (Aguiar and Damaso, 2010).
The safety assessment for NSDR should address the following key components: specification of the assessment context, description of the waste disposal system, development and justification of scenarios, the formulation and implementation of models, and analysis of results and building of confidence (IAEA, 2004). The safety of NSDR is determined by the physical and chemical properties of the waste, and the host environment. In the past, multiple barriers models were considered as collections of independent individual barriers that worked in sequence (Nair and Krishnamoorthy, 1999). Currently, all these models have simultaneously integrated dependent barriers (IAEA, 2002). In this study, a mathematical model was adopted to estimate the activity release from NSDR for a hypothetical open pool light-water research reactor (OP-LWR) in Saudi Arabia.
2 Methods
The first NSDR in Saudi Arabia is proposed to be in a remote and unpopulated area in the Riyadh region, which is the central region in the country. This region has a low chance of precipitation and a very low risk of earthquakes and volcanos, and is mainly bounded by the Phanerozoic sedimentary rocks (The Saudi Geological Survey, 2017). The hypothetical NSDR for nuclear waste from OP-LWR contains six cement barriers, as shown in Fig. 1. These barriers are: upper cover (0.50 m high), lower cover (0.40 m high), radioactive waste (3 m high, 10 m long, and 5 m width), side covers (0.70 m thick), end cover (0.60 m high), and biosphere (20 m thick).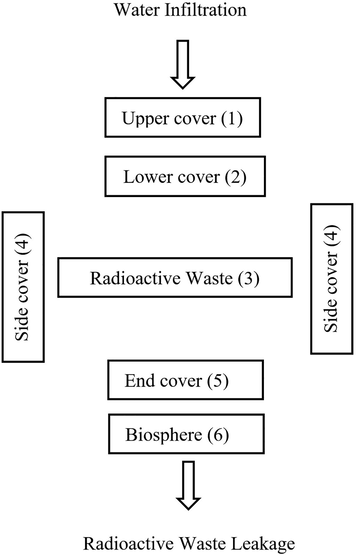
The barriers for the hypothetical near surface disposal repository.
We assume that all compartments in this model work in a parallel alignment and that a model collapse will happen when barrier (1) and (2) and (3) and [(4) or (5)], and (6) collapse. Barrier (1) and (2) are covers against water (rain) infiltration, while barriers (3), (4), and (5) are covers against radioactive waste leakage. Barriers (3) contains all the radioactive waste from the hypothetical OP-LWR. The waste may drain through the end or side covers and flows through the biosphere.
The collapse time of each barrier is assumed a random variable with a particular probability density function. To express the collapse time of each barrier, exponential distribution was used. As seen in Fig. 2, we adapted the Markov model since our model has passive parallel barriers and correlational relation between its compartments. Markov method has been used in previous studies (Aguiar and Damaso, 2010, 2011) to model a randomly changing systems and estimate the activity release rate.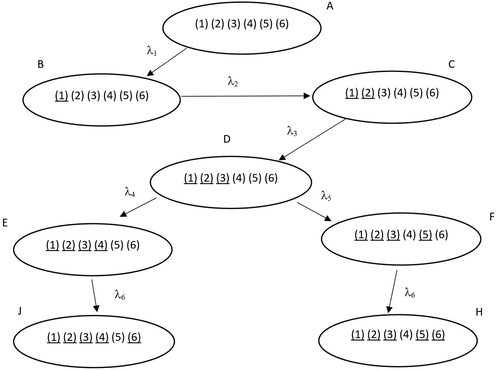
Transition illustration of the Markov method for the hypothetical model. The underline indicates a barrier collapse.
The most common radionuclides released as waste from the OP-LWR reactor are: Co-60, Ni-59, Sr-90, Tc-99, I-129, Cs-135, Cs-137, Pu-238, Pu-239, Pu-240, Pu-241, and Am-241 (Breysse and Gerard, 1997; de Kageneck and Pinel, 1998). In this study, some long-lived radionuclides (half-life more than 200,000 years) were chosen to further assess the performance of this depository.
Porosity (σ), which is the ratio of the volume of pores to the volume of bulk rock, is variable that fluctuates with time. Specific mass (
), which is the mass of a given substance per unit volume, depends of the fluctuation of the porosity. Similarly, hydraulic conductivity (ε), which is a term that describes the ease with which a fluid can move through pore spaces, mainly relies on porosity and specific mass. In this study, the following presumptions for variables change with time will be adopted: (1) porosity of 0.13 and specific mass of 2.8 g/cm3 will designate the physical properties of cement at time zero (Vieno and Nordman, 1998); (2) after 500 years, porosity will increase to 0.45; (3) the values of hydraulic conductivity will be dependent on the porosity, as seen in Eq. (1) (Vieno and Nordman, 1998); and (4) the values of distribution coefficients (Dc) for both cement and biosphere (ICRP, 2012) are given in Table 1 and will change over time, as shown in Table 2.
Radionuclide
Half-life
DcPhanerozoic sedimentary rocks (cm3/g)
Dccement (cm3/g)
Activity considered (Bq)
Co-60
5.27 years
50
100
3
Ni-59
7.5
years
50
1000
5.0
Sr-90
29 years
2
1
2
Tc-99
6 h
0.0
50
9
I-129
1.6
years
0.20
1
1
Cs-135
2.3
years
50
10
2
Cs-137
30 years
50
10
6
Pu-238
87.7 years
500
100
2
Pu-239
2.41
years
500
100
1
Pu-240
6560 years
500
100
4
Pu-241
14 years
500
100
3
Am-241
432 years
40
50
2
Radionuclide
Dc (cm3/g) for cement in different time scales
t = 0 year
t = 100 years
t = 500 years
t = 1000 years
Co
100
63.1
10.0
1.00
Ni
1000
631
100.2
10.0
Sr
1
0.63
0.10
0.01
Tc
50
31.5
5.00
0.50
I
1
0.63
0.10
0.01
Cs
10
6.31
1.00
0.10
Pu
100
63.1
10.0
1.00
Am
50
31.5
5.00
0.50
The distribution coefficient provided is defined as the ratio of solute concentration in the solid material (cement/rock) to the solute concentration in the surrounding water.
Also, Table 1 contains half-life and hypothetical radionuclide inventory after repository closure. However, actual inventory can be implemented in this model for more accurate estimation.
Given that the performance history of cement is quite short compared to the long time periods considered for the performance of NSDR, there is some uncertainty in predicting the long-term integrity of cement. To address this uncertainty, the estimated time required for radionuclides to transit each compartment in the model will be added to 100 years (ICRP, 2012). Under the assumption that the force of the water column above the upper cover is negligible, the speed of water that infiltrates the upper cover is equal to the hydraulic conductivity. The equations that better address the change of hydraulic conductivity, porosity, and specific mass with time are respectively:
The retardation factor (RF) for each radionuclide in the inventory is estimated by:
To estimate the speed of water (vw), Darcy’s equation for the flow of a fluid through a porous medium was adopted. The speed of radionuclide (vr) is basically the speed of water divided by the retardation factor:
The mean passage time was estimated by dividing each barrier thickness by the speed of water for barriers [(1) and (2)] and speed of radionuclide for barriers [(3), (4), (5), and (6)]. Therefore, the mean time to collapse (MTTC) of each cover is equal to the water mean passage time for barrier (1) and (2) or radionuclide transit time for barrier (3), (4), (5), and (6).
After establishing the equations for water/radionuclide speed, mean passage time, and MTTC, the activity release due to the collapse of this hypothetical repository will be estimated using Bateman’s equation (Cho et al., 1992), which describes the abundances and activities in a decay chain as a function of time, based on the decay rates and initial abundances. The activity release is the product of probability density function (PDF) and the activity (Aguiar and Damaso, 2010, 2011).
Where,
is activity release per year (Bq/y),
is probability density function ( ),
A(t) is activity at a given time (Bq),
is initial activity (Bq),
is decay constant ( ),
, and
, , , , , are collapse rates for barriers (1), (2), (3), (4), (5), and (6) respectively.
Mathematical calculations were performed using Mathcad (version 15; PTC, Mathsoft; Massachusetts, USA).
3 Results
The retardation factors (RF) for each radionuclide were calculated in both cement and biosphere using Eq. (5) and the results are listed in Table 3. The MTTC for each barrier is listed in Table 4.
Radionuclide
RFc
RFg
Ni
2054.5
176.1
Co
206.3
176.1
Sr
3.0
8.0
Tc
103.6
1
I
3.0
1.7
Cs
21.5
176.1
Pu
206.3
1752.7
Am
103.6
141.1
Cm
103.6
141.1
Radionuclide
MTTC (year)
(1)
(2)
(3)
(4)
(5)
(6)
Co
110
103.5
1.1 × 10⁵
1.1 × 10³
5.3 × 10²
2.9 × 10²
Ni
110
103.5
1.0. × 106
1.0 × 10⁴
4.4 × 10³
1.9 × 10⁴
Sr
110
103.5
1.7 × 10³
1.1 × 10²
1.0 × 10²
1.2 × 10²
Tc
110
103.5
5.5 × 10⁴
6.2 × 10²
3.2 × 10²
1.9 × 10²
I
110
103.5
1.7 × 10³
1.1 × 10²
1.0 × 10²
1.2 × 10²
Cs
110
103.5
1.1 × 10⁴
2.0 × 10²
1.4 × 10²
1.2 × 10²
Pu
110
103.5
1.1 × 10⁵
1.1 × 10³
5.3 × 10²
2.9 × 10²
Am
110
103.5
5.5 × 10⁴
6.0 × 10²
3.2 × 10²
1.9 × 10²
Equation (7) was used to estimate the activity release rate in the biosphere for each radionuclide, and the results are illustrated by radionuclide in Figs. 3, 4, and 5.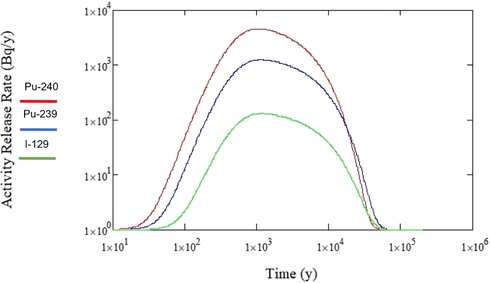
Activity release rate in the biosphere for Pu-240, Pu-239, and I-129.
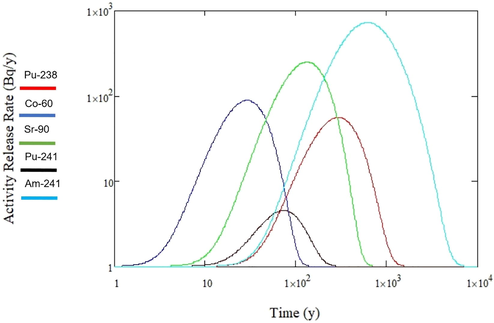
Activity release rate in the biosphere for Pu-238, Co-60, Sr-90, Pu-241, and Am-241.
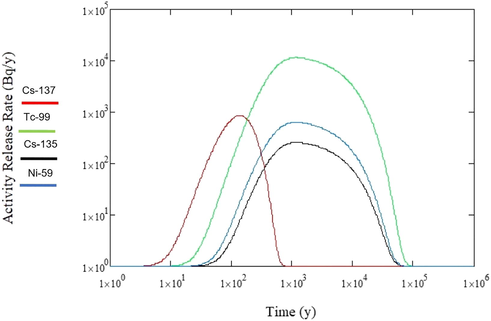
Activity release rate in the biosphere for Cs-137, Tc-99, Cs-135, and Ni-59.
4 Discussion
The results show there is a direct proportionality between distribution coefficient, retardation factor, and the MTTC. MTTC in cement is higher for nickel because it has the highest value of distribution and retardation coefficient among all other radionuclides.
The results from the calculated retardation factor (RF) for each radionuclide in the inventory (Eq. (5)) shows that nickel, cobalt, and plutonium have the highest RF values and are expected to move the slowest through the model compared to other radionuclides. Similarly, technetium, iodine, and strontium have the lowest RF values and are expected to move the fastest through the biosphere compared to other radionuclides. As a result, technetium, iodine, and strontium are predicted to accumulate faster in the biosphere, whereas nickel, cobalt, and plutonium are predicted to accumulate slower in the biosphere.
However, these tendencies are somewhat changed: a radionuclide with a longer half-life needs more mass to produce a particular amount of activity compared to a shorter half-life radionuclide. Also, a long half-life radionuclide needs a longer time to reach its highest cumulative activity in the biosphere, despite its speed through the model and biosphere.
These results show that Co-60, which has the shortest half-life among all the radionuclides in the inventory, reached its highest cumulative activity of 88 Bq in the shortest time (29 years). Likewise, the other radionuclides with a moderately short half-life, such as Pu-241, Sr-90, Cs-137, and Pu-238, reach their respective highest cumulative activity of 4.5, 250, 858, and 56 Bq in 73, 130, 140, 290 years respectively. Moreover, radionuclides with a long half-live, such as Am-241, Pu-240, Pu-239, I-129, Tc-99, Ni-59, and Cs-135, reached their respective highest cumulative activity of , , , , , , and Bq in , , , , , , and years respectively.
In general, the deduction in cumulative activity in the biosphere is due to radionuclide decay. Thus, the cumulative activities of long half-life radionuclides are continued over long periods of time. For long half-life radionuclides, the values for highest cumulative activity in the biosphere are the largest portions of initial activity enclosed in the repository. Of note, the results of this study are specific to this particular disposal facility site.
5 Conclusion
A mathematical model was used to estimate the activity release from near surface disposal repository for a hypothetical open pool light-water research reactor (OP-LWR) in Riyadh, Saudi Arabia. For this model, the hydraulic conductivity, specific mass, and porosity of the cement and the local geosphere were considered, as well as the expected radioactive waste inventory produced by OP-LWR. The results show that there is a direct proportionality between distribution coefficient, retardation factor, and the MTTC. Also, they reveal that nickel has the highest MTTC among all the other radionuclides in the proposed model. The highest cumulative activity release in the biosphere was found to be Bq for Tc-99 after 1300 years. The impact of the radiological behavior of each selected radionuclide enabled finding the effect on the repository performance.
Funding
None.
Acknowledgement
Authors extend their appreciation to the College of Applied Medical Sciences Research Center and Deanship of Scientific Research at King Saud University for funding this project.
Declaration of Competing Interest
The authors declare that they have no known competing financial interests or personal relationships that could have appeared to influence the work reported in this paper.
References
- A reliability engineering study for a near surface radioactive waste repository using genetic algorithm. In: Fifth International Conference on Waste Management and the Environment, Beijing. 2010. p. :235-246.
- [CrossRef] [Google Scholar]
- Probabilistic modelling for liquid release rate of radionuclides to the biosphere from near surface radioactive waste repository for post-closure phase. In: International Nuclear Atlantic Conference. Belo Horizonte INIS-BR–10537. 2011. p. :24-28.
- [Google Scholar]
- Modelling of permeability in cement-based materials: Part 1-uncracked medium. Cem. Concr. Res.. 1997;27(5):761-775.
- [Google Scholar]
- Uncertainty analysis of safety assessment for high-level radioactive waste repository. Waste Manage.. 1992;12(1):45-54.
- [Google Scholar]
- The joint convention on the safety of spent fuel management and on the safety of radioactive waste management. Int. Comp. Law. Q.. 1998;47(2):409-425.
- [Google Scholar]
- International Atomic Energy Agency, 2002. Scientific and Technical Basis for the Near Surface Disposal of Low and Intermediate Level Waste. Technical Reports Series No. 412, IAEA, Vienna.
- International Atomic Energy Agency, 2004. Safety Assessment Methodologies for Near Surface Disposal Facilities. IAEA Non-serial Publication, IAEA, Vienna
- International Atomic Energy Agency, 2007. Categorizing Operational Radioactive Wastes. IAEA-TECDOC-1538, IAEA, Vienna.
- International Atomic Energy Agency, 2009a. Utilization Related Design Features of Research Reactors: A Compendium. Technical Reports Series No. 455, IAEA, Vienna.
- International Atomic Energy Agency, 2009b. Radiation Protection and Radioactive Waste Management in the Design and Operation of Research Reactors. IAEA Safety Standards Series No. NS-G-4.6, IAEA, Vienna.
- International Atomic Energy Agency, 2009c. Classification of Radioactive Waste. IAEA Safety Standards Series No. GSG-1, IAEA, Vienna.
- International Commission on Radiological Protection, 2012. Compendium of Dose Coefficients Based on ICRP Publication 60. ICRP Publication No. 119. Ann. ICRP 41(Suppl.), ICRP, Ottawa.
- International Atomic Energy Agency, 2014. Applications of Research Reactors. Nuclear Energy Series No. NP-T-5.3, IAEA, Vienna.
- International Atomic Energy Agency, 2015. Research Reactor Benchmarking Database: Facility Specification and Experimental Data. Technical Reports Series No. 480, IAEA, Vienna.
- International Atomic Energy Agency, 2016. Safety of Research Reactors. Safety Standards Series No. SSR-3, IAEA, Vienna.
- Probabilistic safety assessment model for near surface radioactive waste disposal facilities. Environ. Modell. Softw.. 1999;14(5):447-460.
- [Google Scholar]
- The Saudi Geological Survey, 2017. Landforms of Saudi Arabia. https://sgs.org.sa/en/topics/landforms-of-saudi-arabia/.
- Vieno, T., Nordman, H. 1998. VLJ Repository Safety Analysis. TVO Report No. 1/98, TVO, Finland.


