

Translate this page into:
Estimation of fractional vegetation cover dynamics and its drivers based on multi-sensor data in Dera Ismail Khan, Pakistan
⁎Corresponding author. zhangxl@bjfu.edu.cn (Xiaoli Zhang)
-
Received: ,
Accepted: ,
This article was originally published by Elsevier and was migrated to Scientific Scholar after the change of Publisher.
Peer review under responsibility of King Saud University.
Abstract
Time series study about the changes in Fractional Vegetation Cover (FVC) with its drivers is studied. From 2003 to 2013, FVC was calculated using remotely sensed data from the Moderate Resolution Imaging Spectroradiometer-Normalized Difference Vegetation Index (MODIS-NDVI), Landsat-7, Defense Meteorological Satellite Program/Operational Linescan System (DMSP/OLS), and Compound Night Light Index (CNLI). The mean value of FVC is 0.34 (34 %). The findings indicate that the highest annual mean values are between 34% and 37%, and 31% and 33%, that correspond to level of 70% and 40%, respectively. The trend analysis by MODIS and Landsat-7 has the low (10%) FVC in the northern parts due to increase in industrial development, urbanization, changes in landuse, landcover and other linked environmental factors. The southwestern-southeastern and eastern areas showed medium (40 %) and high (70 %) FVC respectively. This is because of water availability and less human disturbance.
Keywords
Timeseries
NDVI
MODIS
Landsat
Dynamics
Driving forces

1 Introduction
The terrestrial environment is a critical component of the global village, serving the primary purpose of regulating human survival and preserving the global structure and function (Liu et al., 2019). The terrestrial ecosystem's vegetation is an important factor. It depicts the variation in the ecological environment and the surface vegetation cover (Wen et al., 2013). FVC is important in the modeling of biophysical processes like transpiration, photosynthesis, and evaporation (Chen and Gillieson, 2009).
FVC has already been used to monitor ecosystems and to investigate erosion of soil. The assessment of the FVC has big effects for both environmental and social aspects. (Herrick et al., 2009). Extremely important concerns influencing FVC are rising human activity and ecosystem changes, as predicted by ecological and climatic model predictions (Yang et al., 2010). Environmental policies, as well as global climatic fluctuations, have had a considerable impact on the vegetation, which has changed considerably over time (Matteucci et al., 2016). FVC is being used by a number of experts to understand drivers and principles of spatial change (Cao et al., 2015).
Temperature has a negative influence on plants usually, but rainfall has a positive impact. The main factors that influence the browning and greening of plants are population growth and human-caused acts (Huang et al., 2014). Leading features as well as computed fluctuating changes in vegetation from remotely sensed data are studied by Tong et al. (2016).
FVC is easy to calculate due to the extensive use of digital photography (Chen et al., 2010). Remote sensing has always been regarded as the most effective tool for estimating FVC (Barati et al., 2011). For monitoring changes in vegetation, satellite-based remote sensing is required (Zhan et al., 2002). Landsat Thematic Mapper (TM), linear regression model was used for estimating the FVC in semi-arid region (Graetz et al., 1988). Fractional Vegetation Cover was calculated using data of Landsat (soil-adjusted vegetation index (SAVI) and NDVI) described by Buyantuyev et al. (2007).
Landsat has been widely used in several plant-related studies during the previous decades. MODIS, among the several distant sensors, possesses the necessary properties for detecting natural vegetation degradation and supplying global data (Usman et al., 2015). Furthermore, CNLI, which give information about urbanization, socio-economic activities, light, energy, settlements, power consumption, and gas emissions. These are the most essential driving forces for FVC (Shobairi et al., 2018). In order to analyze human activities, the conventional census system uses uncommon data and advanced technology, such as nighttime light emissions (NTLEs) (Bagan and Yamagata, 2015).
The study's primary objective is to estimate the Fractional Vegetation Cover at regional level and to investigate the dynamics, time series, classification as well as trend analysis of the FVC using MODIS-Terra and Landsat ETM+ data. Finally, the drivers of FVC from 2003 to 2013 are discussed, including human activities and climate factors. The investigation of FVC drivers in Dera Ismail Khan using night light data from remote sensing is innovative. The analyses showed that FVC characteristics are spatially and temporally dynamic and provide an accurate explanation of vegetation cover changes. By using remote sensing data we also acquired information such as which factor is more responsible for FVC changes in the research area and how vegetation cover has changed during previous years.
2 Material and methods
2.1 Study area
District Dera Ismail Khan is the southernmost district of the Khyber Pakhtun Khwa (KPK), Pakistan with an average elevation of 173 m above sea level, lying between 31°.15′ and 32°.32′, north latitude and 70°.11′, and 71°.20′, east longitude (Usman et al., 2016). District's total size is 0.896 mha, with 33 percent of that being suitable for cultivation (Khan, 2003). Dera Ismail Khan has a continental climate with noticeable temperature changes both seasonally and daily, as well as a high level of dryness. The average annual rainfall of area ranges from 180 mm to 200 mm. In the winter, the average maximum and minimum temperatures are 20.3 °C and 4.2 °C, respectively, in contrast to 42 °C and 27 °C in the summer (Marwat et al., 2012). Fig. 1 shows the map of Dera Ismail Khan.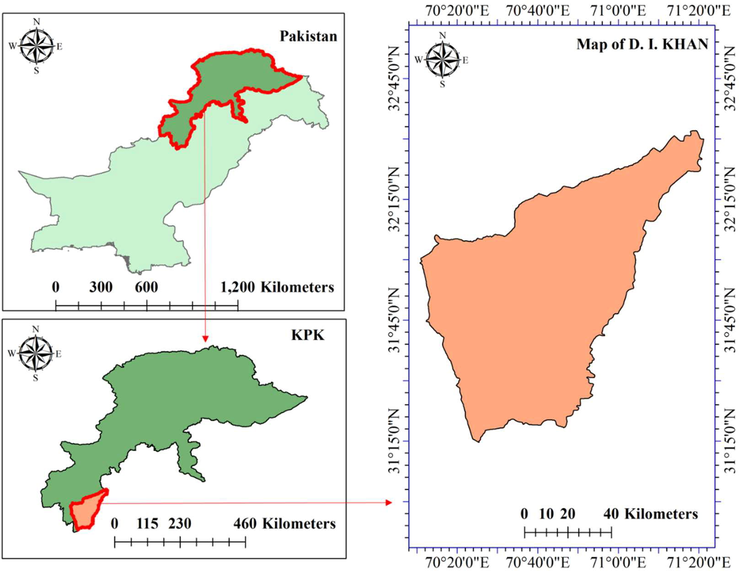
The study area's geographical location.
2.2 Process method and data source
We used MODIS's level-3 16-Day vegetation collection (MOD13Q1) products, with 250 m spatial resolution. These data were downloaded from the MODIS website (Didan et al., 2015). The majority of Landsat 7 images used for the prediction of NIR and red surface reflectance were close to 100% cloud free. MODIS-Terra has very low spatial resolution compared to Landsat ETM+ (250 m vs 30 m). But MODIS has a better temporal resolution compared to Landsat (daily vs 16-day repeat cycle) as well as Landsat has a better spatial resolution as compared to MODIS. The full scene of Landsat and MODIS-based NDVI maps in the same year showed overall similar distributions. MODIS and Landsat data were reprojected from a sinusoidal to a UTM projection. NDVI data were resampled to MODIS NDVI (250 m) spatial resolution for direct comparisons between MODIS-Terra and Landsat 7. The boxcar approach was used for resampling while adjusting the pixel sizes. Averaging all the 250 m NDVI pixels from Landsat and MODIS that fell within a 250 m MODIS pixel gave the 30 m pixel value (Albarakat and Venkataraman, 2019).
The Landsat 7, Collection 1, Tier 1, 8-Day NDVI composite from the United States Geological Survey (USGS) was chosen. The Normalized Difference Vegetation Index was then calculated from Eq. (3). This satellite has datasets available from 1999 to the present, with a spatial resolution of 30 m. For the NDVI, I used Landsat 7 (2003–2013). Following that, the NDVI data is coded in GEE and exported annually. After exporting, I opened the .tif file in ArcGIS and used the scan line error tool to remove image strips. To perform the calculation, used the “Raster Calculator” tool in the Spatial Analyst toolbar. Eq. (4) is used to calculate FVC (Robinson et al., 2017).
The other dataset covers the years 2003 to 2013 and includes DMSP/OLS satellites for example F14, F15, and F16. A wide range of visible and near-infrared (VNIR) emissions can be identified using the data of DMSP/OLS. National Oceanic and Atmospheric Administration's website provided information of DMSP/OLS (Shobairi et al., 2018).
2.2.1 Land surface temperature data
MODIS LST and Monthly Emissivity Level 3 (L3) Worldwide 0.05° climate modelling grid (CMG) V006 (MOD11C3) information were used to obtain Land Surface Temperature (LST) data. In order to use a night/day algorithm that helps in monitoring clear-sky observations between 10:30 a.m. and 10:30p.m., the data was recovered. MOD11C3 product is a latitude/longitude CMG which has 5.6 km image resolution that is designed on a 0.05°. The LST data types for daytime and nighttime are both unsigned 16-bit integers in degrees kelvin. The LST valid values range is 7500–65635, with a scaling factor of 0.02 used to calculate mean by using data from several years. For more impressive results, LST was multiplied by the scaling factors (0.02), and then subtracted conversion coefficient (273.15) between Centigrade and Kelvin to convert the temperature in centigrade (Liu et al., 2019).
2.2.2 Rainfall data
Precipitation Estimation from Remotely Sensed Information using Artificial Neural Networks-Climate Data Record (PERSIANN-CDR) was used for Rainfall data. Data of satellite based on daily precipitation comprise the PERSIANN-CDR dataset. It has been acknowledged by National Climatic Data Center (NCDC), a NOAA CDR programme, as a source of high-resolution precipitation records for studies of climate around the world (Santos et al., 2021). PERSIANN-CDR is a tool that can be aid to evaluate worldwide rainfall patterns (Miao et al., 2015).
2.3 Calculation of FVC
Pixel dichotomy model (PDM) was used in this study to investigate FVC because of its high handling capability. Most probably, the pixel contained information about soil and vegetation. The pixel with FVC contains the fraction of spectral data of vegetation (Jiapaer et al., 2011). The PDM equation is as follows:
VI stands for vegetation index, VIveg for vegetation index with vegetation pixel, and VIsoil for vegetation index with soil pixel (Li et al., 2014). NDVI was considered to be the most accurate indicator of vegetation density and crop growth condition. NDVI allows for more precise data collection on plants while reducing noise from the environment (Hu et al., 2017). When we replace VI with NDVI in Eq. (1), we get the FVC equation as follows:
Vegetation index method was developed for FVC calculation based on Eq. (3) (Huete et al., 2002). We used ArcGIS to calculate NDVI using Eq. (3).
The NDVI, SAVI, and RVI are all recommended VIs (Liu et al., 2019). There was an independent variable called NDVI that we used in the linear model.
For monthly FVC values, the NDVIveg and NDVIsoil are replaced by NDVImax and NDVImin, respectively, in Eq. (2) (Ge et al., 2018). The FVC was calculated using Eq (4). As NDVImin is the value at which the NDVI is the minimum and NDVImax is the value at which the NDVI is the maximum (Fig. 2).
Low, medium, and high were three classes of FVC in 11 years.
2.4 FVC spatial distribution at different period and FVC spatio-temporal dynamics
Statistical Package for the Social Sciences (SPSS) software was used for the analysis of time series by yearly information of FVC from 2003 to 2013. An expert modeler's time series forecasting module is used to fit yearly FVC information for forecasting. We used linear trend test to investigate FVC dynamics as variable which depend on time (Kirkman et al., 2013). When using the NDVI dataset to detect changes in vegetation, linear trend analysis is perhaps the most widely used method. Linear trend analysis uses a simple linear regression model between vegetation index value and time to depict time-based trends within the NDVI dataset (Fensholt et al., 2009).
2.5 Calculation of CNLI
Eq. (5) was used to calculate CNLI using DMSP/OLS data.
I denotes average brightness of all lit pixels in given location at night as follows.
P is ultimate beginning point for the identification of cities with lights from DMSP/OLS imageries. DNi indicates value of DN's ith grey level, fitting to ith gray level and lit pixels number is ni. Maximum DN value is DNM, and total number of lighted pixels with DN value between P and DNM is NL. Illuminated cities ratio to total area of specified region is denoted by the letter S as follows:
2.6 Analysis of the driving forces affecting the dynamics of the FVC
To study link between vegetation changes and socio-economic components quantitatively we conducted analysis of correlation to determine their correlations using Pearson correlation coefficients. There were however, links between each component (Zhu et al., 2016). For determining the correlation between FVC, CNLI, and climatic factors, the Pearson correlation coefficient was confirmed (Fig. 3).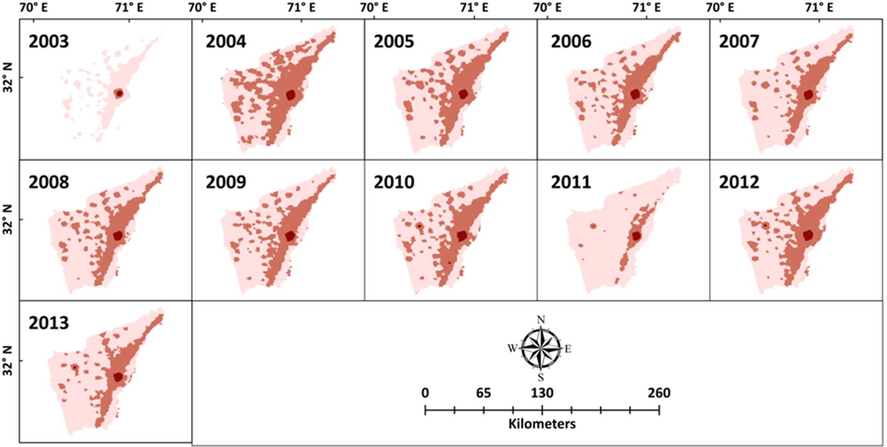
DMSP/OLS nighttime lights during 2003 and 2013.
3 Results and discussion
3.1 FVC spatio-temporal dynamics from MODIS
To fit the yearly FVC data, an expert modeler’s time series forecasting module was used (Shobairi et al., 2018). We found annual changes in FVC from 2003 to 2013. The FVC value in 2005, 2007, 2008, 2009, 2010, 2011, 2012 and 2013 was above the mean (34%). FVC values were below the average in 2003, 2004 and 2006. According to (Chand et al., 2006) in 2003, 2004 and 2006 a small number of areas had severe drought seasons. Throughout this timeframe, rainfall was low and daylight hours were unusually long, which was unlikely to increase vegetation growth and result in reduced annual FVC. Unpredictably, average annual precipitation was more than 20.24 (inches) in the years 2005, 2007, 2009, and 2013, causing a large vegetation area to grow and setting off increased FVC.
To examine FVC dynamics as variable which depend on time, we used a linear trend test (Kirkman et al., 2013). FVC was lower in 2003, 2004 and 2006 whereas it was higher in the remaining years, as displayed in Fig. 4. FVC is divided into low, medium, and high class. The spatial distribution of FVC in northern regions was low (10%) throughout these 11 years due to human disturbance. Due to less human disturbance, the southeast- southwest and the eastern regions are occupied by medium (40%) and high (70%) classes, respectively. Regional differences in economic development, urbanization, and climatic conditions are all strongly linked to spatial pattern. Because of less human disturbance and water accessibility on the eastern plains of the research area, industrialization has not fully developed, resulting in increased FVC. Human disturbance is a concern in the northern region, where water is scarce, resulting in a low FVC.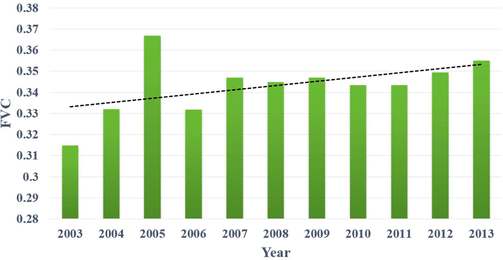
FVC Trend dynamics during 2003 to 2013.
3.2 FVC spatio-temporal dynamics from Landsat-7 data
The results of the FVC trends analysis demonstrate the increase of vegetation growth from 2003 to 2013 (Fig. 5). To assess the FVC dynamics as a time-dependent variable, we applied the linear trend test (Kirkman et al., 2013). FVC value was more than average (0.34) in 2005, 2007, 2009, 2012, and 2013, however FVC value was lower than 0.34 in 2003, 2004 and 2006, as shown in Table 1. From Landsat-7 data, we classified the FVC in low, medium, and high class. FVC in the northern regions of the research area was typically low (10%) over the aforementioned years due to disturbance and decreased precipitation. Due to the overall economy and water accessibility in the southwestern and eastern parts, medium (40%) and high (70%) classes, were observed respectively. The spatial distribution is basically linked to regional changes in industrial development, urbanization, and climatic conditions. There was less human interference and easier access to water in the eastern regions, resulting in higher FVC.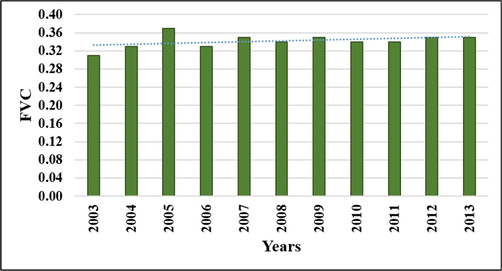
FVC Trend dynamics from 2003 to 2013 through Landsat 7.
Years
FVC
2003
0.31
2004
0.33
2005
0.37
2006
0.33
2007
0.35
2008
0.34
2009
0.35
2010
0.34
2011
0.34
2012
0.35
2013
0.35
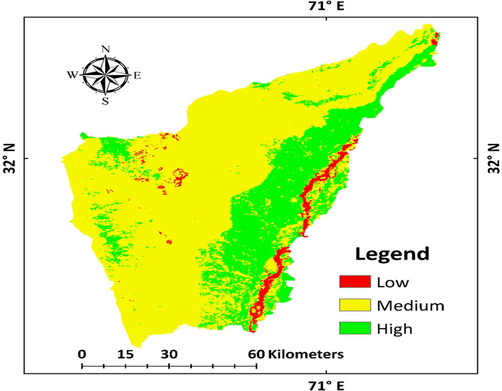
The high spatial resolution of the Landsat-based image resulted in many homogeneous pixels with either high or low NDVI. The low spatial resolution of the MODIS-based map resulted in many mixed pixels consisting partly of high NDVI and partly of low NDVI (Fig. 6). As shown in graphs of Landsat and MODIS mean values are very similar.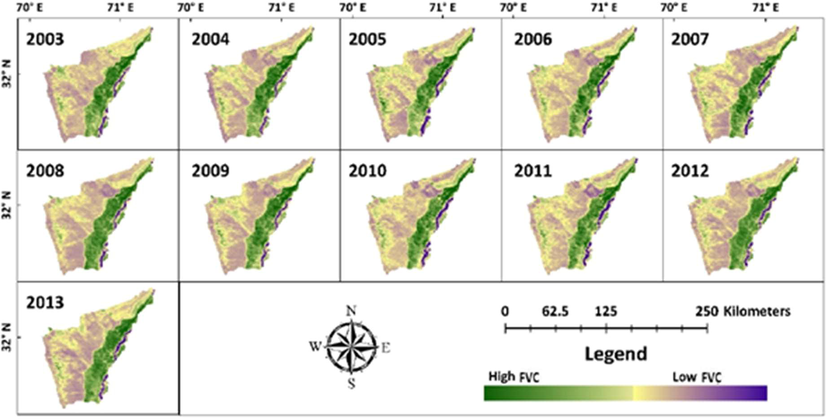
FVC map of Dera Ismail Khan.
3.3 CNLI and DMSP/OLS spatial patterns
From 2003 to 2013, the level of urbanization as well as human economic activity was determined mainly by determining the CNLI, as indicated in Fig. 7. CNLI changes were observed when DMSP/OLS information was calculated, indicating that urbanization was more common in low vegetation cover areas. Urbanization, mining, agroindustry, and population all are linked to CNLI. Vegetation in the study area has declined as a result of these factors. The CNLI, as shown in Fig. 7, is an important indicator for analyzing the urbanization trend. DMSP/OLS night-time satellite informative indexes detected wildfire regions with 98 percent accuracy in combination with field observations and multi-satellite informative indexes (Chand et al., 2006). DMSP-OLS is linked to human activities and has an impact on changes in land cover. Each year, economic activity, urbanization, and industrialization increase, which has vast consequences.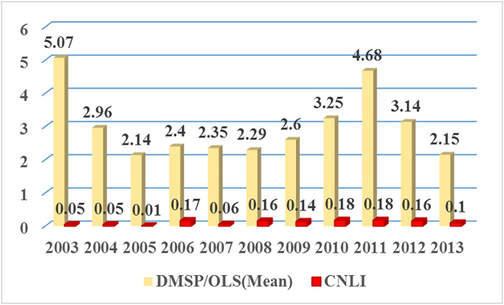
Dynamics of CNLI and DMSP/OLS (Mean) in Dera Ismail Khan during 2003 to 2013.
3.4 FVC driving forces
Its is notable that during the 11 years, when CNLI and temperature increased, the spatial distribution of FVC decreased. That trend has a strong link to cities development and industrial development trends. It was determined that numerous elements, including anthropogenic activities, climate, and environmental influences, are believed to be the key factors of changes in FVC. As shown in Table 2, Pearson correlation coefficient is used to study link between rainfall, temperature, CNLI and FVC. Mean annual rainfall (inches) is positively correlated with FVC, however the mean annual temperature is negatively correlated.
Additionally, negative correlation exist between FVC and CNLI. Significant positive correlation between Fractional Vegetation Cover and rain is explained by the fact that loss of water is reduced during rain season, due to this the process of photosynthesis was not affected negatively, resulting in higher FVC. Urbanization and industrial development have a negative impact on the yearly mean FVC.
The FVC for each period is altered and changed by CNLI and climatic conditions, as shown in Table 3.
Year
FVC (mean)
Temperature (° C)
Rainfall (inches)
CNLI
2003
0.314842231
25.26
17.11
0.05
2004
0.33209781
24.52
18.14
0.05
2005
0.366884609
22.27
21.18
0.01
2006
0.331749203
26.33
17.18
0.17
2007
0.346999204
25.34
24.57
0.06
2008
0.34494997
25.69
19.41
0.16
2009
0.346999204
25.22
22.23
0.14
2010
0.343378745
26.67
18.07
0.18
2011
0.343378745
26.67
18.06
0.18
2012
0.34944997
25.82
19.07
0.16
2013
0.35494997
25.17
27.69
0.1
4 Conclusions
NDVI images from MODIS-Terra, Landsat-7 data, LST, rainfall data and DMSP/OLS datasets were used to study FVC variations in district Dera Ismail Khan Pakistan from 2003 to 2013. An analysis of time series shows that the average value is 34%. The significant impact of temperature, rainfall, and CNLI on FVC is observed in annual results. The highest percentages are 40% for the medium class and 70% for the high class, with a dramatic trend in the southeast-southwest and eastern regions. Similarly, FVC from Landsat data (2003–2013) was classified as low at 10%, medium at 40%, and high at 70%. The FVC trend in northern parts was found to be less than 10%, however in southeast-southwest and eastern parts, it was found to be up to 40% and 70%, respectively. Due to suitable conditions, a high value of FVC was discovered in the eastern region. Additionally, industrialization, urbanization, and a variety of other climatic factors influence the spatial pattern of FVC. With the importance of this research in mind, a further analysis will focus on FVC estimation for atmospheric impacts, and multi-sensor time series can be obtained using surface reflectance estimates.
Funding
This dataset is made available through the project of the National Key R&D Program of China project, “Research of Key Technologies for Monitoring Forest Plantation Resources” (2017YFD0600900).
CRediT authorship contribution statement
Shoaib Ahmad Anees: Conceptualization, Data curation, Formal analysis, Methodology, Writing – original draft, Writing – review & editing. Xiaoli Zhang: Supervision. Khalid Ali Khan: Writing – review & editing. Manzar Abbas: Writing – review & editing. Hamed A. Ghramh: Writing – review & editing. Zubair Ahmad: Writing – review & editing.
Acknowledgements
We would like to express our gratitude to the Beijing Key Laboratory of Precision Forestry, Forestry College, Beijing Forestry University, Beijing (100083), P. R. China, for providing assistance and platforms for this research. The authors also extend their appreciation to the support of the Research Center for Advanced Materials Science (RCAMS) at King Khalid University, Abha, Kingdom of Saudi Arabia through a project number RCAMS/KKU/G003-21.
Declaration of Competing Interest
The authors declare that they have no known competing financial interests or personal relationships that could have appeared to influence the work reported in this paper.
References
- 'Comparison of normalized difference vegetation index derived from Landsat, MODIS, and AVHRR for the Mesopotamian marshes between 2002 and 2018. Remote Sensing. 2019;11:1245.
- [Google Scholar]
- Analysis of urban growth and estimating population density using satellite images of nighttime lights and land-use and population data. GIScience Remote Sensing. 2015;52(6):765-780.
- [Google Scholar]
- Comparison the accuracies of different spectral indices for estimation of vegetation cover fraction in sparse vegetated areas. Egypt. J. Remote Sensing Space Sci.. 2011;14(1):49-56.
- [Google Scholar]
- Estimating vegetation cover in an urban environment based on Landsat ETM+ imagery: a case study in Phoenix, USA. Int. J. Remote Sens.. 2007;28(2):269-291.
- [Google Scholar]
- Impacts of land use and land cover change on regional climate: a case study in the agro-pastoral transitional zone of China. Environ. Res. Lett.. 2015;10(12):124025.
- [Google Scholar]
- Monitoring forest fires over the Indian region using Defense Meteorological Satellite Program-Operational Linescan System nighttime satellite data. Remote Sens. Environ.. 2006;103(2):165-178.
- [Google Scholar]
- Digital photograph analysis for measuring percent plant cover in the Arctic. Arctic 2010:315-326.
- [Google Scholar]
- Evaluation of Landsat TM vegetation indices for estimating vegetation cover on semi-arid rangelands: a case study from Australia. Canadian J. Remote Sensing. 2009;35(5):435-446.
- [Google Scholar]
- MODIS Vegetation Index User’s Guide (MOD13 series). University of Arizona, Vegetation Index and Phenology Lab; 2015.
- Evaluation of earth observation based long term vegetation trends—Intercomparing NDVI time series trend analysis consistency of Sahel from AVHRR GIMMS, Terra MODIS and SPOT VGT data. Remote Sens. Environ.. 2009;113(9):1886-1898.
- [Google Scholar]
- Modeling alpine grassland cover based on MODIS data and support vector machine regression in the headwater region of the Huanghe River, China. Remote Sens. Environ.. 2018;218:162-173.
- [Google Scholar]
- The assessment and monitoring of sparsely vegetated rangelands using calibrated Landsat data. Int. J. Remote Sens.. 1988;9(7):1201-1222.
- [Google Scholar]
- Bi2WO6 nanosheets decorated with au nanorods for enhanced near-infrared photocatalytic properties based on surface plasmon resonance effects and wide-range near-infrared light harvesting. ChemCatChem. 2017;9(8):1511-1516.
- [Google Scholar]
- Application of DMSP/OLS nighttime light images: A meta-analysis and a systematic literature review. Remote Sensing. 2014;6(8):6844-6866.
- [Google Scholar]
- Overview of the radiometric and biophysical performance of the MODIS vegetation indices. Remote Sens. Environ.. 2002;83(1–2):195-213.
- [Google Scholar]
- A comparison of methods for estimating fractional vegetation cover in arid regions. Agric. For. Meteorol.. 2011;151(12):1698-1710.
- [Google Scholar]
- Facts about AZRI. Pakistan Agricultural Research Council, Arid Zone Research Institute Ratta Kulachi DI Khan; 2003. p. :2-4.
- Increased mortality associated with cerebral contusions following trauma in the elderly: bad patients or bad management? J. Neurotrauma. 2013;30(16):1385-1390.
- [Google Scholar]
- Improving estimates of grassland fractional vegetation cover based on a pixel dichotomy model: A case study in Inner Mongolia, China. Remote Sensing. 2014;6(6):4705-4722.
- [Google Scholar]
- Comparative analysis of fractional vegetation cover estimation based on multi-sensor data in a semi-arid sandy area. Chinese Geogr. Sci.. 2019;29(1):166-180.
- [Google Scholar]
- Marwat, S.K., Usman, K., Khan, E.A., Ghulam, S., Baloch, J., Tauqeer, A.M., Rehman, F.U., 2012. Ethnobotanical studies on dwarf palm (Nannorhops ritchieana (Griff.) Aitchison) and date palm (Phoenix dactylifera L.) in Dera Ismail Khan, KPK, Pakistan. Am. J. Plant Sci. 3(8), 1162.
- Ecological and social consequences of the Forest Transition Theory as applied to the Argentinean Great Chaco. Land Use Policy. 2016;51:8-17.
- [Google Scholar]
- Evaluation of the PERSIANN-CDR daily rainfall estimates in capturing the behavior of extreme precipitation events over China. J. Hydrometeorol.. 2015;16(3):1387-1396.
- [Google Scholar]
- A dynamic Landsat derived normalized difference vegetation index (NDVI) product for the conterminous United States. Remote Sensing. 2017;9(8):863.
- [Google Scholar]
- Geospatial drought severity analysis based on PERSIANN-CDR-estimated rainfall data for Odisha state in India (1983–2018) Sci. Total Environ.. 2021;750:141258.
- [Google Scholar]
- Dynamic estimation model of vegetation fractional coverage and drivers. Int. J. Adv. Appl. Sci.. 2018;5(3):60-66.
- [Google Scholar]
- Dynamics of fractional vegetation coverage and its relationship with climate and human activities in Inner Mongolia, China. Remote Sensing. 2016;8(9):776.
- [Google Scholar]
- An investigation of the major wheat weeds in different zones of Dera Ismail Khan. J. Bioresource Manage.. 2016;3(3):3.
- [Google Scholar]
- Land use/land cover classification and its change detection using multi-temporal MODIS NDVI data. J. Geog. Sci.. 2015;25(12):1479-1506.
- [Google Scholar]
- Numerical simulations of fractional vegetation coverage influences on the convective environment over the source region of the Yellow River. Meteorol. Atmos. Phys.. 2013;120(1):1-10.
- [Google Scholar]
- Vegetation cover change with climate and land use variation along main stream of Tarim River. J. Desert Res.. 2010;30(6):1389-1397.
- [Google Scholar]
- Detection of land cover changes using MODIS 250 m data. Remote Sens. Environ.. 2002;83(1–2):336-350.
- [Google Scholar]


