Translate this page into:
Estimation of atmospheric turbidity over Adrar city in Algeria
⁎Corresponding author. yacine.marif@yahoo.fr (Y. Marif)
-
Received: ,
Accepted: ,
This article was originally published by Elsevier and was migrated to Scientific Scholar after the change of Publisher.
Peer review under responsibility of King Saud University.
Abstract
Under a cloudless sky atmospheric turbidity causes attenuation of solar radiation reaching the earth's surface. The Linke’s turbidity factor (TL) and the Ångström’s turbidity coefficients (β) are the most frequently used atmospheric turbidity indices. TL and β are a key input for several models that assess the solar radiation under clear skies. In this paper, the Linke and Ångström turbidities were obtained from radiometric and meteorological data recorded in the Sahara desert area of Adrar region, Algeria, during October 2012–May 2015. It is observed that there is a high correlation between atmospheric turbidity caused by aerosols and meteorological parameters. A comparison has also been carried out with results acquired in Ghardaïa and Tamanrasset regions. In addition to verify the appropriateness of the theoretical Linke turbidity factor formula presented in Algerian solar atlas, the monthly mean theoretical values are compared with the experimental monthly average values.
Keywords
Solar radiation
Atmospheric turbidity
Linke factor
Ångström coefficient
Adrar
1 Introduction
Fossil fuels and especially the natural gas is the largest source of electricity production in Algeria. The environmental problems caused by the use of fossil fuels are well known: air pollution, greenhouse gases and aerosol production (Almasoud and Gandayh, 2015). In the last years the electricity consumption has increased with the rapid growth in the residential, commercial and industrial sectors. Renewable energy resources especially solar energy offer interesting opportunities for facing this important increase. This strategic is motivated by the huge potential in solar energy in the south of Algeria. (Marif et al., 2014) have shown that the mean yearly sunshine duration varies from a low of 2650 h on the coastal line to 3900 h. It becomes necessary for Algeria to exploit this important resource for facing the important increase in the electricity consumption. Solar radiation data is generally important for the optimal design of the solar systems. Many approaches have been proposed in several studies to estimate the solar radiation around the world such as empirical, intelligent neural network and satellite models. To estimate the solar radiation in Algeria appropriate methods can be found in the literature. The first correlations for estimating solar radiation in Algeria were proposed by Capderou in the Algerian solar atlas since 1987 (Capdrou, 1987), who developed theoretical approach based on the attenuation effect of the Earth’s atmosphere to estimate the instantaneous direct and diffuse solar radiation on a completely clear day conditions. (Yaiche et al., 2014) created a solar radiation map in Algeria from sunshine duration for all sky types. They found that the relative error is less than 7% between measured and computed values. (Mefti et al., 2003) have estimated the global solar radiation incident on an inclined surface in any site of Algeria using monthly mean daily sunshine duration measurements, in this model the discrepancies observed between the estimated and measured values run from 10% to 35%. In order to correlating monthly mean daily diffuse solar radiation (Boukelia et al., 2014) studied the performance of ten empirical models based on the ratio of monthly mean daily sunshine records to monthly daily mean daylight hours and on the ratio of monthly mean daily global solar radiation data to monthly mean daily extraterrestrial solar radiation at six Algerian stations: Algiers, Constantine, Ghardaia, Bechar, Adrar, and Tamanrasset. This study finds that the quadratic and cubic equation which based on global solar radiation data performed the best accuracy. (Behar et al., 2015) compared the performance of seventeen clear-sky solar radiation models under Algerian climate to select the more accurate one for estimating the direct solar radiation, their results show that the ASHRAE model can offer more precise information about direct normal irradiation in Algeria. Six combined empirical models and a Bayesian neural network (BNN) model have been used by (Yacef et al., 2014) to estimate daily global solar radiation from air temperature on a horizontal surface in Ghardaïa city. After testing, the combined models appear to be more helpful than BNN. Based on the intelligent artificial neural network (ANN), two models have been proposed by (Mellit et al., 2005, 2006) to predict the daily global solar radiation with a sufficient accuracy for any location in Algeria.
Many solar radiation models for clear day refer to the Link turbidity factor and the Ångström turbidity coefficient. These two parameters describe the optical thickness of the atmosphere due to both the absorption by the water vapor and the absorption and scattering by the aerosol particles (Eltbaakh et al., 2012). A review of the literature showed that TL and β can be obtained from several methods. In the clear-sky Algerian solar atlas model, Capderou was derived an empirical equations based on the theoretical approach of Perrin et al. (1982) in order to estimate the Link factor in any locations in Algeria. Kasten (1980, 1966) presented a simple calculation methodology to facilitate the experimental determination of the Link turbidity factor where the pyrheliometric measurements of the direct normal solar irradiation (DNI) on the horizontal plane are known. To determine the Ångström turbidity coefficient, (Pinazo et al., 1995) and (Louche et al., 1987) used the solar irradiance data and the transmittance of aerosols. (Cucumo et al., 1999) developed a general calculation model using experimental data of beam solar irradiation on the horizontal plane and a method developed by Pinazo for the determination of TL and β respectively .By means of the proposed methods, it will be possible to evaluate the Linke factor and the in any areas. For example, the Louche and Pinazo methods were employed by (Danny et al., 2002) to obtain the Ångström coefficient in Hong Kong. In addition, the Link factor was computed using the original Kasten method and the approach developed by (Dogniaux, 1974). In Tunisia, Kasten pyrheliometric method and the empirical formula developed by Dogniaux have been used to examine TL and β by (Trabelsi and Masmoudi, 2011) in Kerkennah Island.
In the Sahara desert of Algeria, the Linke factor and the Ångström coefficient are a very convenient approximation to model the atmospheric absorption and scattering of the extraterrestrial radiation because cloudless skies predominate in these regions. There are only two sites in the Algerian Sahara where the atmospheric turbidity indices are known Ghardaïa and Tamanrasset. TL and β were obtained and studied by (Djafer and Irbah, 2013) in Ghardaïa using Kasten approach and Dogniaux formula. The monthly mean values of the Link turbidity factor were estimated by (Diabaté et al., 2003) in Tamanrasset using the approach proposed by Aguiar in 1995, reported in the European Solar Radiation Atlas (ESRA). The purpose of the study is to increase the knowledge on TL and β turbidity indices in Algeria, the long-term measurements are used in this work to estimate these two indices in Adrar town.
2 Data collection
The data used in this study have been recorded every one or ten minute at the New Energy Algeria station (NEAL) installed at the rooftop of the research unit in renewable energies in the Saharan medium (URERMS) located in Adrar (latitude North 27°53′, longitude East 0°17′ and 264 m above the sea level). Adrar town is facing like most cities in the south of Algeria (Fig. 1), it has a total area of about 427300 km2. His climate is characterized by very high temperature exceeding 45 °C and an intense solar radiation with a maximum of 1000 W/m2, measured on the horizontal surface in long summer season. Winter is short and characterized by very low precipitations. Also, winds are very common throughout the whole year.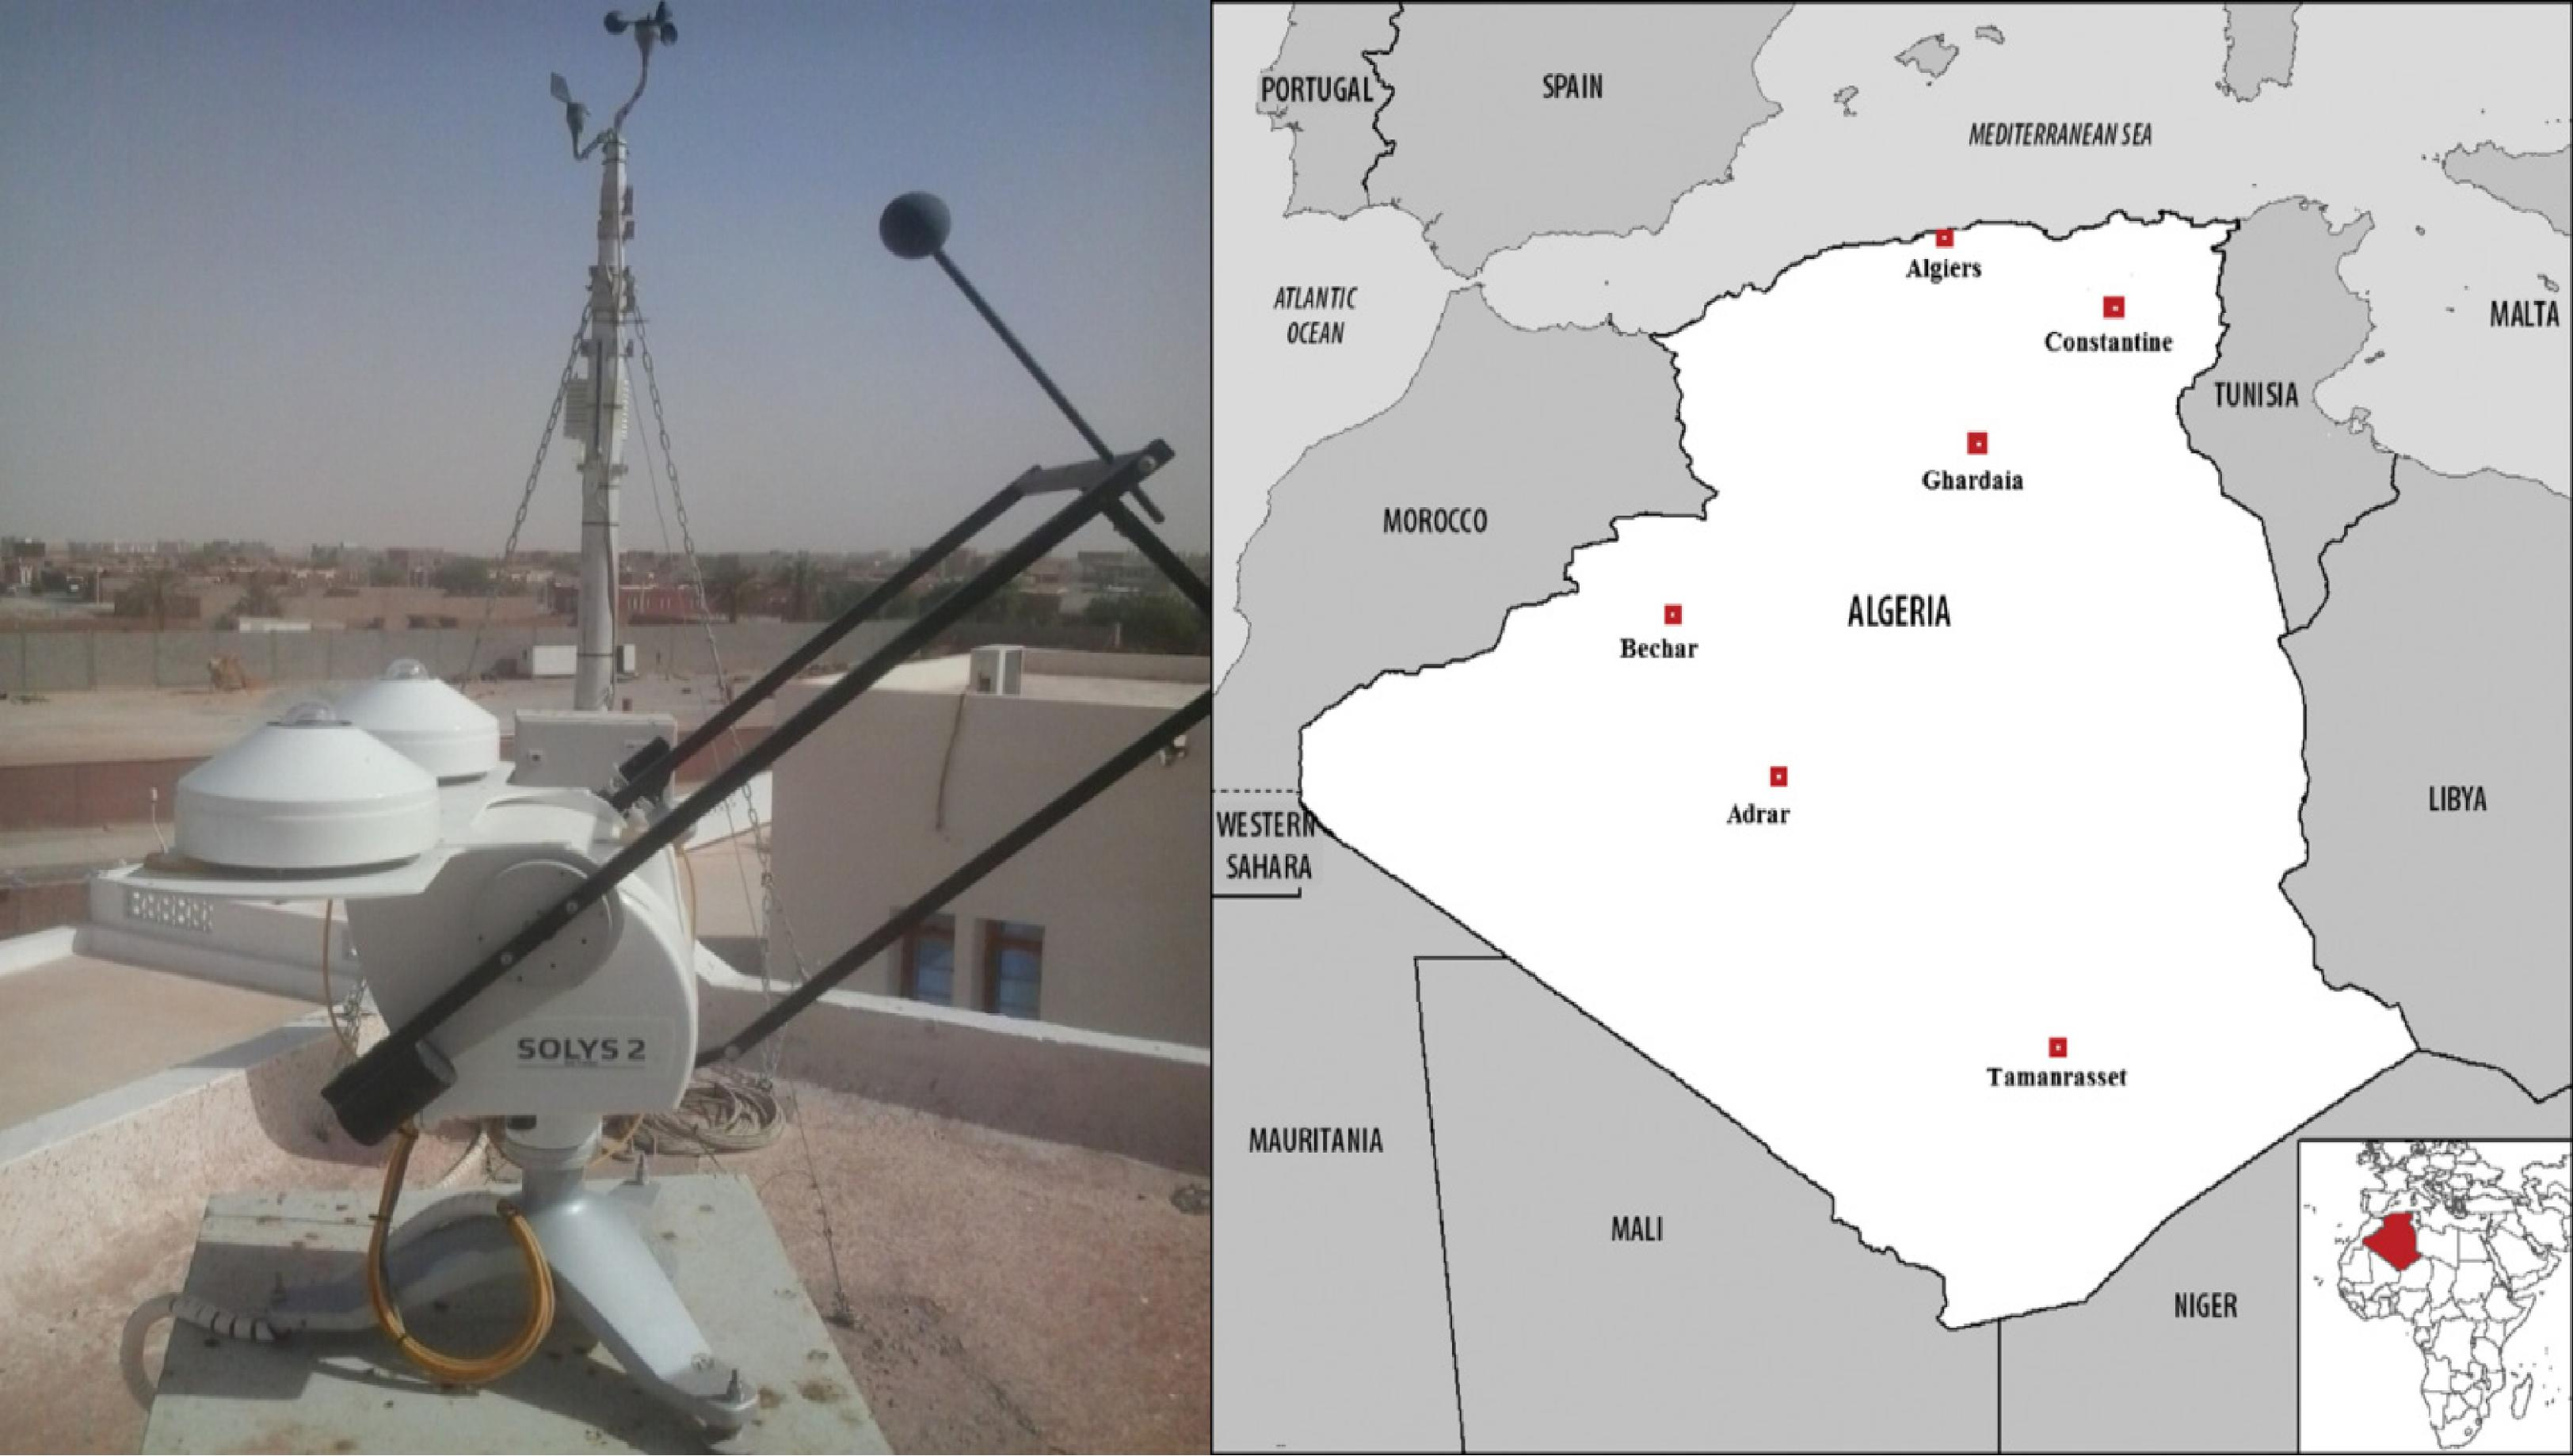
Geographical location of Adrar (right part) and NEAL station instruments (left part).
The NEAL station shown in Fig. 1, houses many radiometric and meteorological sensors. The Direct normal solar irradiation measurements were recorded using a solar tracker with a pyrheliometer. In addition, two pyranometers take global and diffuse measurements of solar irradiance on horizontal surface. The ambient temperature and the relative humidity, both measured with a same probe. The air pressure data were recorded by a barometric pressure sensor and the wind speed by an anemometer. The radiometric data referred to this study regard clear sky conditions, 686 clear days are selected from October 2012 to May 2015. The cloudless sky criteria used by (Cucumo et al., 1999) are adopted. The ratio of diffuse irradiance to global irradiance should be less than 1/3 and the direct normal irradiance is greater than 200 W/m2.
The daily average values of the meteorological parameters at Adrar during 2014 are presented in Fig. 2. The figure indicate that the mean daily ambient temperature varies from a maximum around to 44 °C in summer season (June–August) and a minimum around to 5 °C in winter season (December–February). The mean daily relative humidity varies from a maximum around to 80% in winter and a minimum around to3% in summer. In this year, the amount of the mean daily pressure is in the region of 985 hPa and the maximum value of the daily average wind speed is recorded in summer, this value exceeding 10 m/s.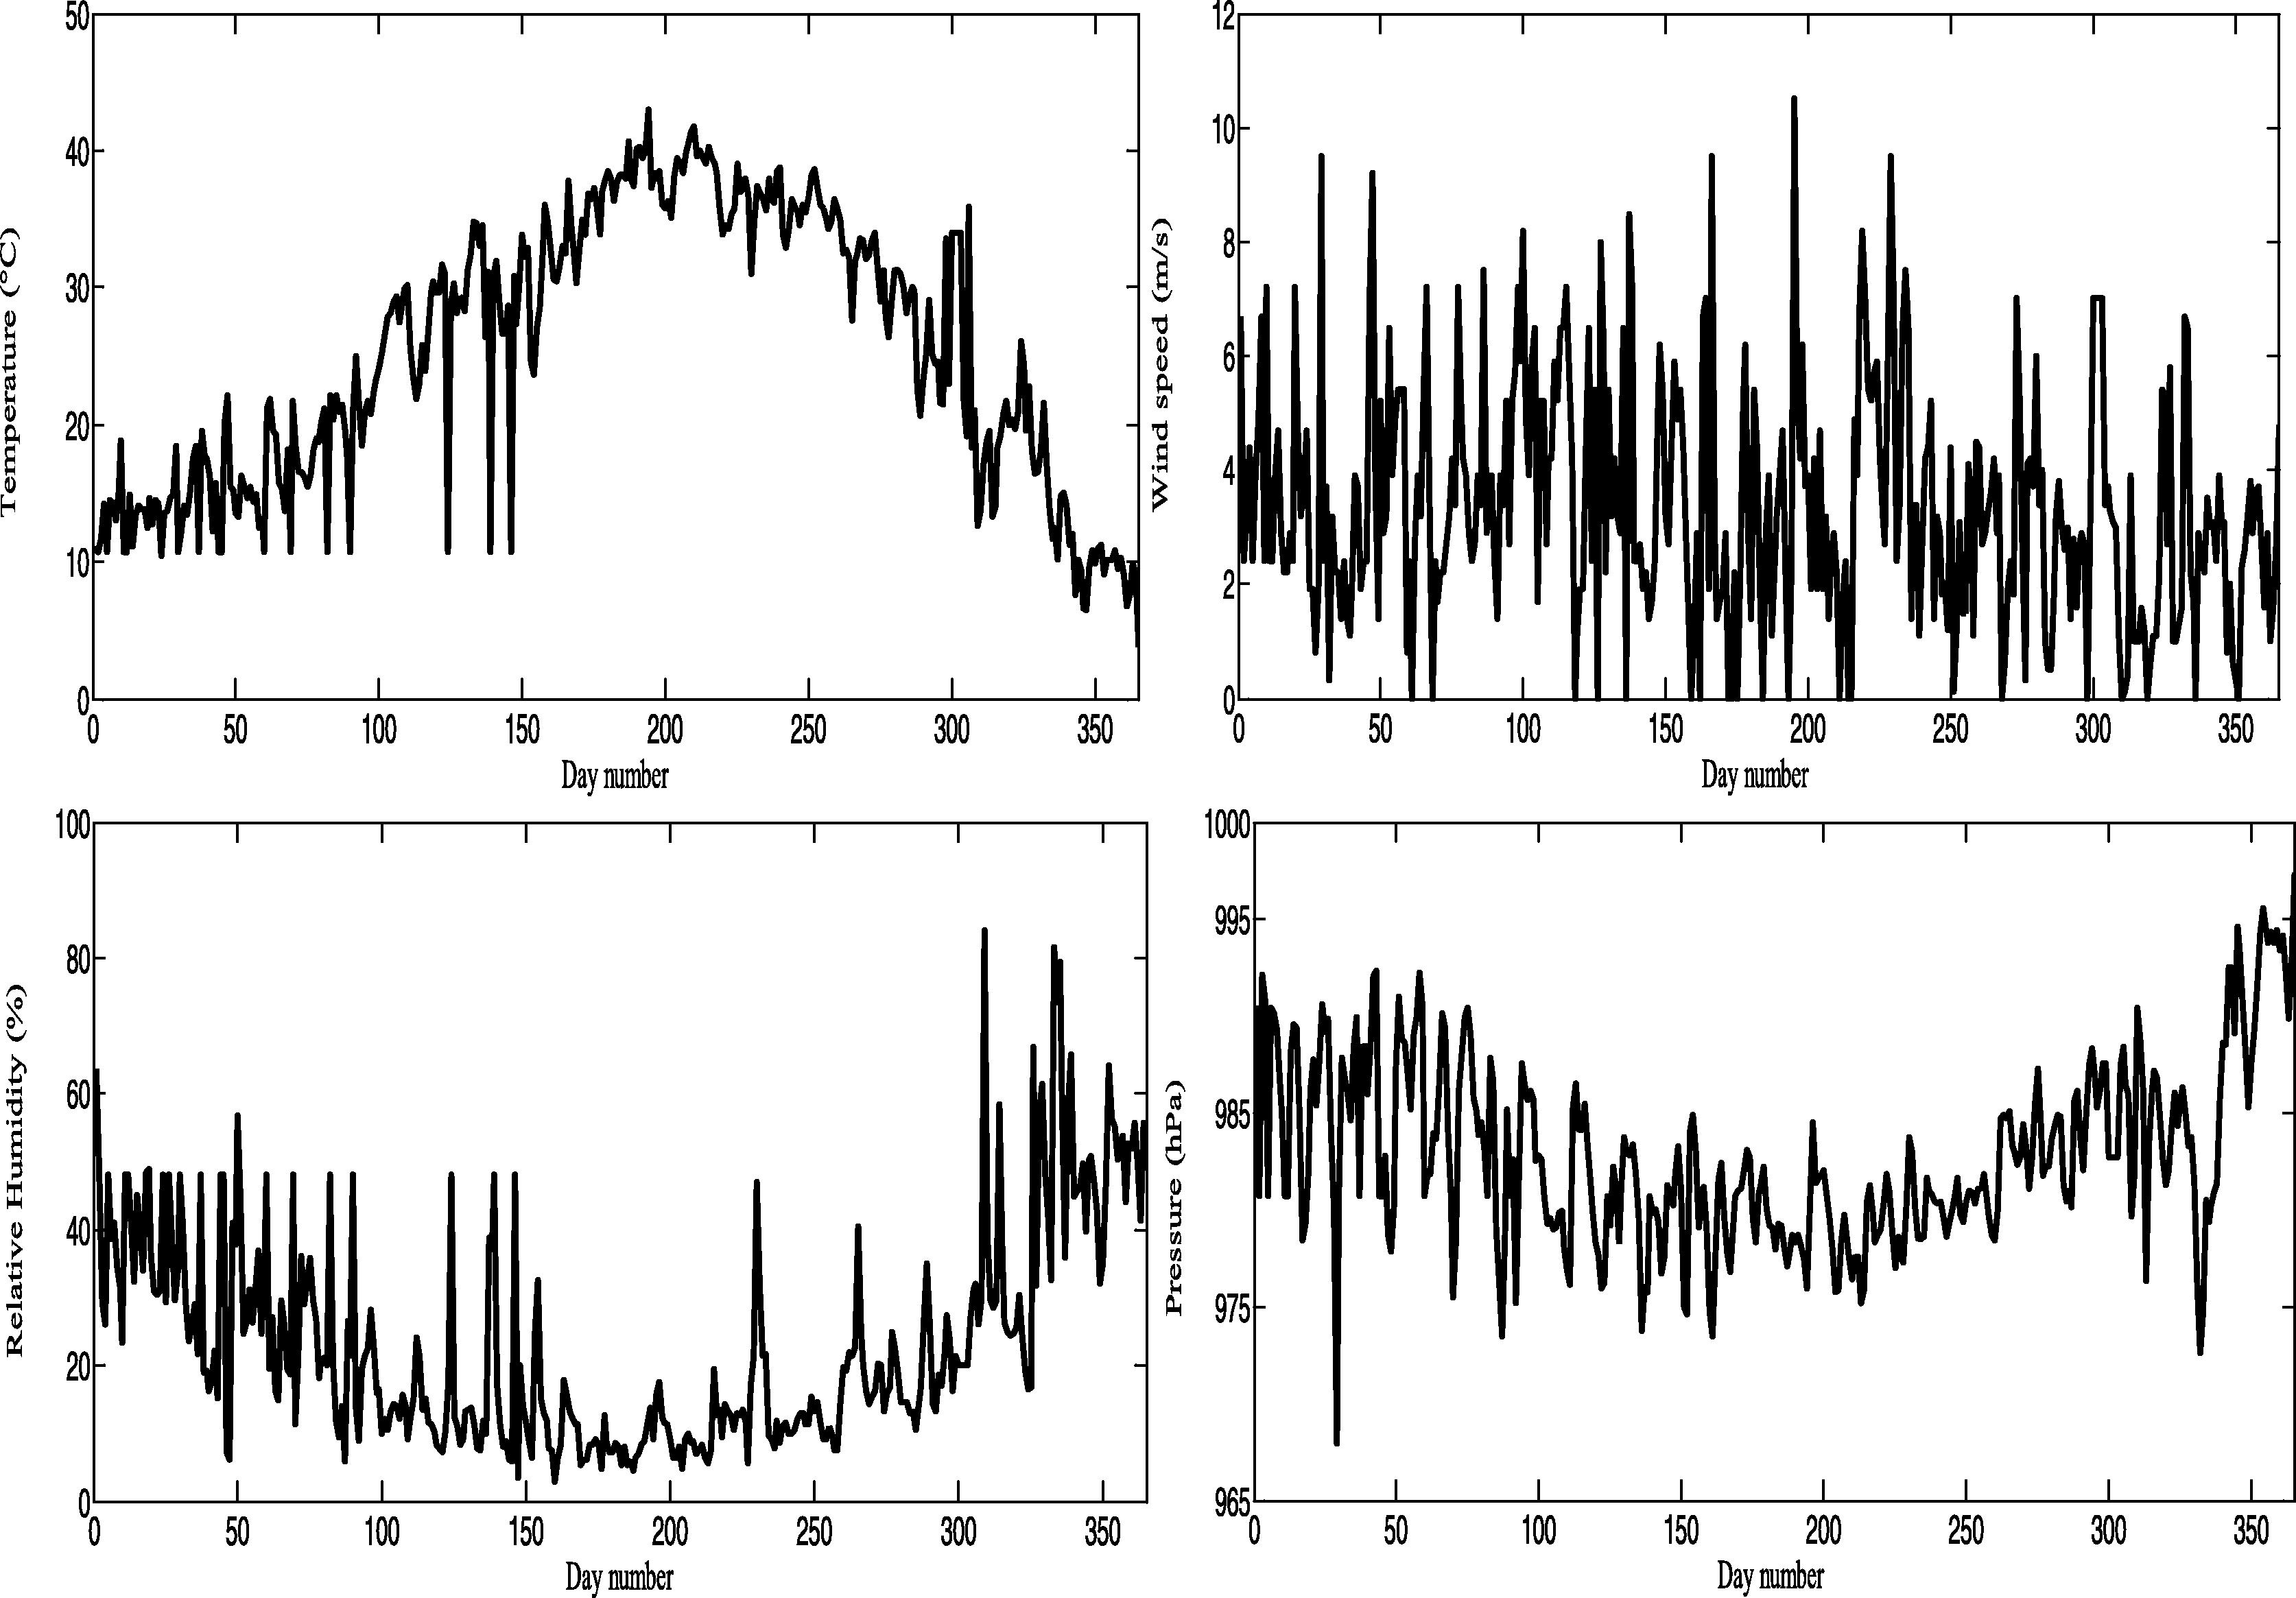
Daily average variation of meteorological parameters during 2014 in Adrar.
3 Mathematical formulations
In this research, the experimental Linke turbidity factor (TLE) and Ångström coefficient have been calculated using a method developed by Kasten and Dogniaux’s formula respectively, which have been well described in previous papers.
The expression of TLE is given by the following equations:
The Ångström coefficient was calculated by using Eq. (6) (Dogniaux, 1974):
The precipitable water thickness wp (in cm) is given as:
The theoretical Linke turbidity factor TLC has been calculated then through the formulation proposed by (Capdrou, 1987).
Where Z is the location altitude (in km), φ is the site latitude (in degree) and n is the number of days in the year
4 Results and discussion
The previous equations have been implemented into a simple MATLAB software application, in order to calculate the turbidity factors in Adrar as well as the hourly, daily and monthly average values. The evolution of wind speed, turbidity factors and cloudless sky factor (ratio of diffuse irradiance to global irradiance) for cloudless day in June 9, 2014 are presented in Fig. 3. It is displayed that the clear sky conditions used in this study eliminate the early morning and near to sunset turbidity indices. The figure shows the trend similarity of the two turbidity indices TL and β.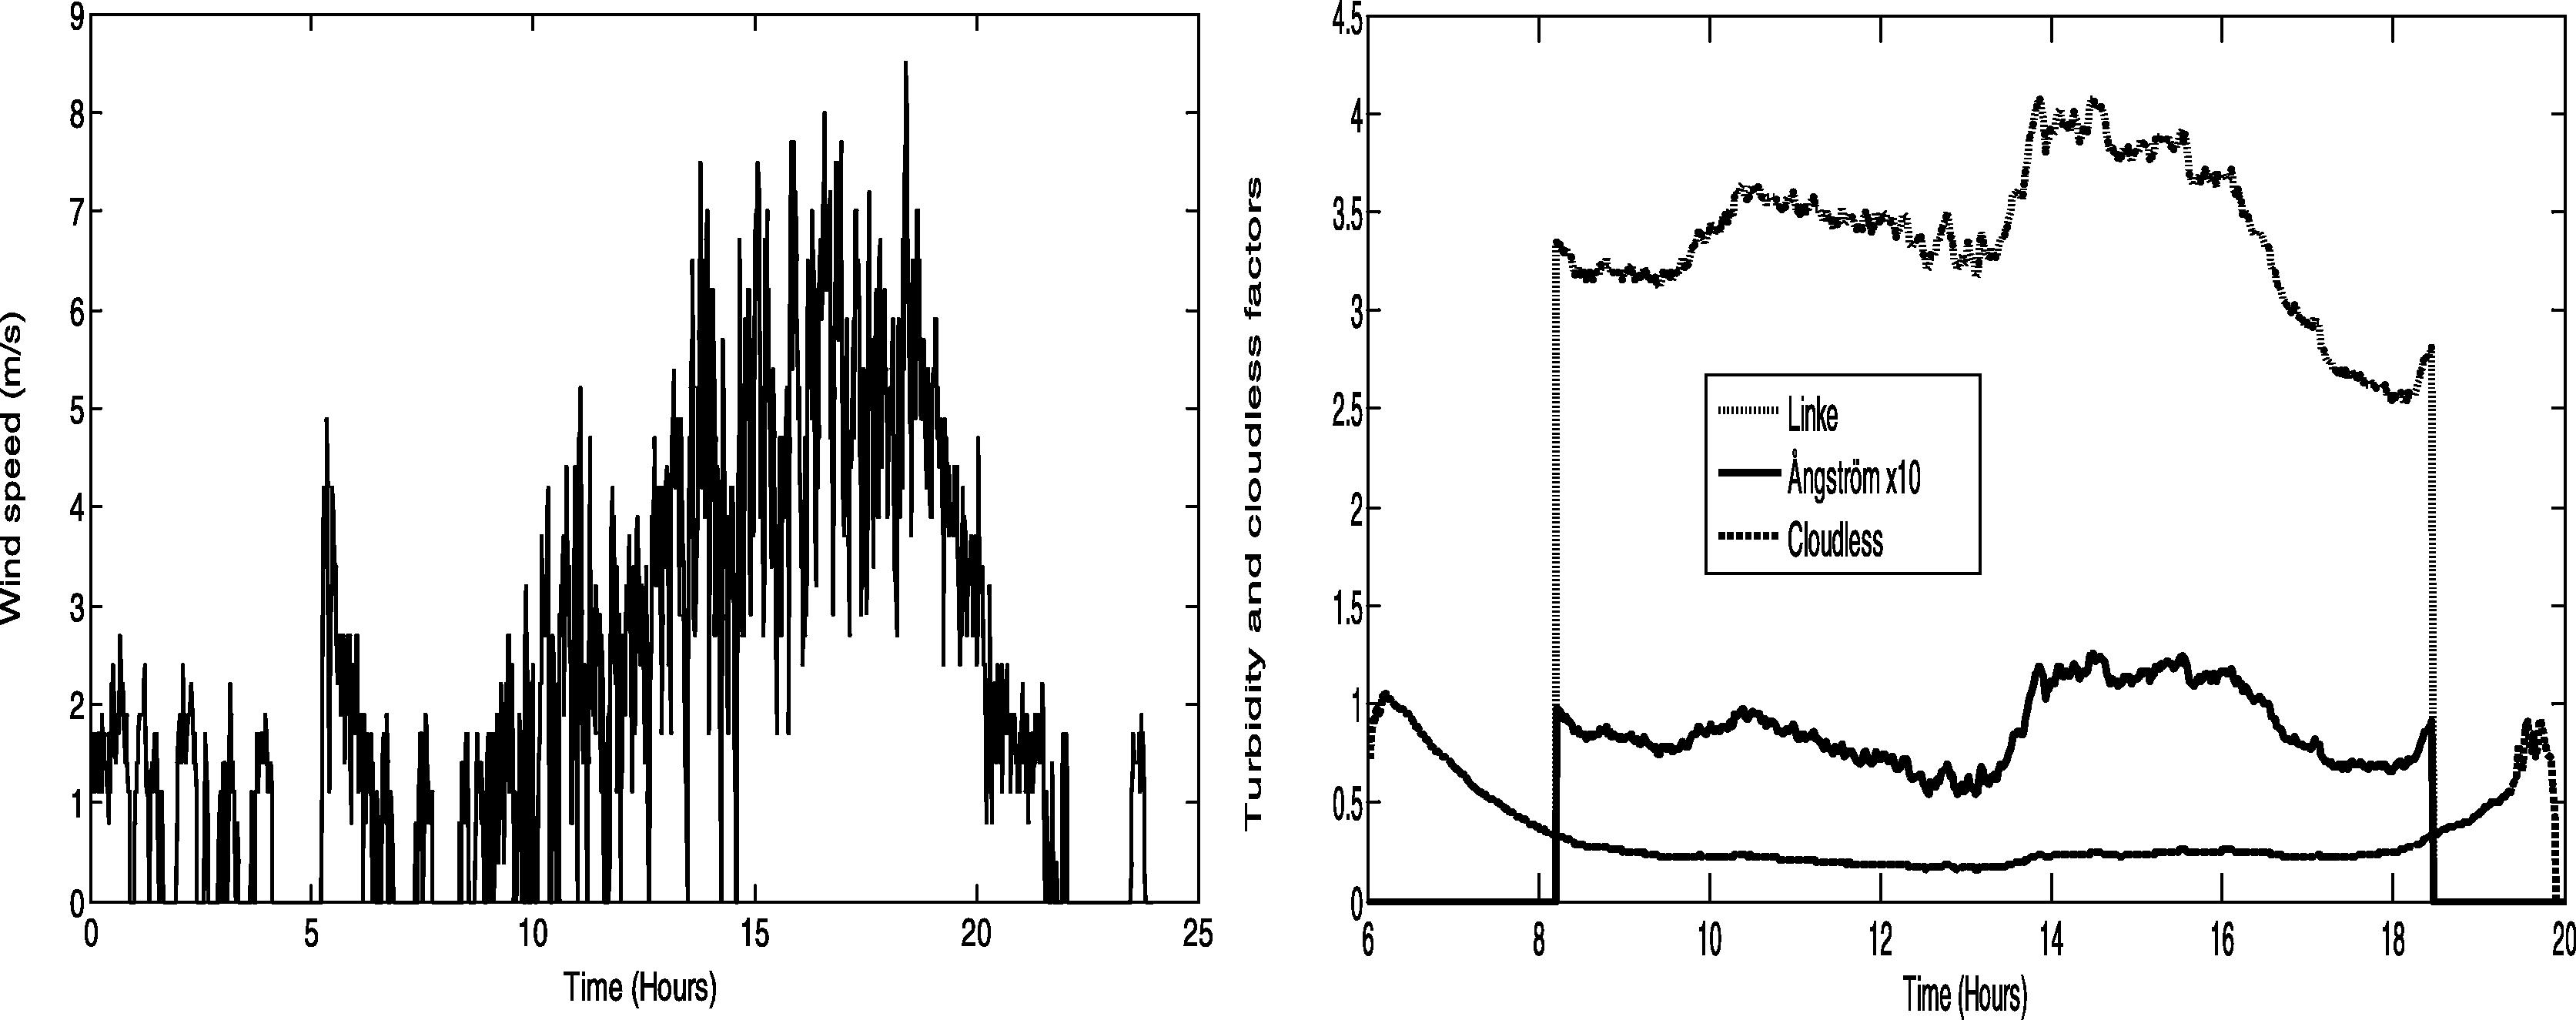
Cloudless sky and turbidity factors (right part) and wind speed evolution (left part) for a typical cloudless day.
In addition, the exam of the wind speed evolution in this day, show that the increase in atmospheric turbidity may result from increases in wind speed which can transport and elevate sand particles because Adrar region has vast areas of desert sand. The peak is observed in the afternoon when velocity exceeds 7 m/s, this result is similar to that found by (Trabelsi and Masmoudi, 2011; Chaâbane, 2008) in Tunisia.
The daily average variation of TL and β during the period 2012–2015 are shown in Fig. 4. In this figure, provide the observation that the daily mean turbidity factors show fluctuations along the year. The daily mean Linke and Ångström factors varies from 2 to 8 and from 0.001 to 0.23 respectively with the highest values in summer, lowest values in winter season and middle values in spring and autumn .Summer months in Adrar are characterized by the higher ambient temperature and lower relative humidity (Fig. 2) gives as a result low cohesion of the sand particles. The stronger wind speed can transport sand and dust particles cause in this way an increase in the turbidity factors values. Also, the minimum values recorded in winter may result from increases in relative humidity and decreases in ambient temperature.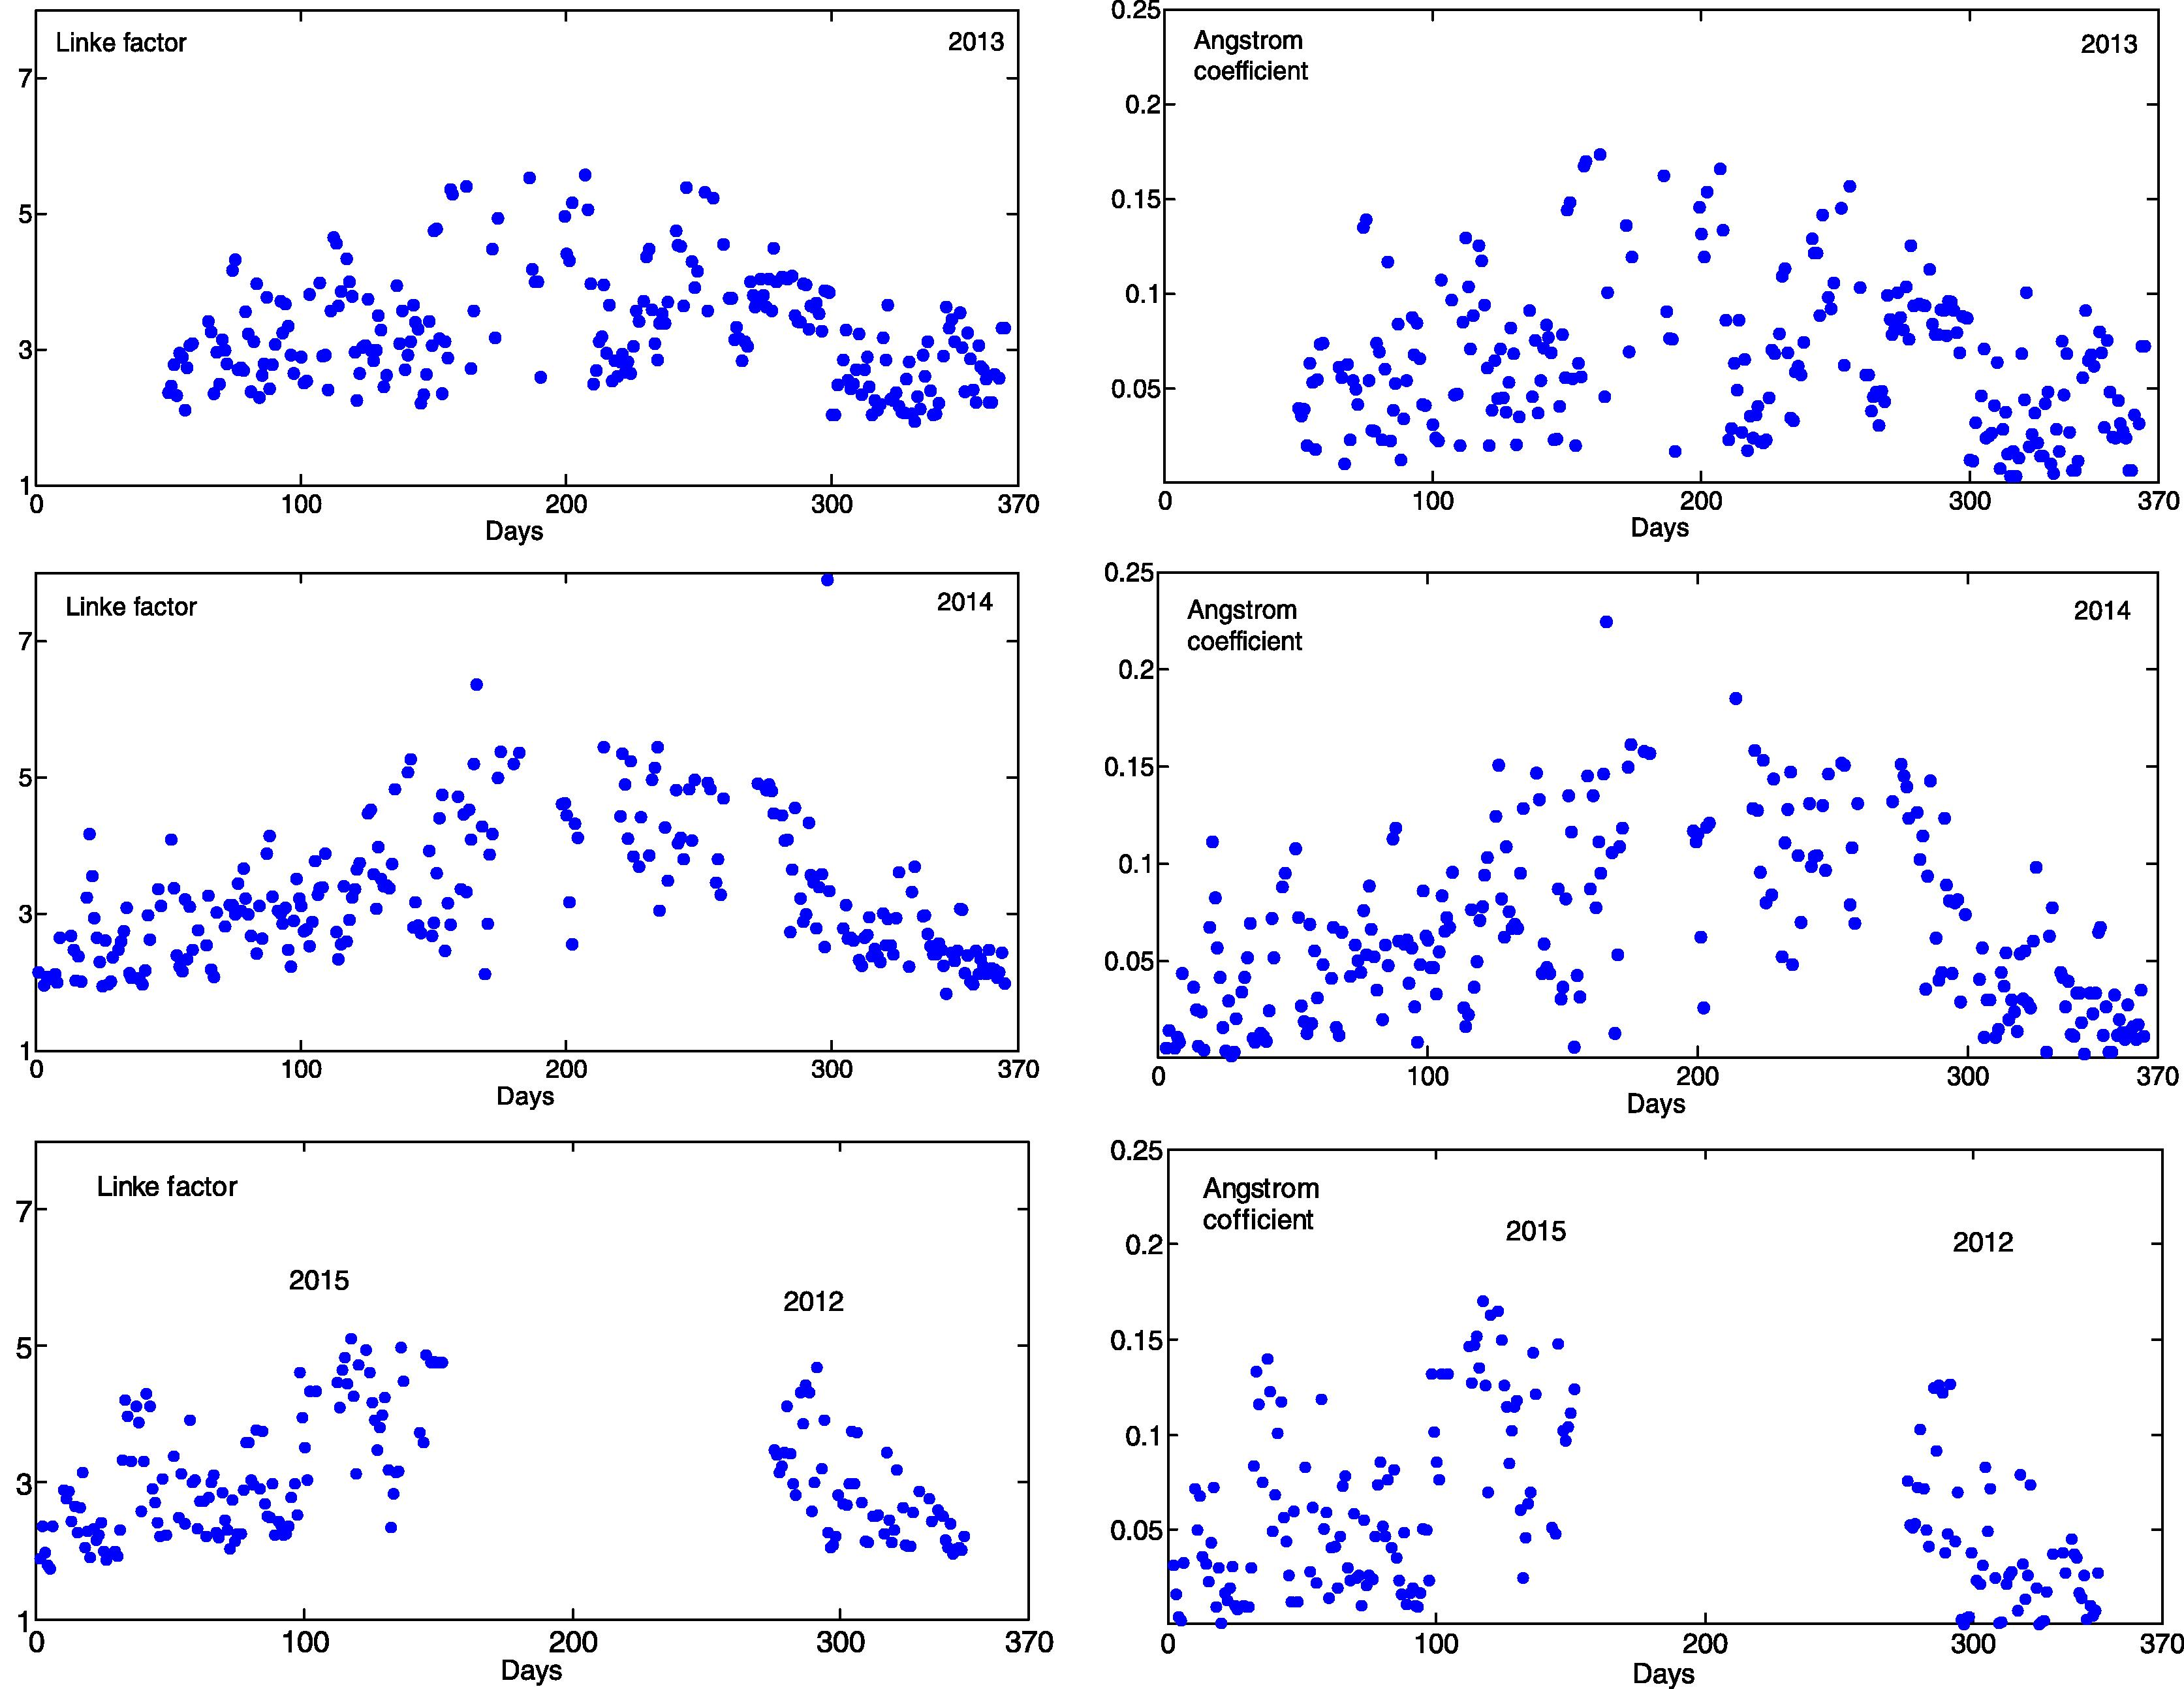
Daily average values of turbidity factors computed at Adrar.
In summary, as discussed above, the turbidity fluctuation can be influenced by the meteorological conditions and local air pollution sources such as desert dust from the Sahara, fossil fuels exploration or volcanic aerosol, as documented by (Adeyefa et al., 2000; Zakey et al., 2004).
The frequency of occurrence for the turbidity indexes were computed and plotted in Fig. 5. It can be observed that the most frequent values of the Linke factor being between 2 and 5. The statistics shows that 48.1% values are less than 3, 48.24% are between 3 and 5, and that only 3.62% exceed 5. For the Angström turbidity coefficient, 16.18% of the values are less than 0.02, 70.52% are between 0.02 and 0.14, and that 6.7% exceed 0.14. These results are in agreement with those obtained by (Djafer and Irbah, 2013) in Ghardaïa city (latitude North 32°37′, longitude East 3°77′ and altitude 450 m), this can be explained by hot weather and Sirocco winds that characterize the two locations. Djafer and Irbah obtained that at 39.8% of the cloudless days, TL values are less than 3 and about 47.5% of the Linke factor values are between 3and 5. For the Angström coefficient, 75.4% of the values are between 0.02 and 0.15.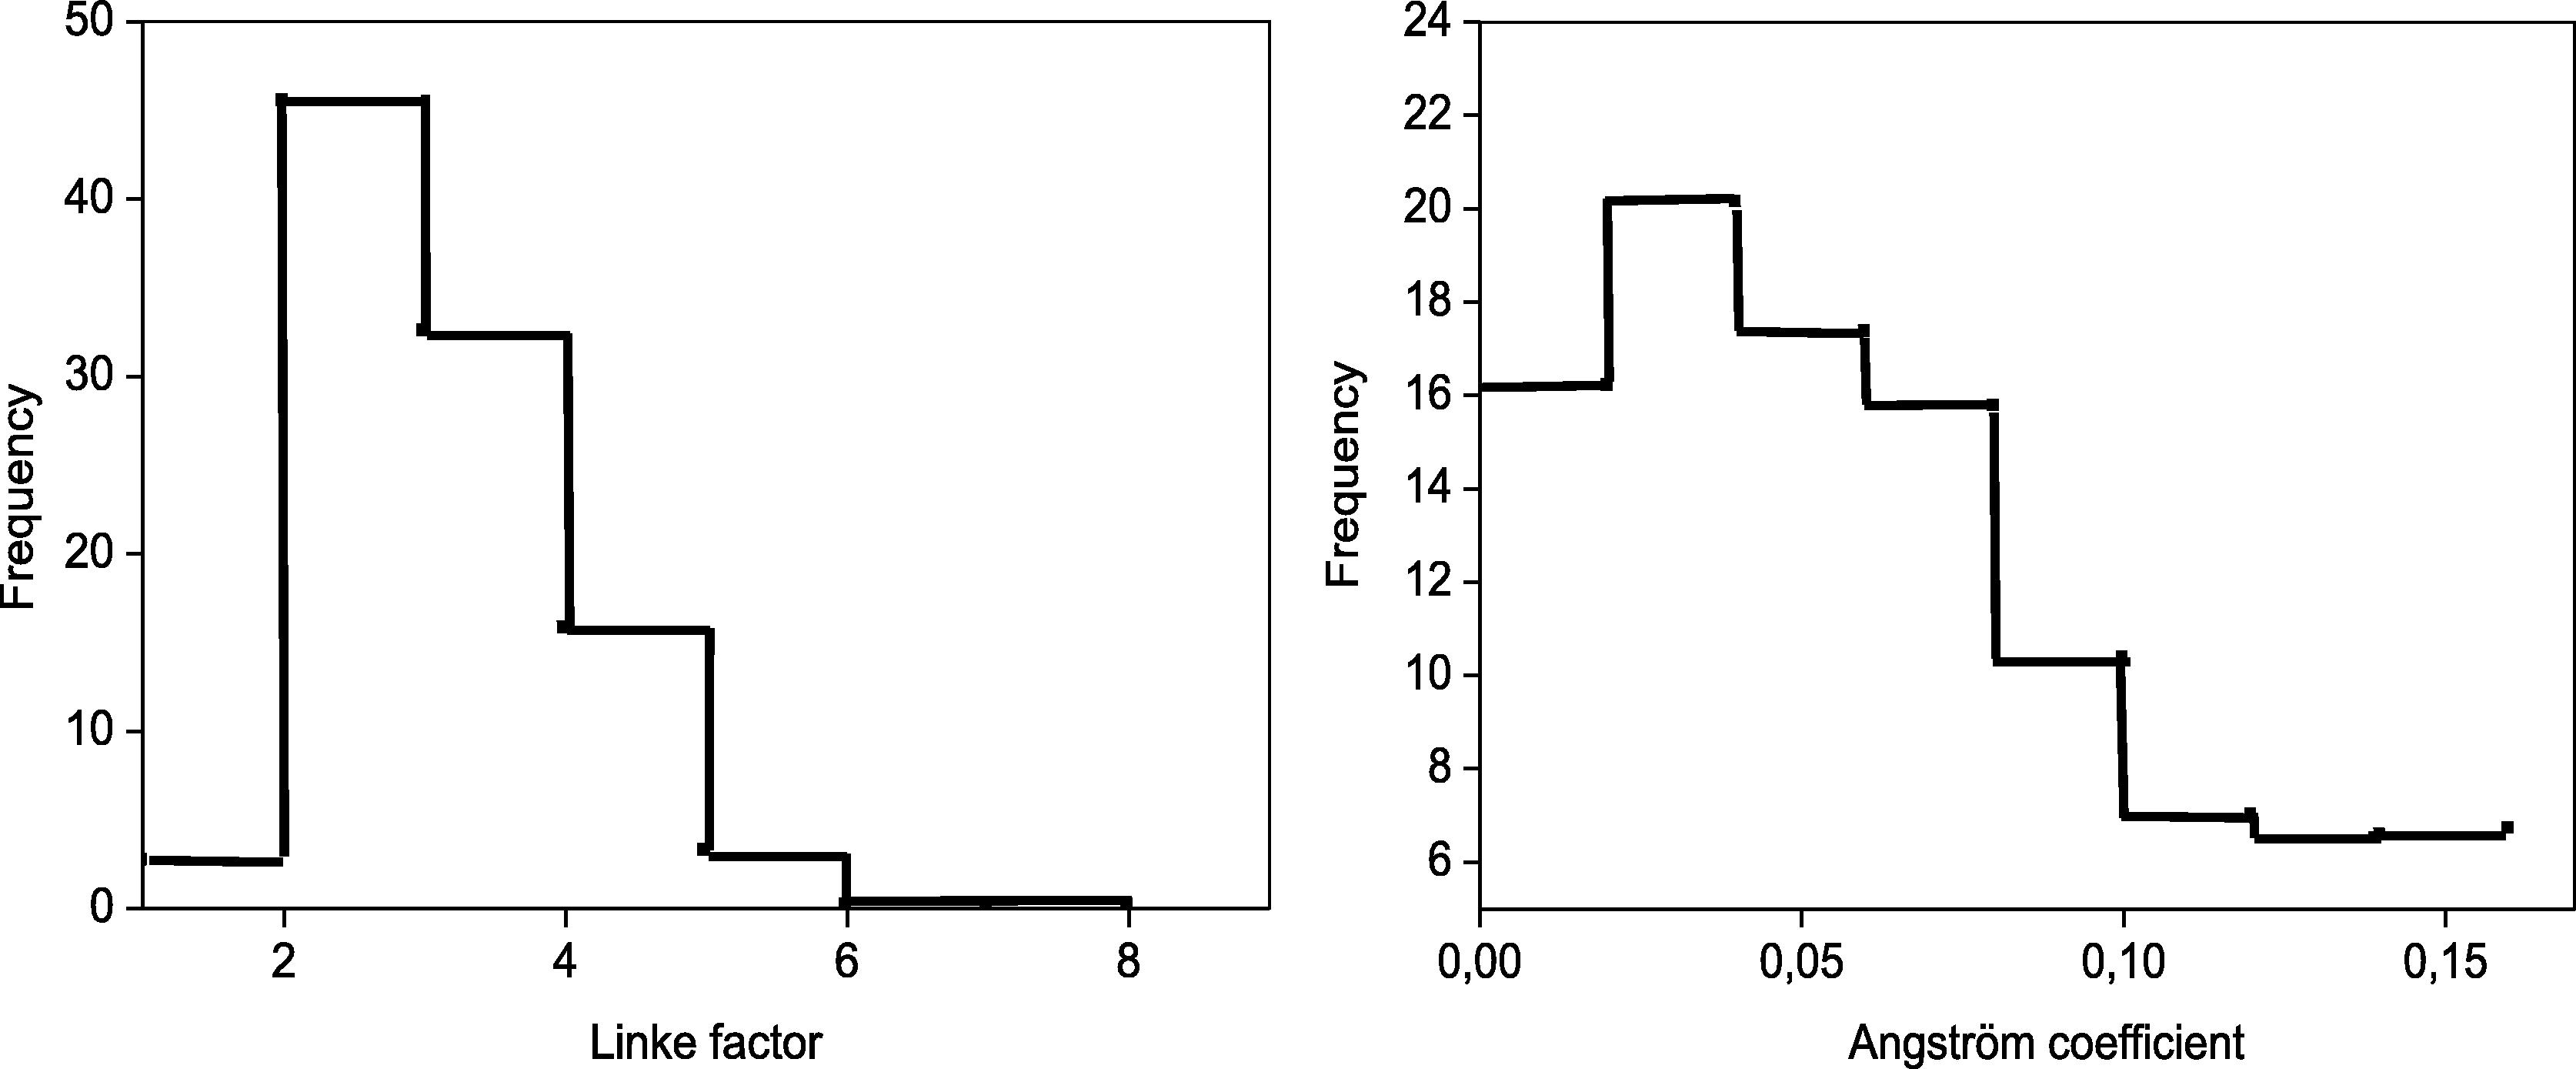
Frequency distribution of turbidity factors computed at Adrar.
The series of the monthly average Link turbidity factor values (TLm) obtained in Adrar, Ghardaïa and Tamanrasset (latitude North 22°78′, longitude East 5°52′ and altitude 1377 m), are reported in Table 1. From which it could be observed that the monthly average values of the three sites have the similar behavior with a big degree of variability within three month (October–December) between Adrar and Ghardaïa values and those of Tamanrasset. The monthly Linke factor over Adrar and Ghardaïa recorded minimum values in January (2.35 and 2.1, respectively) and maximum values in July (4.6 and 4.9, respectively). However, in Tamanrasset the lowest and highest values have been recorded respectively for February (2.6) and October (4.7). This can be explained either by the high elevation of Tamanrasset (1377 m) or by the difference between Aguiar procedure used in Tamanrasset and Kasten method used in Adrar and Ghardaïa for assessing the Linke factor. Similarly, the monthly average values of the Ångström turbidity (βm) calculated in Adrar and Ghardaïa are given in Table 2. It should be noted that βm reaches its lowest in January (0.015 and 0.03), then increases fairly up to (0.128 and 0.16) in July over Adrar and Ghardaïa respectively. The results indicate high values in summer months than in winter months, in agreement with Bilbao et al. (2014), who estimated the monthly average values of the Ångström turbidity in a rural area of Castilla y León region, Spain during the period 2010–2012. The minimum and maximum βm are between 0.04 and 0.16 occurring in January and June respectively
Month
Adrar (2012–2015)
Ghardaïa (2004–2008) [19]
Tamanrasset (1995–1999) [20]
2012
2013
2014
2015
Mean
J
–
–
2.45
2.26
2.35
2.1
2.7
F
–
2.68
2.66
3.22
2.85
2.7
2.6
M
–
3.04
3.02
2.72
2.92
3.1
3.2
A
–
3.43
3.02
3.69
3.38
3.9
3.3
M
–
3.16
3.67
4.06
3.63
4.2
3.2
J
–
3.87
4.12
–
3.99
4.5
3.9
J
–
4.14
5.07
–
4.6
4.9
4
A
–
3.41
4.46
–
3.93
4.8
4.4
S
–
3.88
4.33
–
4.1
4.4
4.5
O
3.24
3.57
3.9
–
3.57
3.7
4.7
N
2.54
2.51
2.74
–
2.59
2.8
3.5
D
2.23
2.78
2.36
–
2.45
2.4
3.7
Month
Adrar (2012–2015)
Ghardaïa (2004–2008)
2012
2013
2014
2015
Mean
J
–
–
0.004
0.026
0.015
0.03
F
–
0.047
0.044
0.071
0.054
0.052
M
–
0.056
0.056
0.041
0.051
0.072
A
–
0.072
0.054
0.095
0.073
0.107
M
–
0.061
0.084
0.1
0.081
0.117
J
–
0.098
0.106
–
0.102
0.13
J
–
0.098
0.159
–
0.128
0.16
A
–
0.061
0.113
–
0.087
0.13
S
–
0.082
0.118
–
0.1
0.13
O
0.057
0.081
0.1
–
0.079
0.09
N
0.026
0.032
0.038
–
0.032
0.057
D
0.021
0.043
0.024
–
0.029
0.047
Finally, the validation of the correlation presented by Capderou was done by comparing the theoretical Link monthly average values calculated by Eq. (8) and the experimental monthly average values obtained in Adrar, Ghardaïa and Tamanrasset (Table 3). The analysis of the error show that Capderou formula underestimate the Linke turbidity factor, the mean deviation for Adrar, Ghardaïa and Tamanrasset are respectively 15.05%, 25.56% and 37.78%. This can be explained considering the relationship between the Link factor and the local meteorological conditions. This relationship is not presented in Capderou equation. Furthermore, minimum and maximum errors were observed in Adrar and Tamanrasset respectively, this observation shows that this formula is more suitable for the calculation of the Link factor in the case of low altitudes.
Month
Capderou
Error exp vs Capderou (%)
Adrar
Ghardaïa
Tamanrasset
Adrar
Ghardaïa
Tamanrasset
J
2.24
2.04
1.81
4.68
2.85
32.96
F
2.28
2.09
1.85
20
22.59
28.84
M
2.46
2.27
1.99
15.75
26.77
37.81
A
2.73
2.54
2.18
19.23
34.87
33.93
M
3.03
2.83
2.39
16.52
32.61
25.31
J
3.27
3.07
2.56
18.04
31.77
34.35
J
3.39
3.19
2.65
26.30
34.89
33.75
A
3.36
3.15
2.63
14.50
34.37
40.22
S
3.18
2.96
2.49
22.43
32.72
44.66
O
2.89
2.67
2.28
19.04
27.83
51.48
N
2.59
2.38
2.06
0
15
41.14
D
2.35
2.15
1.89
4.085
10.41
48.91
Average
15.05
25.56
37.78
5 Conclusions
In the present paper, a software application has been developed based on original Kasten method and the equation suggested by Dogniaux in order to calculate the hourly, daily and monthly mean of two turbidity factors for the first time in Adrar. To reach this goal, 31 months (2012–2015) radiometric and meteorological data measured at research unit in renewable energies in the Saharan medium were used. The analysis of the results demonstrates that the Linke and Ångström turbidities are strongly correlated with the meteorological parameters (wind speed, ambient temperature and relative humidity). The statistics shows that 96.34% of the Linke factor values are below 5 and 86.7% of the Ångström coefficient values are below 0.14. High values were observed in summer, the increase of the turbidity coefficients in this season is an indication for increasing atmospheric pollution level due to the meteorological conditions and desert sand that characterize the Algeria Saharan regions.
In the other hand, the comparison between the monthly Linke turbidity factors fined in Adrar, Ghardaïa and Tamanrasset showed that the Ghardaïa and Adrar values differ from those of Tamanrasset because Ghardaïa altitude is approaching that of Adrar. From the validation of Capderou Linke turbidity formula, it was noticed that Capderou formula is suitable in the case of low altitudes; hence to have significant validation an experimental validation in other site in Algeria is necessary.
Acknowledgement
The authors gratefully acknowledge the support of the research unit in renewable energies in the Saharan medium for providing the data used in this study.
References
- Spectral solar irradiance in northern Scandinavia before and after Pinatubo. Atmósfera. 2000;13:133-146.
- [Google Scholar]
- Future of solar energy in Saudi Arabia. J. King Saud Univ. Eng. Sci.. 2015;27(2):153-157.
- [Google Scholar]
- Comparison of solar radiation models and their validation under Algerian climate –the case of direct irradiance. Energy Convers. Manage.. 2015;98:236-251.
- [Google Scholar]
- Turbidity coefficients from normal direct solar irradiance in central Spain. Atmos. Res.. 2014;143:73-84.
- [Google Scholar]
- General models for estimation of the monthly mean daily diffuse solar radiation (Case study: Algeria) Energy Convers. Manage.. 2014;81:211-219.
- [Google Scholar]
- Capdrou, M., 1987. Atlas Solaire de l’Algérie, Modèles Théoriques et Expérimentaux. Office des Publications Universitaires, Volume1, Tome 2, Algérie.
- Analysis of the atmospheric turbidity levels at two Tunisian sites. Atmos. Res.. 2008;87:136-146.
- [Google Scholar]
- Experimental data of the Linke turbidity factor and estimates of Angstrom turbidity coefficient for two Italian localities. Renewable Energy. 1999;17:397-410.
- [Google Scholar]
- Estimation of atmospheric turbidity over Ghardaïa city. Atmos. Res.. 2013;128:76-84.
- [Google Scholar]
- Dogniaux, R., 1974. Repréntations analytiques des composantes du rayonnement lumineux solaire, Conditions du ciel serein. Institut Royal de Métiorologie de Belgique, Série A, Belgique.
- Issues concerning atmospheric turbidity indices. Renewable Sustainable Energy Rev.. 2012;16:6285-6294.
- [Google Scholar]
- A new table and approximate formula for relative optical air mass. Arch. Meteor. Geophys. Bioclimatol.. 1966;14:206-223.
- [Google Scholar]
- A simple parameterization of the pyrheliometric formula for determining the Linke turbidity factor. Meteorol. Rdsch.. 1980;33:124-127.
- [Google Scholar]
- The Linke turbidity factor based on improved values of the integral rayleigh optical thickness. Sol. Energy. 1996;56(3):239-244.
- [Google Scholar]
- Determination of Angstrom’s turbidity coefficient from direct total solar irradiance measurements. Sol. Energy. 1987;38(2):89-96.
- [Google Scholar]
- Numerical simulation of solar parabolic trough collector performance in the Algeria Saharan region. Energy Convers. Manage.. 2014;85:521-529.
- [Google Scholar]
- Generation of hourly solar radiation for inclined surfaces using monthly mean sunshine duration in Algeria. Energy Convers. Manage.. 2003;44:3125-3141.
- [Google Scholar]
- A simplified model for generating sequences of global solar radiation data for isolated sites: using artificial neural network and a library of Markov transition matrices approach. Sol. Energy. 2005;79:469-482.
- [Google Scholar]
- An adaptive wavelet-network model for forecasting daily total solar-radiation. Appl. Energy. 2006;83:705-722.
- [Google Scholar]
- Perrin Brichambaut, Christian., Vauge, Chrichtian., 1982. Le gisement solaire évaluation de la resource énergétique. Lavoisier Technique et Documentation, Paris.
- A mew method to determine Angstrom’s turbidity coefficient: its application for Valencia. Sol. Energy. 1995;54(4):219-226.
- [Google Scholar]
- An investigation of atmospheric turbidity over Kerkennah Island in Tunisia. Atmos. Res.. 2011;101:22-30.
- [Google Scholar]
- New combined models for estimating daily global solar radiation from measured air temperature in semi-arid climates: application in Ghardaïa, Algeria. Energy Convers. Manage.. 2014;79:606-615.
- [Google Scholar]
- Revised solar maps of Algeria based on sunshine duration. Energy Convers. Manage.. 2014;82:114-123.
- [Google Scholar]


