

Translate this page into:
Environmental hazard assessment for ground failure in Jeddah city, western Saudi Arabia, through cross-hole seismic testing
⁎Corresponding author. khassanein@ksu.edu.sa (Kamal Abdelrahman)
-
Received: ,
Accepted: ,
This article was originally published by Elsevier and was migrated to Scientific Scholar after the change of Publisher.
Peer review under responsibility of King Saud University.
Abstract
The environmental threats of soil subsistence in Jeddah city have been assessed using cross-hole seismic testing. These threats affect the state of health of roads, buildings, near-surface foundations ensuring a reliable and economic infrastructure design, as unanticipated site conditions can cause significant traffic problems, soil subsidence, and structural collapse. Cross-hole seismic testing is of utmost importance in determining velocity profiles of P- and S-waves for environmental hazard assessment. These velocity profiles are required to calculate the geotechnical parameters of soil nearby important structures. A cross hole seismic survey was conducted at boreholes close to Jeddah desalination plant. A sledgehammer horizontally striking a wooden plate was used to generate S-waves polarized in the crossline and inline directions. A vertical hammer hitting a metal plate to generate the P-wave then the first break arrival times were inverted for the P- and S-wave velocity structure estimation. The equipment and procedures comply with the American Society for Testing and Materials (ASTM) D 4428/D 4428M-91 standard test method for cross-hole seismic testing. The estimated velocities were utilized to calculate the elastic moduli, geotechnical parameters and density variations within the mapped area. These parameters agree with the lithological variations of near- surface sediments from borehole logs. Finally, the study area illustrated soft, fractured, and poorly graded sediments, which, in turn, require special treatment from engineering point of view before establishing the important facilities in the area. These results are highly recommended and have to be considered to mitigate the environmental hazards in Jeddah city.
Keywords
Environmental hazard assessment
Desalination plant
Cross hole seismic
Jeddah
Saudi Arabia

1 Introduction
Major cities, such as Jeddah, face different threats affecting both of structures and environment, which will get worse in the near-future. Jeddah city located along the Red Sea coastal strip of western Saudi Arabia (Fig. 1) and is continually exposed to recurring environmental hazards that cause ground failure and collapsing of the topsoil layer. Soil subsidence is one of the most hazardous threats causes stifling traffic congestion especially in the light of the population increase in Jeddah. This city is the biggest and most crowded one in Saudi Arabia, making it at risk of threats of soil subsidence that commonly occurs in the coastal strip where soft and weak soils are prevail. Soil subsidence phenomenon threatens the important facilities, such as hospitals, schools, power plants and desalination plants. A long record of land subsidence cases were documented in Jeddah, particularly in the northern and southern urban expansions. The engineering treatment and remediation operations of land subsidence hazards cost the Saudi government hundreds of millions of Saudi Riyals annually.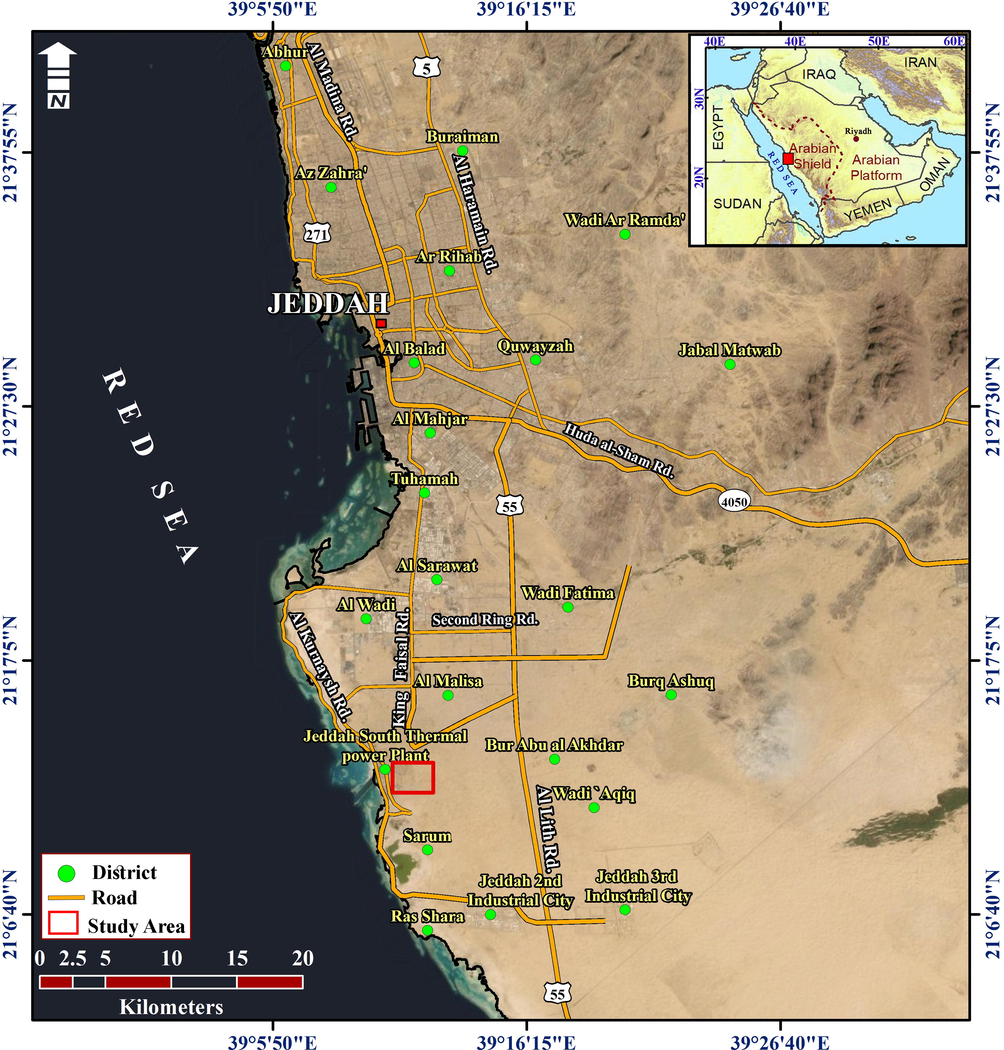
Location map of the study area.
Borehole seismic methods have been tested by Luna and Jadi (2000), Angioni et al. (2003), Park et al. (2008), Dietrich and Tronicke (2009), Al-Taie (2017), Lebedev and Dorokhin (2019), and Abdelrahman et al. (2020a), Abdelrahman et al. (2020b). While site soil stabilization parameters have been calculated by Stipho (1984), Abd El Rahman (1989), Abd El Rahman and Abd El Latif (1990), Abd El Rahman et al. (1991), Abd El Rahman et al. (1992), Abd El Rahman et al. (1994), Wightman et al. (2003), Kim et al. (2004), Anbazhagan and Sitharam (2006), Roy and Bhalla (2017), Ravi (2017), Yusof and Zabidi (2016), Kamal Abdelrahman et al. (2017a), Kamal Abdelrahman et al. (2017b), Kamal Abdelrahman et al. (2019), Kamal Abdelrahman et al. (2020a), Kamal Abdelrahman et al. (2020b), and Alhumimidi (2020). Cross-Hole Seismic Testing (CHST) is a professional and versatile platform that can be used to evaluate structures/infrastructure and environmental/engineering geophysical surveys. This approach involves lowering a three-component borehole geophone down one hole while lowering a source down an adjacent borehole or boreholes, firing the source at some prescribed depth interval.
Building foundation structures for civil engineering installations often requires comprehensive data of the soil properties at the investigated site. Borehole logs can be used to define soil types and determine strength and consolidation parameters regarding depth. Soil-boring related in-situ tests are correlated with soil strength as standard penetration test. However, to improve accuracy, it is advantageous to measure an in-situ soil property directly related to soil modulus. Velocity of S- wave (Vs) is the standard property from which in-situ soil modulus is determined, owing to its direct relationship with modulus via soil mass density and its relative ease of measurement, as a result of the advancement of seismic techniques. The elastic parameters of near-surface sediments provide important indications for several types of civil engineering problems. Seismic waves are interpreted and processed to obtain near-surface seismic velocity structure.
The utilization of CHST to estimate in situ compressional and shear wave velocities and corresponding elastic soil parameters is of considerable benefit to geotechnical engineers. There are four primary benefits of CHST in geotechnical engineering as determining S-wave velocity of soils, which indicates stiffness; applied very soon after ground improvement construction; assessing soil properties which is useful for the ground improvement; and upgrading of the Saudi Building Code.
2 Materials and methods
2.1 Cross hole seismic testing
The CHST approach applied at definite depths keeping the source and receiver at equal elevations (Fig. 2). Measuring P- and S-wave velocity becomes more efficiency using source-receiver systems with preferential orientations (Wightman et al., 2003). The body waves are generated only in the source borehole during CHST while surface waves are not and consequently not interfering signals of recorded body waves. There are two types of S-waves generated during CHST: they have either vertical or horizontal particle motions. Alternatively, SH-waves can be generated and recorded in CHST. Fig. 3 illustrations a series of CHST SV-waves with reversed polarity received at both receiver boreholes. Notably, the P-wave energy has a lower amplitude than the S-wave energy (Woods, 1994; Gazetas, 1991).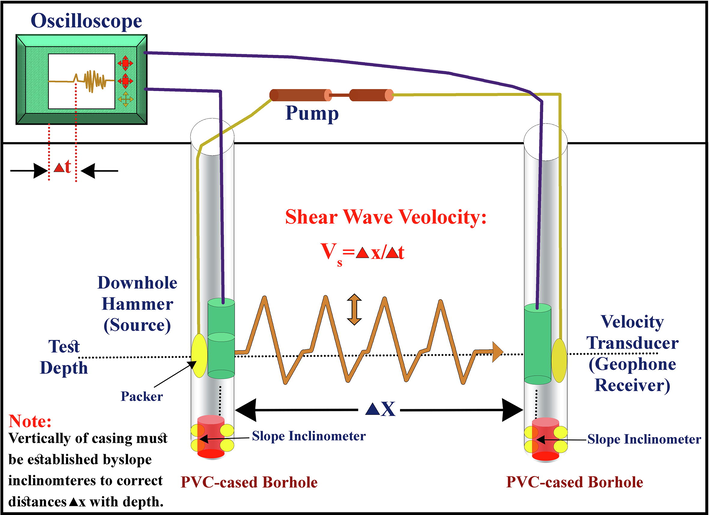
The cross hole seismic test using a triaxial receiver (modified after Hossain, 2015).
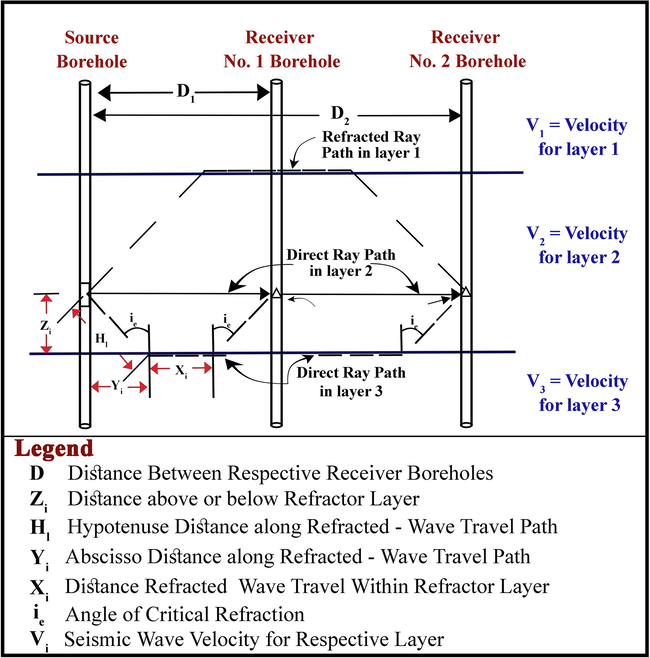
Interpretation of the cross hole seismic test (modified after Wightman et al., 2003).
2.2 Estimation of geotechnical soil parameters
As stated-before, CHST determines the velocities of P- and S- waves for sediments at the required engineering and environmental depths. The elastic properties for these deposits can be obtained through measuring of the in-situ density and VP and VS. Once the seismic layers are graphically defined, the average density (ρ) from Vp and Vs with depth and the dynamic soil parameters can be obtained. Soil dynamic properties can be determined using equations in tabulated in Table 1 based on the relationships given in IS: 5249-1992. Where, Vp and Vs are P-and S-waves velocities respectively.
Parameter
Used equations
References
Poisson’s Ratio
Adams (1951)
Young’s Modulus
Adams (1951)
Bulk Modulus
King (1966), Toksoz et al. (1976)
Shear Modulus
μ = ρ (Vs)2
King (1966), Toksoz et al. (1976)
Lame’s constants
King (1966), Toksoz et al. (1976)
Constrained modulus
M = ρ* (Vp)2
IS: 5249-1992
3 Data acquisition
In CHST, vertically propagating and horizontally polarized shear waves and vertically propagating compression waves travel from an S-wave source and a P-wave source, respectively on the ground surface to receivers at a known depth in a borehole. Vertically traveling S- and P-waves are not converted to other waves by a horizontal boundary. The horizontal distance between a source and a borehole is known and the distance between a source and a receiver is calculated. The first arrival times of S- or P-waves are measured at each depth. The time difference between the first arrival times of S or P-waves and the difference in distance between each depth are used to calculate wave velocities. The major components of the instrumentation required to perform CHST can be subdivided into three categories: (1) seismic P- and S-wave sensors, (2) triggering systems, and (3) data acquisition systems to record output signals.
Cross hole seismic testing is conducted using two special probes that are pushed into the soil using small machines with hydraulic rams. Both probes are pushed in vertically and parallel ∼1.5 m apart and in small depth increments. The probes are mounted at the tip of a rod string and measure the shear wave velocity between the two probes. The generation of shear waves has done by striking the push rods, which are connected with the probes into ground, with hammers. One probe act as an emitter of the shear waves, while the other one acts as the receiver of the generated waves by the first probe.
In this study, CHST measurements were conducted to a maximum depth of 25 m following ASTM procedures D 4428/D 4428M-91. The boreholes were cased with PVC casing pipes with a completely closed bottom end to prevent sediments getting inside while lowering the casing. The space outside the PVC pipes was grouted with cement grout up to the topmost of the borehole. The CHST data were acquired utilizing one digital three-component geophone at 1.0 m intervals between readings. A borehole source cable was inserted in one of the boreholes to generate shear and compressional waves, and a three-component triaxial geophone receiver was placed in the other borehole to measure the arrival of the seismic wave. The interval distance between source and recording boreholes was 3 m. The first reading was made at a depth of ∼1.0 m. The seismic waves generated by the source were recorded using Geode seismograph model of Geometrics. A triggering device that was connected to the sledge hammer was used to trigger the recording system. The CS/DS-1 Model was used for the CHST. This system includes triaxial geophones for direct path measurements associated with each set of impacts for test the deposits from the impact to the receiver’s location in the borehole. The inter-borehole distance was divided by the travel time at each depth to calculate wave velocity. The acquired row data output from the recording device was travel time-depth graphs presenting signals of arrival waves. In Fig. 4, the X, Y, and Z component of every source (P-wave, S-crossline wave and S-inline wave) are given. Examples of the acquired raw signals are provided in Fig. 4 at various depths within the mapped area.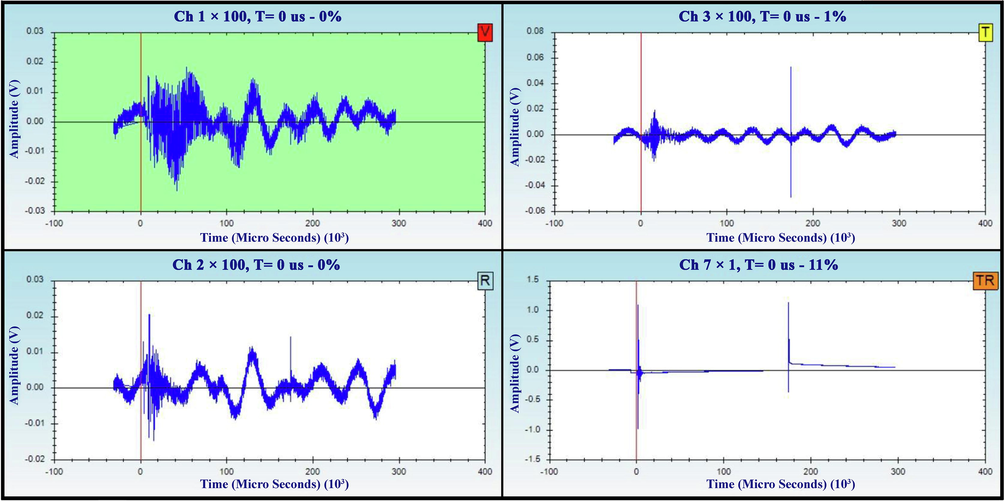
Samples of data collected from the seismic borehole in the mapped area.
4 Data processing
The designed computer program by bureau of reclamation oriented for reducing cross-hole seismic data to interpret direct ray path traveltimes between two boreholes (Auld, 1977; Mok, 1987; Kramer, 1996; Bang et al., 2014; Hossain, 2015). Besides, the program was twisted around the ASTM agreements and test trials delineated for CHST. Processing CHST data requires a rigorous procedure of QA/QC to avoid inverting information that is not representative of the subsurface. This is extremely important where the signal-to-noise ratio of the data is low. The seismograph acquisition unit transferred the analog data into digital data format. The seismic data were uploaded to a computer and processed using the different modules of the software package PSLogTM Data Analysis Software. The primary data processing steps for the analysis of the acquired data are summarized below.
• Raw data are imported into the analysis program. Data are processed by editing recorded traces and applying a frequency filter to enhance the first arrival time information. Filters can also be applied to reduce both high frequency random noise and the long-period noise of uncertain origin. Fig. 5 displays the applied filtering used to enhance the cross-hole collected data throughout the used borehole in the area.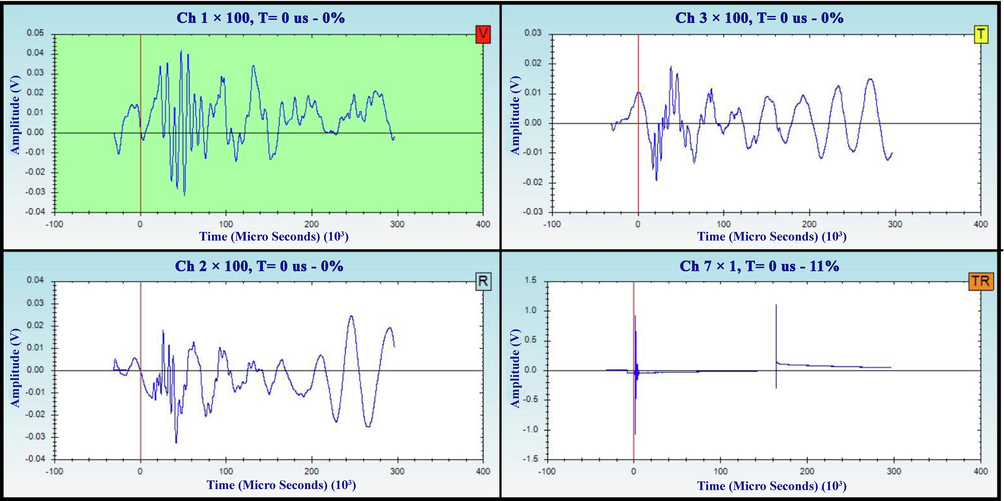
Example of the applied filtering to enhance data collected from the seismic borehole in the area.
• The second step, after the enhancement of the acquired signals, was the Picking of CHST first arrivals. This involved phase reading of the first arrivals of P- and S-waves. These “first arrival times” were determined by selecting the time at which each receiver component recorded the first coherent energy. Picking first arrivals on CHST records relies on subjective estimates of first break positions and can be difficult at deeper geophone depths where the signal-to-noise ratio is poor. Fig. 6 shows the selected first arrival times (red symbols) for the three surveyed boreholes. S-wave arrivals were selected after applying the vectorial sum of the radial and transverse components using Wingeo-TTM Software.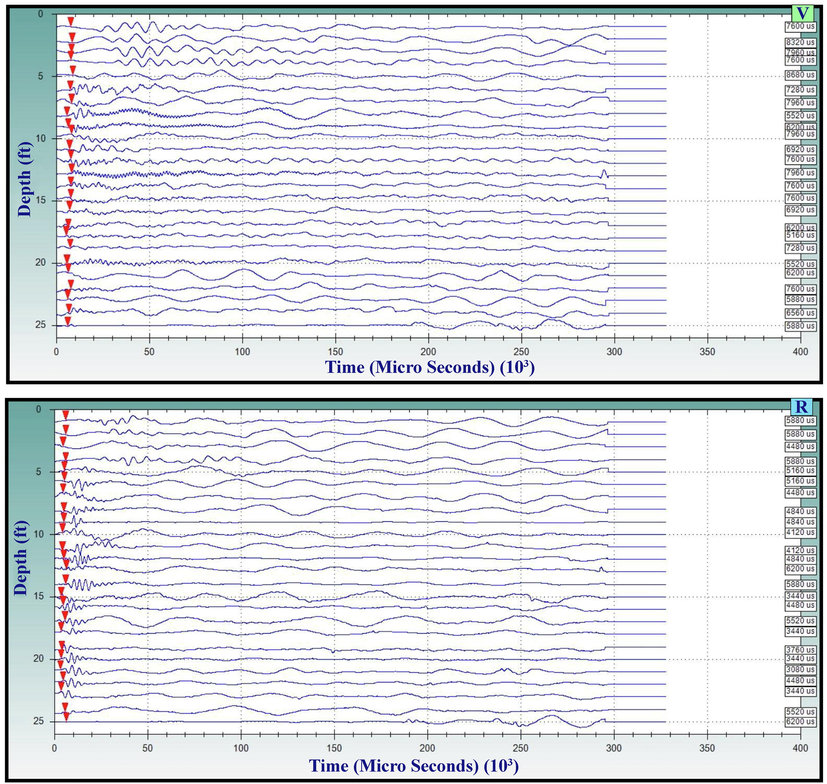
First break selection of the P-wave (up) from the vertical component and corresponding selection of the S-wave (down) from the vectorial sum component for the surveyed borehole.
5 Results
The data extracted from the CHST consist of sets of times (first arrival times) measured at various depths from the source positions. Meanwhile, these are designed versus vertical time axes and horizontal distance axes, the incline of any line is identical defines the reciprocal of a velocity: steep slopes correspond to slow velocities. If the arrival times arranged on a clearly defined straight-line segments, best-fit lines may be drawn. In the current project, the corrected time for the P- and S-waves was calculated, so that the average velocity of seismic waves in homogeneous layers of soil was represented by the inclination of the line segments along which the experimental data are aligned (Fig. 7).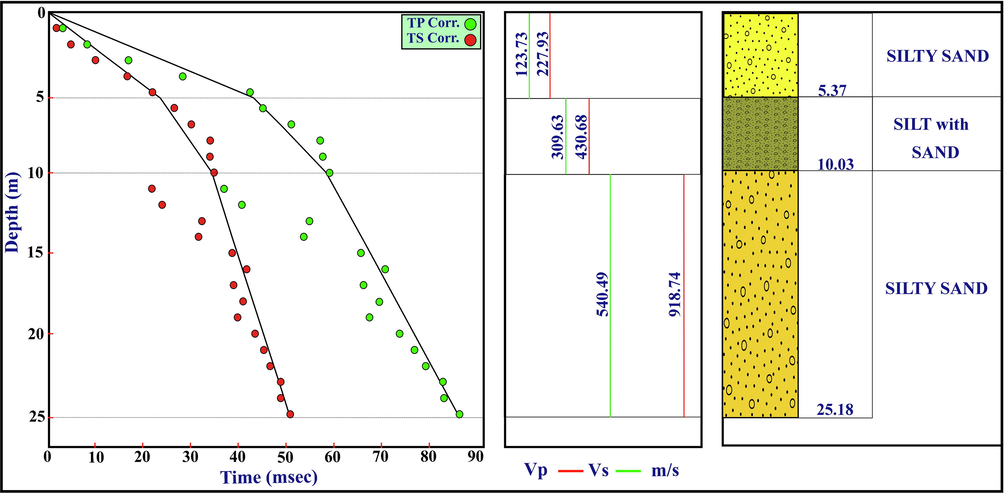
Interpreted travel time graphs used for the determination of velocity values for the surveyed borehole.
The current CHST, using the direct interpretation method, was used to determine elastic parameters (Poisson’s ratio, shear modulus, elastic bulk modulus, Lamé parameter), for rock competence in geotechnical application. With the direct method, the travel times (t) must initially be corrected and measured along the source-receiver paths to account for the inclination of the path of the waves and then realize the chart tcor-z for both P-waves and S-waves. Thus, the average velocity in homogeneous layers of soil is represented by the inclination of the line segments along which the experimental data are aligned. Depending on the identification of subsurface layers, the average density can be obtained through the velocity – depth relationship, Poisson’s ratio, shear deformation modulus, Young’s modulus as well as the bulk modulus (Table 2).
(a)
Depth (m)
Vpavg (m/s)
Vsavg (m/s)
(Vp/Vs) Ratio
Description
5.37
227
123
1.84
SILTY SAND
10.03
430
309
1.4
SILT and SAND
25.18
918
540
1.7
SILTY SAND
(b)
ρ kg m−3
M (GPa)
E (GPa)
µ (GPa)
λ (GPa)
K (GPa)
V (GPa)
1203
0.06
0.05
0.02
0.03
0.04
0.295
1411
0.26
0.26
0.13
0.01
0.08
0.034
1706
1.44
1.23
0.50
0.44
0.77
0.235
6 Conclusions
The environmental threats of soil stability in terms of soil subsidence in Jeddah city have been achieved in this study, through the estimation of both shear and compressional wave velocity versus depth (1.0 m logging interval) using CHST. These measurements can be used to obtain dynamic soil properties: shear modulus, Young’s modulus, and Poisson’s ratio. These parameters have been confirmed to be useful for determining solutions of a wide range of engineering tasks. The estimated velocities of a soil/ rock can provide important data about the bulk physical characteristics of the soil/rock, including how the rock will deform under a given load/stress. The stress status for a given volume of rock is of substantial concern frequently during the building of large structures. The computed values of the elastic constants agree with the values obtained in other areas and from boring (Fig. 8). The values show that the soils within the study areas are soft, fractured, and poorly graded. The second layer, which is composed of silt, needs special engineering treatment as it shows low values of Vp/Vs ratio and elastic parameters. The calculated velocity model and the derived layer moduli deliver critical information about the mechanical resistance of the subsoil. The presence and approximated thickness of low velocity layers, which can constitute a risk for the foundations of civil engineering projects, is specially enhanced with the procedure described. It is highly recommended to consider these results to define sites of land subsidence and determine the parameters that can inform solutions for environmental hazard mitigation in Jeddah city.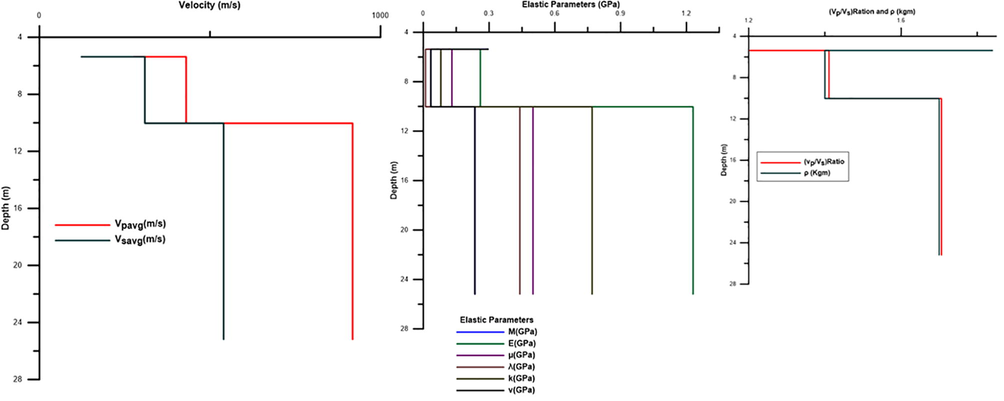
Illustration of the velocity profile and elastic properties of P- and S-waves with depth.
Acknowledgments
The authors extend their appreciation to the Deputyship for Research & Innovation, “Ministry of Education “in Saudi Arabia for funding this research work through the project number IFKSURG-1436-011.
Declaration of Competing Interest
The authors declare that they have no known competing financial interests or personal relationships that could have appeared to influence the work reported in this paper.
References
- Evaluation of the kinetic moduli of the surface materials and application to engineering geologic maps at Ma’Barrisabah area (Dhamar province), Western Yemen. Egypt J. Geol.. 1989;33(1–2):229-250.
- [Google Scholar]
- Geophysical interpretations for shallow engineering site investigations at the area north of Sana’a, Yemen Arab Republic. MERC. 1990;4:41-51.
- [Google Scholar]
- Abd El Rahman, M., Setto, I.,El Werr, A., 1991.Seismic refraction interpretation for shallow engineering site investigations at the distinctive district 6th of October City. In: E.G.S. Proc. of the 9th Ann. Meet., pp. 229–242.
- Inferring mechanical properties of the foundation materials at the 2nd Industrial zone, 10th of Ramadan City, from geophysical measurements. In: E.G.S. Proc. of the 10th Ann. 1992.
- [Google Scholar]
- Abd El Rahman, M., Helal, A. N., Mohamed, H., El-Malqi, I., 1994. Exploration seismic for site evaluation at the new city of El-Minya, Egypt. In: E.G.S. Proc. of the 12th Ann. Meet., pp. 59–74.
- Al humimidi M.S., 2020. Geotechnical assessment of near-surface sediments and their hazardous impact: Case study of Jizan city, southwestern Saudi Arabia. J. King Saud Univ. – Sci. 32, 2195–2201.
- Al-Taie, A.J., 2017. Dynamic deformation modulus of weak rock measured from laboratory and field tests. Assoc. Arab Univ. J. Eng. Sci. 24(1), 1–11.
- Anbazhagan, P., Sitharam, T.G., 2006. Evaluation of dynamic properties and ground profiles using MASW: Correlation between Vs and N60. In: 13th symposium on earthquake engineering, Indian Institute of Technology, Roorkee, Dec. 18-20, 2006, Paper No. 008.
- Elastic properties of materials of the earth’s crust. In: Gutenberg, ed. Internal Construction of the Earth. New York: Dover publications, Inc.; 1951.
- [Google Scholar]
- Crosshole seismic tomography and borehole logging for engineering site characterization in Sikeston, MO, USA. Tectonophysics. 2003;368:119-137.
- [Google Scholar]
- Auld, B., 1977. Cross-hole and down-hole VS by mechanical impulse. J. Geotech Eng Div, ASCE1977 103(12), 1381–1398.
- Mean refracted ray path method for reliable downhole seismic data interpretations. Soil Dyn. Earthquake Eng.. 2014;65:214-223.
- [Google Scholar]
- Integrated analysis and interpretation of cross-hole P- and S-wave tomograms: A case study. Near Surf. Geophys.. 2009;7:101-109.
- [Google Scholar]
- Gazetas, G., 1991. Formulas and charts for impedances of surface and embedded foundations. https://doi.org/10.1061/(ASCE)0733-9410(1991)117:9(1363).
- Hossain, A.S.M., 2015. PS Logging for Site Response Analysis in Dhaka City. 10.13140/RG.2.2.30107.41767.
- IS: 5249-1992, 1992. Indian Standard determination of dynamic properties of soil - method of test (2nd revision). Foundation Engineering Sectional Committee, bureau of Indian standards. p. 16.
- Kamal Abdelrahman, Al-Amri, A., Al-Arifi, N., Abdelmoneim, E., 2017a. Seismic Risk Assessment at the Proposed Site of Gemsa Wind Power Station, South-western Coast of Gulf of Suez, Egypt. J Geol. Soc. India 89, 192–196.
- Seismic vulnerability assessment in the new urban area of Diriyah Governorate, Riyadh, Saudi Arabia. Arab. J. Geosci.. 2017;10:434.
- [CrossRef] [Google Scholar]
- Ground motion acceleration and response spectra of Al-Mashair area, Makkah Al-Mukarramah, Saudi Arabia. Arab. J. Geosci.. 2019;12:346.
- [CrossRef] [Google Scholar]
- Kamal Abdelrahman, Al-Amri, A., Al-Otaibi, N., Fnais, M., 2020a. Geotechnical assessment for the ground conditions in Makah Al-Mukarramah city, Saudi Arabia. J. King Saud Univ. – Sci. 32, 2112–2121.
- Kamal Abdelrahman, Naif Al-Otaibi, Elkhedr Ibrahim, 2020b. Assessment of land subsidence as an environmental threat facing Dammam city, eastern Saudi Arabia based on soil geotechnical parameters using downhole seismic approach. J. King Saud Univ. – Sci. 33, 101233.
- Evaluation of various downhole data reduction methods to obtain reliable Vs profile. Geotech. Test. J.. 2004;27:585-597.
- [Google Scholar]
- Mapping organic contamination by detection of clay-organic processes. In: Proc. AGWSE/ NWWA/ API. 1966.
- [Google Scholar]
- Geotechnical earthquake engineering. Upper Saddle River, New Jersey: Prentice Hall; 1996. p. :207-208.
- (2019) Application of cross-hole tomography for assessment of soil stabilization by grout injection. Geosciences. 2019;9:399.
- [CrossRef] [Google Scholar]
- Luna, R., Jadi, H., 2000. Determination of dynamic soil properties using geophysical methods. In: Proceedings of the first international conference on the application of geophysical and ndt methodologies to transportation facilities and infrastructure, St. Louis, MO., pp. 1–15.
- Mok, Y.J., 1987. Analytical and experimental studies of borehole seismic methods [Ph.D. dissertation]. The Department of Civil Engineering. USA: The University of Texasat, Austin.
- Park, C.S., Lim, J.Y., Choi, C.L., Kong, B.C., Mok, Y.J., 2008. Recent development of borehole seismic tests. In: The 14th World Conference on Earthquake Engineering, October 12-17, 2008, Beijing, China.
- Ravi, S., 2017. Geotechnical investigations in difficult ground conditions – Indian experiences. Sixth Madhav Lecture, JNTU Hyderabad, October 2017.
- Role of Geotechnical Properties of Soil on Civil Engineering Structures. 2017;7:103-109.
- [CrossRef]
- Stipho A.S., 1984Soil conditions and foundation problems in the desert region of the Middle East. In: First Int Conf case Hist Geotech Eng. May 6–11, St Louis, Missouri.
- Woods, 1994. Geophysical Characterization of Sites. International Science Publisher, p. 141.
- Wightman, W.E., Jalinoos, F., Sirles, P., Hanna, K., 2003. Application of Geophysical Methods to Highway Related Problems. Federal Highway Administration, Central Federal Lands Highway Division, Lakewood, CO, Publication No. FHWA-IF-04-021, September 2003. http://www.cflhd.gov/resources/agm/
- Correlation of mineralogical and textural characteristics with engineering properties of granitic rock from Hulu Langat, Selangor. Proc. Chem.. 2016;19:975-980.
- [CrossRef] [Google Scholar]


