

Translate this page into:
Enhancing early detection of autistic spectrum disorder in children using machine learning approaches
⁎Corresponding authors. rayub@ksu.edu.sa (Rashid Ayub), syedansr@gmail.com (Syed Immamul Ansarullah)
-
Received: ,
Accepted: ,
This article was originally published by Elsevier and was migrated to Scientific Scholar after the change of Publisher.
Abstract
Diagnosing Autism Spectrum Disorder (ASD) presents a multifaceted challenge, demanding accurate and efficient screening methods. Applying machine learning techniques offers a promising avenue for enhancing diagnostic accuracy and efficiency. This research investigates the efficiency of machine learning in distinguishing individuals with ASD from those without, utilizing a comprehensive dataset comprising screening questions, demographic factors, and ASD related diagnostic classifications. We applied chi-square feature selection technique and also tested Random Forest, Logistic Regression, Gradient Boosting Classifier, and Extra Trees Classifier. Each model showed optimal performance and exhibit high precision, recall, and F1-score for both ASD-positive and ASD-negative instances. Additionally, AUROC curves further validated the models’ exceptional discriminatory abilities, with exceptional results. Our findings highlight the potential of machine learning algorithms for enhancing ASD diagnosis accuracy and efficiency in clinical settings. Further research and validation on larger datasets are required to understand the importance of machine learning methods in ASD diagnosis.
Keywords
Autism Spectrum Disorder (ASD)
Machine Learning
Behavioral Patterns
Neurological and Developmental Disorders
Classification
Diagnosis

- ASD
-
Autism Spectrum Disorder
- ML
-
Machine Learning
- DL
-
Deep Learning
- ADDM
-
Autism and Developmental Disabilities Monitoring
- ADHD
-
Attention-Deficit/Hyperactivity Disorder
- CNN
-
Convolutional Neural Network
- TP
-
True Positive
- TN
-
True Negative
- FP
-
False Positive
- FN
-
False Negative
- NPV
-
Negative Predictive Value
- AUROC
-
Area under the Receiver Operating Characteristic curve
Abbreviations
1 Introduction
Autism spectrum disorder (ASD) is a neurological and developmental disorder that has an impact on the social and cognitive skills of children causing social interaction and communication challenges, repetitive behaviors, sensory issues and restricted interests (Midouhas et al., 2013). Autism is described as a “developmental disorder” because symptoms generally appear in the first 2 years of life (Lanyi et al., 2022; Menezes et al., 2021). Autism is also known as a “spectrum” disorder it encompasses a diverse range of conditions and varying severity of symptoms experienced by individuals (Brown, 2024; Dickinson et al., 2024). The spectrum is not measured on scale from less autistic to more severe autistic; rather, it denotes how individuals with autism function across various areas, as described in Fig. 1. Although ASD can be a lifelong disorder however, treatments and services have the potential to improve a person’s symptoms and daily functioning (Bedford et al., 2024). Diagnosing ASD in adults is often more difficult than in children because some ASD symptoms can overlap with symptoms of other mental health disorders, such as anxiety disorder or attention-deficit/hyperactivity disorder (ADHD) (Murphy et al., 2024; Zwaigenbaum and Penner, 2018). Research findings indicate that approximately 2 in 100 children receive a diagnosis of ASD when examining prevalence (Campisi et al., 2018). However, reported prevalence rates vary significantly between studies due to differences in diagnostic criteria, research methodologies, and the demographics of the populations studied (Kogan et al., 2018). This variability emphasizes the importance of careful interpretation when assessing ASD prevalence, considering factors such as geographical location, access to healthcare, and cultural perspectives on autism (Goel et al., 2018). Addressing the complexities of ASD involves navigating a multifaceted landscape of challenges that individuals with ASD and their caregivers confront daily (Lord et al., 2018). Alarmingly, statistics reveal that approximately 40 % of individuals with autism are nonverbal, exacerbating the challenges they encounter in communication and expression (Erkan and Thanh, 2020). Moreover, the presence of intellectual disabilities further compounds the situation, with 31 % of children grappling with significant challenges in daily functioning, and another 25 % falling within the borderline range of intellectual abilities (Rasul et al., 2024; Thabtah, 2017). Furthermore, the prevalence of self-injurious behaviors among individuals with ASD, such as head banging and skin scratching, underscores the urgency of addressing the complex needs and vulnerabilities within this population (Andrews et al., 2019). Perhaps most distressing is the sobering reality that drowning remains a leading cause of death for children with autism, accounting for approximately 90 % of fatalities associated with wandering or bolting among those aged 14 and younger (Christensen et al., 2019). These statistics underscore the imperative to develop effective interventions and support systems that can mitigate risks and enhance the quality of life for individuals with ASD and their families (Hirota and King, 2023). To expedite the diagnostic process and minimize formal evaluations, machine learning ASD tools have been developed (Rahman et al., 2020). These machine learning techniques offer quick and accurate assessment of ASD risk, facilitating faster access to critical therapies for families (Alkahtani et al., 2023). However, as machine learning advances ASD diagnosis and treatment, ethical implementation, and privacy considerations remain paramount. (Fig. 2 and Table 1).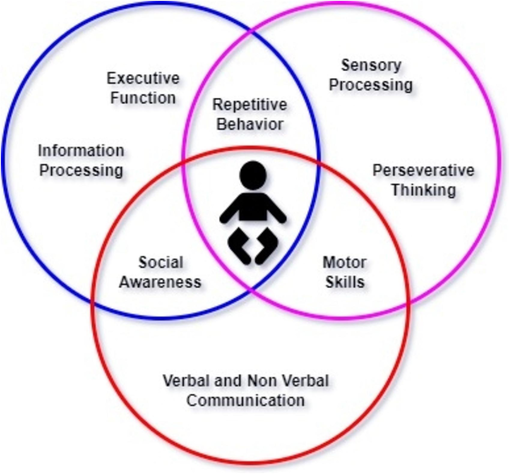
Diagnostic Framework for Autism Spectrum Disorder (ASD).
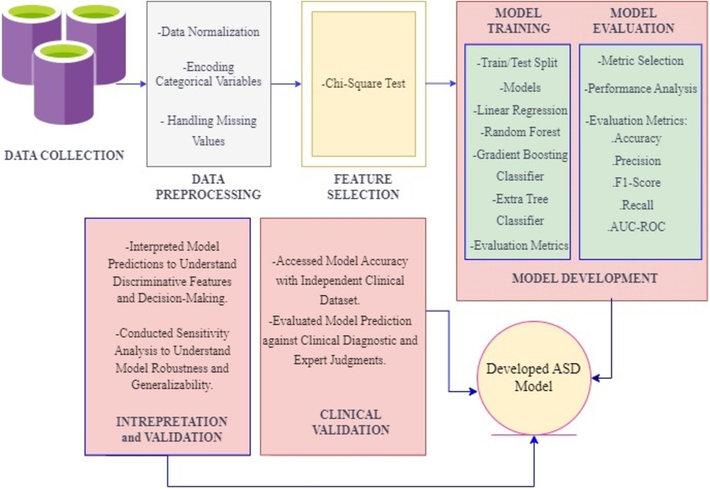
Methodological Approach for the Development of ASD Diagnostic Model.
Attribute
Type
Description
Age
Number
Years
Gender
String
Male or Female
Ethnicity
String
List of common ethnicities in text format
Born with jaundice
Boolean (yes or no)
Whether the case was born with jaundice
Family member with PDD
Boolean (yes or no)
Whether any immediate family member has a PDD
Who is completing the test
String
Parent, self, caregiver, medical staff, clinician, etc.
Country of residence
String
List of countries in text format
Used app before
Boolean (yes or no)
Whether the user has used a screening app
Screening Method Type
Integer (0,1,2,3)
The type of screening methods chosen based on age category (0 = toddler, 1 = child, 2 = adolescent, 3 = adult)
Question 1 Answer
Binary (0, 1)
The answer code of the question based on the screening method used
Question 2 Answer
Binary (0, 1)
The answer code of the question based on the screening method used
Question 3 Answer
Binary (0, 1)
The answer code of the question based on the screening method used
Question 4 Answer
Binary (0, 1)
The answer code of the question based on the screening method used
Question 5 Answer
Binary (0, 1)
The answer code of the question based on the screening method used
Question 6 Answer
Binary (0, 1)
The answer code of the question based on the screening method used
Question 7 Answer
Binary (0, 1)
The answer code of the question based on the screening method used
Question 8 Answer
Binary (0, 1)
The answer code of the question based on the screening method used
Question 9 Answer
Binary (0, 1)
The answer code of the question based on the screening method used
Question 10 Answer
Binary (0, 1)
The answer code of the question based on the screening method used
Screening Score
Integer
The final score obtained based on the scoring algorithm of the screening method used. This was computed in an automated manner
2 Related work
The diagnosis and intervention of ASD have become pressing issues due to the increasing prevalence of the condition. Over the years, researchers have made significant strides in leveraging machine learning (ML) and deep learning (DL) techniques to enhance the detection and understanding of ASD. Bone et al. (2014) demonstrated the potential of ML in enhancing diagnostic and intervention research by analyzing large behavioral ASD datasets, leading to insights into the heterogeneous nature of ASD and the customization of interventions to individual needs (Bone et al., 2015). Maenner et al. (2021) furthered this progress by developing a ML approach for classifying case status in Autism and Developmental Disabilities Monitoring (ADDM), using language features from children's evaluations (Maenner et al., 2021) (Maenner et al., 2021). Alves et al. (2023) diagnosis the ASD based on functional brain networks and machine learning approaches, which provides medical interpretability and can be used on other fMRI and EEG data, including small data sets (Alves et al., 2023). Building upon these foundations, Tariq et al. (2018) developed a mobile detection system for ASD using ML on home videos, offering a potential solution to accelerate diagnosis and reach underserved populations (Tariq et al., 2018). Subsequent studies by Jacob et al. (2019) explored the complexities of ASD diagnosis, leveraging supervised and unsupervised ML models, as well as deep learning networks, to enhance classification accuracy (Jacob et al., 2019). Raj and Masood (2020) demonstrated the superior performance of CNN-based prediction models in ASD detection, particularly in handling missing values (Raj and Masood, 2020). In parallel, Okoye et al. (2023) developed predictive models for early ASD detection, highlighting logistic regression's accuracy among the evaluated models (Okoye et al., 2023). Eslami et al. (2021) further expanded the scope by exploring ML and DL techniques for diagnosing both ASD and ADHD, addressing challenges such as overfitting and data distribution (Eslami et al., 2021). These collective efforts underscore the transformative potential of ML and DL in enhancing ASD diagnosis and understanding.
In recent studies, Elshoky et al. (2022) explored the application of ML techniques for creating predictive models using facial images of children (Elshoky et al., 2022), while Moridian et al. (2022) conducted a comprehensive review of automated ASD detection methods using Magnetic resonance imaging (MRI) neuroimaging and AI (Moridian et al., 2022). Bahathiq et al. (2022) provided a comprehensive review emphasizing the ongoing need for advancements in ASD diagnosis using ML, addressing challenges such as limited sample sizes and highlighting trends like leveraging big data and advanced imaging techniques (Bahathiq et al., 2022). Meanwhile, Shinde and Patil (2023) proposed methods to improve ASD diagnosis through a multi-classifier recommender model, underscoring the importance of dataset size in enhancing accuracy (Shinde and Patil, 2023). Collectively, these studies contribute to advancing ASD detection and diagnosis, offering new insights and methodologies for early intervention. Additionally, Alkahtani et al (2023) developed an expert system for ASD identification based on facial landmarks of children, furthering the capabilities of computer vision in ASD detection, thus addressing critical needs in healthcare (Alkahtani et al., 2023). These studies underscore the value of ML in advancing our understanding of ASD and suggest promising avenues for collaborative research at the intersection of computational and behavioral science.
3 Methodological approach
This research methodology presents a thorough framework for diagnosing ASD. The dataset utilized is sourced from the UC Irvine Machine Learning Repository (Thabtah, 2017). The missing values within the dataset are represented by ‘?’ and to address them we applied imputation techniques substituting missing values with the mean, median, or mode of the corresponding attribute. Furthermore, encoded techniques such as one-hot encoding are applied to transform categorical variables into numerical representations, enabling machine learning algorithms to process the data effectively. These systematic procedures contribute to the refinement and uniformity of the dataset, thereby fostering precise analysis.
Further, we applied the chi-square feature selection test to check a significant association between categorical variables (Semary et al., 2024). We then employed a range of machine learning algorithms, such as linear regression, random forest, gradient boosting classifier and extra tree classifier chosen for their suitability in classification tasks and ability to handle diverse data types in our dataset. The ASD model was developed on 80 % of the training dataset and tested on the remaining 20 %. To validate the model, we conducted both cross-validation and external validation. Cross-validation was performed using 10-fold stratified sampling to ensure robustness and generalizability across multiple folds. Additionally, external validation with an independent dataset and clinical validation confirmed the efficacy of the model in diagnosing ASD, providing a more reliable estimate of its real-world performance.
4 Dataset description
In this study, we leverage a dataset (as described in table 1) tailored for screening ASD in children, sourced from the UC Irvine Machine Learning Repository, a reputable platform housing dataset curated for machine learning research (Thabtah, 2017). Comprising a range of attributes pertinent to ASD diagnosis, the dataset includes scores for ten screening questions (A1 to A10), as well as information on age, gender, ethnicity, history of jaundice, family history of autism, country of residence, prior use of ASD screening applications, and final diagnostic classification (Mahmoud et al., 2023). These attributes offer valuable insights into factors influencing ASD and its early detection.
The chosen features hold significance due to their relevance to ASD screening and diagnosis. The ten screening questions reflect behavioral patterns commonly associated with ASD. Age, gender, and ethnicity can shape the presentation of ASD symptoms, informing our understanding of its prevalence and manifestation across diverse demographic groups. Details such as jaundice history, family autism history, and prior screening application usage provide additional context on potential risk factors and previous diagnostic attempts. Lastly, the diagnostic classification acts as the outcome variable, facilitating the assessment of the screening tool's efficacy in identifying children with ASD.
5 Feature selection and performance measures in ASD diagnosis
5.1 Simplifying ASD analysis with Chi-Square test
The chi-square test is a statistical method used to determine the presence of a significant association between two categorical variables by comparing observed frequencies with expected frequencies, assuming no connection between the variables. It evaluates the null hypothesis (H0) which imagines that no relationship exists between the categorical variables in the data, implying they are independent, while the alternative hypothesis (H1) suggests an association between the variables. In this research, we used chi-square test in the opposite direction, where significance level of p < 0.05 indicates a rejection of the null hypothesis, implying a dependency between the variables. Essentially, a lower probability threshold (p < 0.05) is chosen to detect any significant associations between the categorical variables.
In this research, variables like gender and used_app_before were excluded from further analysis based on chi-square test results. For instance, the chi-square value for gender was low (0.004), with a corresponding p-value of 0.943, significantly higher than 0.05, indicating no statistically significant association with autism. Similarly, the chi-square statistic for “used_app_before” was moderate (1.05), and its p-value (0.300) exceeded 0.05, affirming no statistically significant association between this variable and autism (Table 2 & Table 3).
Category
Chi-Square
p-value
P < 0.05
0
Gender
0.004985
8.9568808e-01
False
1
Jaundice
11.978454
5.875686e-04
True
2
Autism
84.527867
1.526148e-20
True
3
used_app_before
1.042585
3.001534e-01
False
Category
Chi-Square
p-value
P < 0.05
0
A1_Score
31.780269
1.726377e-08
True
1
A2_Score
52.239554
4.912658e-13
True
2
A3_Score
93.479438
4.104424e-22
True
3
A4_Score
117.490026
2.242249e-27
True
4
A5_Score
103.205602
3.021106e-24
True
5
A6_Score
164.237125
1.342643e-37
True
6
A7_Score
98.621908
3.056194e-23
True
7
A8_Score
38.351519
5.908208e-10
True
8
A9_Score
86.734950
1.240845e-20
True
In this case, since the p-values for all variables are significantly less than 0.05, it indicates that there is a highly significant association between each of these variables (A1_Score, A2_Score, A3_Score, A4_Score, A5_Score, A6_Score, A7_Score, A8_Score, A9_Score) and the outcome variable. This suggests that these variables are important predictors or indicators of the outcome to autism in the dataset being analyzed.
5.2 Model evaluation measures
We used various performance measures to ensure that developed ASD diagnostic model works effectively. These measures collectively guide us in refining and optimizing the model for accurate and reliable diagnosis.
a. True Positive (TP): TP, also known as sensitivity, represents the cases where the model correctly predicts individuals with ASD. A True Positive indicates that the model correctly identifies individuals who have ASD, enabling timely intervention and support (Ahmed et al., 2022).
b. True Negative (TN): TN, also known as specificity, represents the cases where the model correctly predicts individuals without ASD. A true negative suggests that the model accurately identifies individuals who do not have ASD, avoiding unnecessary interventions and treatments (Ahmad Fayaz et al., 2023).
c. False Positive (FP): These are cases where the model incorrectly predicts individuals as having ASD when they do not have. A false positive may lead to unnecessary stress and concern for individuals and their families, as well as potential misallocation of resources for interventions (Maenner et al. 2020).
d. False Negative (FN): These are cases where the model incorrectly predicts individuals as not having ASD when they actually have. False negatives are concerning because they may result in missed opportunities for early intervention and support, delaying diagnosis and treatment for individuals with ASD.
e. Positive Predictive Value (Precision): Precision measures the proportion of individuals predicted to have ASD who actually have the disorder. High precision ensures that individuals identified as having ASD are more likely to truly have the disorder, reducing the risk of over diagnosis (Atlam et al., 2024).
f. Negative Predictive Value (NPV): NPV measures the proportion of individuals predicted not to have ASD who truly do not have the disorder. NPV reflects the model's ability to rule out ASD for individuals without the disorder, complementing the information provided by sensitivity and specificity.
g. Area under the Receiver Operating Characteristic curve (AUROC): AUROC evaluates the model's ability to distinguish between individuals with and without ASD across different decision thresholds. A higher AUROC value indicates better discrimination ability, with 1 representing perfect discrimination and 0.5 representing random chance.
6 ASD diagnosis advancement through machine learning models
In our research on ASD disease diagnosis, we divided the dataset into a training set comprising 80 % of the data and a testing set containing 20 % of the data. Due to the limited number of instances in the dataset, we applied 10-fold cross-validation on the training set. This method involves dividing the data into k equal-sized folds, training the model on k-1 folds, and validating it on the remaining fold. This process is repeated k times, ensuring robust performance evaluation through averaging the results.
6.1 Random Forest model
Random forest is an ensemble learning technique that consists of multiple decision trees. Each tree is trained on a random subset of the training data and a random subset of features. Through a voting mechanism, predictions from individual trees are aggregated, resulting in a final prediction. This ensemble approach enhances prediction accuracy and robustness (Abdelwahab et al., 2024). We applied Random Forest to our ASD dataset and obtained the results described in Table 4. The developed random forest model’s performance is measured using various evaluation metrics. These metrics provide valuable insights into the model's effectiveness in distinguishing between instances of “absence of ASD” and “presence of ASD.”.
-
Precision Analysis: Our analysis revealed a precision of 0.96 for the class “absence of ASD,” indicating that 96 % of instances predicted as not having ASD were indeed true negatives. Conversely, the precision for the class “presence of ASD” was 0.98, demonstrating that 98 % of instances predicted as having ASD were true positives.
-
Recall Assessment: In terms of recall, the model achieved a recall of 0.98 for the class “absence of ASD,” correctly identifying 98 % of all instances not associated with ASD. For the class “presence of ASD,” the recall was 0.96, indicating that 96 % of all actual ASD instances were correctly identified by the model.
-
F1-Score Evaluation: The F1-score, a balanced measure of precision and recall, yielded scores of 0.97 for both classes. This highlights the model's ability to minimize both false positives and false negatives in ASD diagnosis, contributing to its overall effectiveness.
-
Support Analysis: Examining the support values revealed 179 instances of “absence of ASD” and 200 instances of “presence of ASD” within the dataset. These support values provide insights into the distribution of data and the prevalence of each class.
-
Accuracy Examination: Our model achieved an overall accuracy of 97 %, indicating its high level of correctness in predicting both classes collectively. This underscores the model's reliability in accurately diagnosing ASD across the dataset.
-
Average Metrics Interpretation: Additionally, both macro and weighted averages yielded consistent scores of 0.97, reflecting the model's consistent performance across all classes. These average metrics provide a comprehensive overview of the model's effectiveness in ASD diagnosis.
| Class | Precision | Recall | F1-Score | Support |
|---|---|---|---|---|
| 0 | 0.96 | 0.98 | 0.97 | 179 |
| 1 | 0.98 | 0.96 | 0.97 | 200 |
| Accuracy | 0.97 | 379 | ||
| Macro Avg. | 0.97 | 0.97 | 0.97 | 379 |
| Weighted Avg. | 0.97 | 0.97 | 0.97 | 379 |
We also conducted an assessment of the AUROC curve to evaluate the performance of the random forest model in the context of ASD diagnosis (Fig. 3a-d). The AUROC curve, with an AUC = 1.00, underscores the model's exceptional capability to accurately differentiate between individuals with ASD and those without ASD across various thresholds of discrimination. This perfect AUC value signifies the model's ability to achieve a true positive rate of 1 (sensitivity) and a false positive rate of 0 (specificity), thereby ensuring precise predictions for all instances in the dataset. In practical terms, the flawless performance of the Random Forest model in identifying individuals with ASD while minimizing misclassifications of non-ASD cases highlights its robust reliability and efficacy for ASD diagnosis.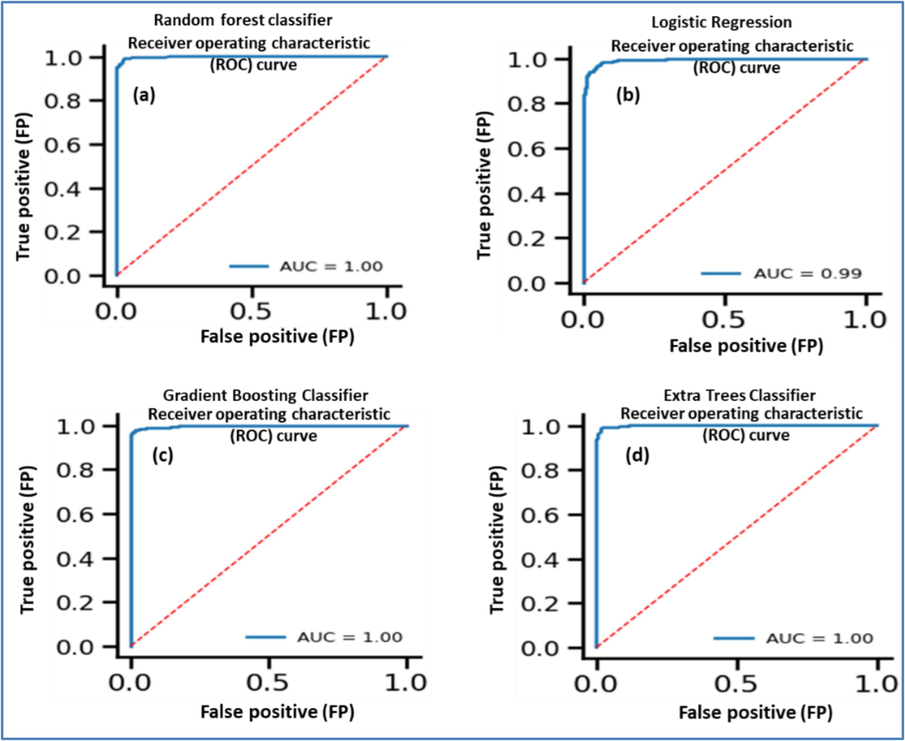
AUROC curve for ASD classification using (a) random forest, (b) logistic regression, (c) gradient boosting, (d) extra tree classifier.
Overall, these findings demonstrate the strong performance of the random forest machine learning model in accurately diagnosing ASD. With high precision, recall, F1-score, support, accuracy, and average metrics the model showcases promising potential for ASD diagnosis in clinical settings.
6.2 Logistic regression model
Logistic regression is a linear binary classification model which gives the probability that an instance belongs to a particular class using a logistic (sigmoid) function. Logistic regression estimates the coefficients for each feature, which represent the impact of that feature on the log-odds of the target class. Logistic Regression could be used to model the probability of a child having ASD based on the given features (Ansarullah et al., 2024). We applied logistic regression to our ASD dataset and obtained the results described in Table 5.
-
Precision: The precision metric reflects the proportion of true positive predictions out of all positive predictions made by the model. For class 0 (indicating the absence of ASD), the precision is 0.96, indicating that 96 % of instances predicted as not having ASD were indeed true negatives. Similarly, for class 1 (indicating the presence of ASD), the precision is also 0.96, demonstrating that 96 % of instances predicted as having ASD were true positives.
-
Recall: Recall, also known as sensitivity, measures the model's ability to correctly identify actual positive instances. With a recall of 0.96 for both class 0 and class 1, the model accurately identified 96 % of all instances not associated with ASD and 96 % of all actual ASD instances, respectively.
-
F1-Score: The F1-score, a harmonic mean of precision and recall, provides a balanced measure of the model's accuracy. Both class 0 and class 1 exhibit F1-scores of 0.96, indicating a high level of precision and recall for both classes.
-
Support: Support denotes the number of actual occurrences of each class in the dataset. In this case, there are 179 instances of class 0 and 200 instances of class 1, contributing to a total of 379 instances.
-
Accuracy: Accuracy measures the overall correctness of the model's predictions. With an accuracy of 0.96, the model achieved a high level of correctness in predicting both classes collectively.
-
Macro and Weighted Averages: Both macro and weighted averages yield consistent scores of 0.96 for precision, recall, and F1-score, reflecting the model's consistent performance across all classes.
| Class | Precision | Recall | F1-Score | Support |
|---|---|---|---|---|
| 0 | 0.96 | 0.96 | 0.96 | 179 |
| 1 | 0.96 | 0.96 | 0.96 | 200 |
| Accuracy | 0.96 | 379 | ||
| Macro Avg. | 0.96 | 0.96 | 0.96 | 379 |
| Weighted Avg. | 0.96 | 0.96 | 0.96 | 379 |
We also conducted an assessment of the AUROC curve to evaluate the performance of the logistic regression model in the context of ASD diagnosis (Fig. 3b). The AUROC curve plots the true positive rate (sensitivity) against the false positive rate (1 − specificity) for different threshold values. The AUC = 0.99 implies that the logistic regression model performed remarkably well in correctly identifying individuals with ASD while minimizing misclassifications of non-ASD cases. The high AUC value underscores the model's reliability and effectiveness in ASD diagnosis, making it a valuable tool for clinical decision-making and patient care.
6.3 Gradient Boosting Classifier
The Boosting Classifier is a machine learning algorithm belonging to the ensemble learning methods. It operates by sequentially combining multiple weak learners, typically decision trees with shallow depth, in a sequential manner to create a strong predictive model. In this method, each weak learner is trained to rectify errors made by preceding ones. This is accomplished by fitting each new model to the residual errors of the ensemble, progressively diminishing the overall prediction error. The algorithm iteratively minimizes a loss function using gradient descent optimization, thereby adjusting the parameters of each weak learner to enhance the model's performance (Ansarullah et al., 2022). We applied gradient boosting classifier to our ASD dataset and obtained the results described in Table 6.
-
Precision: For class 0 (representing the absence of ASD), the precision was 0.97, indicating that 97 % of instances predicted as not having ASD were indeed true negatives. Conversely, for class 1 (indicating the presence of ASD), the precision was 0.98, signifying that 98 % of instances predicted as having ASD were true positives.
-
Recall: The recall for class 0 was 0.98, suggesting that 98 % of all instances not associated with ASD were correctly identified by the model. For class 1, the recall was 0.97, indicating that 97 % of all actual ASD instances were accurately identified by the model.
-
F1-Score: The F1-score, a harmonic mean of precision and recall, yielded scores of 0.98 for both class 0 and class 1. This balanced measure reflects the model's ability to minimize both false positives and false negatives in ASD diagnosis.
-
Support: The dataset comprised 179 instances of class 0 and 200 instances of class 1, providing insights into the distribution of data and the prevalence of each class.
-
Accuracy: The model achieved an overall accuracy of 98 %, demonstrating its high level of correctness in predicting both classes collectively.
-
Macro and Weighted Averages: Both macro and weighted averages yielded consistent scores of 0.98 for precision, recall, and F1-score, indicating the model's consistent performance across all classes.
| Class | Precision | Recall | F1-Score | Support |
|---|---|---|---|---|
| 0 | 0.97 | 0.98 | 0.98 | 179 |
| 1 | 0.98 | 0.97 | 0.98 | 200 |
| Accuracy | 0.98 | 379 | ||
| Macro Avg. | 0.98 | 0.98 | 0.98 | 379 |
| Weighted Avg. | 0.98 | 0.98 | 0.98 | 379 |
In our analysis utilizing the Gradient Boosting Classifier on the ASD dataset, we generated an AUROC with an exceptional AUC value of 1.00 which demonstrates the model's remarkable ability to accurately distinguish between individuals with ASD and those without ASD (Fig. 3c). In summary, the AUROC curve with an AUC value of 1.00 generated by the Gradient Boosting Classifier underscores the model's exceptional reliability and accuracy in ASD diagnosis, making it a highly promising tool for clinical applications.
6.4 Extra Trees Classifier
The Extra Trees Classifier, short for Extremely Randomized Trees Classifier, is a machine learning algorithm that belongs to the ensemble learning family. In Extra Trees Classifier, rather than selecting the best split among a subset of features, as in Random Forest, it randomly selects candidate splits for each feature. This randomness during the tree building process leads to extra diversity among the trees in the ensemble, hence the name “Extra Trees.” By introducing more randomness into the tree construction process, Extra Trees Classifier reduces the variance of the model at the expense of a slight increase in bias. This can sometimes lead to improved generalization performance, especially when dealing with noisy or high-dimensional datasets (Syed Immamul Ansarullah, 2019). This research applied the Extra Trees Classifier model to analyse the ASD dataset, from which we derived the following results as described in Table 7.
-
Precision: The precision metric indicates the proportion of true positive predictions out of all positive predictions made by the model. For class 0 (representing the absence of ASD), the precision is 0.97, suggesting that 97 % of instances predicted as not having ASD were indeed true negatives. Similarly, for class 1 (indicating the presence of ASD), the precision is 0.98, indicating that 98 % of instances predicted as having ASD were true positives.
-
Recall: Recall, also known as sensitivity, measures the proportion of true positive predictions out of all actual positive instances in the dataset. A recall of 0.98 for class 0 means that 98 % of all instances not associated with ASD were correctly identified by the model. Conversely, a recall of 0.97 for class 1 indicates that 97 % of all actual ASD instances were correctly identified by the model.
-
F1-Score: The F1-score, a harmonic mean of precision and recall, provides a balanced assessment of the model's performance. With F1-scores of 0.98 for both classes, the model demonstrates a high level of accuracy in distinguishing between instances of “absence of ASD” and “presence of ASD.”
-
Support: Support refers to the number of actual occurrences of each class in the dataset. In this case, there are 179 instances of class 0 and 200 instances of class 1, indicating a relatively balanced distribution between the two classes.
-
Accuracy: Accuracy measures the overall correctness of the model's predictions. With an accuracy of 98 %, the Extra Trees Classifier model achieved a high level of correctness across all predictions, further emphasizing its effectiveness in ASD diagnosis.
-
Macro and Weighted Averages: Both macro and weighted averages yielded consistent scores of 0.98 for precision, recall, and F1-score, reflecting the model's consistent performance across all classes and accounting for the distribution of instances within each class.
| Class | Precision | Recall | F1-Score | Support |
|---|---|---|---|---|
| 0 | 0.97 | 0.98 | 0.98 | 179 |
| 1 | 0.98 | 0.97 | 0.98 | 200 |
| Accuracy | 0.98 | 379 | ||
| Macro Avg. | 0.98 | 0.98 | 0.98 | 379 |
| Weighted Avg. | 0.98 | 0.98 | 0.98 | 379 |
In our analysis utilizing the Extra Tree Classifier model on the ASD dataset, we generated the AUROC with an AUC value of 1.00 (Fig. 3d), which indicates perfect discrimination by the model, making it highly reliable for ASD diagnosis. Overall, these results highlight the robust performance of the Extra Trees Classifier model in accurately diagnosing ASD, with high precision, recall, F1-score, support, accuracy, and average metrics across both classes.
7 Results and Discussions
In our research on ASD disease diagnosis, we employed several machine learning algorithms and analysed their performance metrics to ascertain their effectiveness in distinguishing between individuals with and without ASD. The Random Forest model demonstrated robust performance, achieving high precision, recall, and F1-score for both classes. This indicates its proficiency in accurately identifying instances of “absence of ASD” and “presence of ASD.” With an impressive overall accuracy of 97 %, the model holds promise for enhancing ASD diagnosis accuracy. The model's exceptional capability to differentiate between ASD-positive and ASD-negative individuals, as evidenced by the AUROC curve with an AUC value of 1.00, signifies its potential to significantly impact clinical decision-making.
Similarly, the Logistic Regression model showcased notable precision, recall, and F1-score for both classes, along with an overall accuracy of 96 %. Its high discriminative accuracy, validated by the AUROC curve with an AUC value of 0.99, suggests its potential utility in aiding clinicians in identifying individuals with ASD. The Gradient Boosting Classifier and Extra Trees Classifier exhibited strong performances also with an overall accuracy of 98 % respectively. Their flawless performance in distinguishing between individuals with ASD and those without ASD, as indicated by the AUROC curve with AUC values of 1.00, underscores their reliability and effectiveness in ASD diagnosis.
The results indicate that all developed machine learning models achieved high performance in accurately diagnosing ASD, with precision, recall, and F1-score consistently above 0.95 for both classes. The models also demonstrated high overall accuracy, reflecting their reliability in predicting ASD across the dataset. The AUROC curves further validated the models' effectiveness, with AUC values close to or equal to 1.00, indicating that the models can make precise predictions while minimizing misclassifications, highlighting their potential for clinical applications in ASD diagnosis.
These findings hold significant implications for ASD diagnosis in clinical settings. By leveraging machine learning algorithms with high predictive accuracy, clinicians can make more informed decisions, leading to earlier detection and intervention for individuals with ASD. Moreover, the precise identification of ASD cases can facilitate the allocation of resources and support services, ultimately improving outcomes for individuals and their families. Furthermore, the utilization of these advanced algorithms can streamline the diagnostic process, potentially reducing wait times and alleviating the burden on healthcare systems. Overall, the findings suggest that machine learning models, particularly ensemble methods like Random Forest, Gradient Boosting Classifier, and Extra Trees Classifier, hold promise for enhancing ASD diagnosis accuracy and efficiency in clinical settings. Further research and validation on larger datasets are warranted to fully assess their clinical utility and impact.
8 Conclusion and Future work
Machine learning techniques show promise in enhancing ASD diagnosis accuracy. Various models, such as Random Forest, Logistic Regression, Gradient Boosting Classifier, and Extra Trees Classifier, were applied to a comprehensive dataset. The results showed high performance, with AUROC curves validating their discriminatory abilities. Particularly, the Random Forest model stood out, achieving 97 % accuracy and a perfect AUROC curve, emphasizing the potential of machine learning algorithms in enhancing ASD diagnosis. Leveraging these algorithms could facilitate earlier detection and intervention, thereby improving outcomes for individuals and families affected by ASD. Furthermore, the adoption of advanced algorithms could streamline the diagnostic process and contribute to a better understanding of ASD epidemiology. However, we acknowledge potential biases or limitations in our methodology, necessitating further research on larger datasets and fostering collaboration between researchers and clinicians. Future plans involve developing a comprehensive ASD model that integrates genetic, behavioral, and medical data for practical use in clinical and research settings, with continuous monitoring and updating, based on new data and research. This model will encompass all available data to develop a unified solution and will be deployed for practical use in clinical and research settings. Continuous monitoring and updating of the model based on new data and emerging research will be essential for maintaining its effectiveness.
CRediT authorship contribution statement
Rashid Ayub: Software, Data curation, Conceptualization. Syed Immamul Ansarullah: Methodology, Investigation, Formal analysis. Faizan Samdani: Visualization, Validation, Software. Ali Akhtar: Writing – original draft, Visualization, Validation, Software. Mohd Afzal: Writing – original draft, Funding acquisition. Shaik Moinuddin Ahmed: Writing – review & editing, Resources, Methodology, Formal analysis.
Acknowledgement
The authors extend their appreciation to Researchers Supporting Project number (RSPD2024R979), King Saud University, Riyadh, Saudi Arabia, for financial assistance.
Declaration of competing interest
The authors declare that they have no known competing financial interests or personal relationships that could have appeared to influence the work reported in this paper.
References
- Autism Spectrum Disorder Prediction in Children Using Machine Learning. J. Disabil. Res.. 2024;3
- [CrossRef] [Google Scholar]
- Impediments of Cognitive System Engineering in Machine-Human Modeling. Comput. Mater. Contin.. 2023;74:6689-6701.
- [CrossRef] [Google Scholar]
- Eye Tracking-Based Diagnosis and Early Detection of Autism Spectrum Disorder Using Machine Learning and Deep Learning Techniques. Electronics. 2022;11:530.
- [CrossRef] [Google Scholar]
- Deep Learning Algorithms to Identify Autism Spectrum Disorder in Children-Based Facial Landmarks. Appl. Sci.. 2023;13:4855.
- [CrossRef] [Google Scholar]
- Diagnosis of autism spectrum disorder based on functional brain networks and machine learning. Sci. Rep.. 2023;13:8072.
- [CrossRef] [Google Scholar]
- A diffusion-weighted imaging tract-based spatial statistics study of autism spectrum disorder in preschool-aged children. J. Neurodev. Disord.. 2019;11:32.
- [CrossRef] [Google Scholar]
- Ansarullah, S.I., Kirmani, M.M., Alshmrany, S., Firdous, A., 2024. Ethical issues around artificial intelligence, in: A Biologist’s Guide to Artificial Intelligence. Elsevier, pp. 301–314. DOI: 10.1016/B978-0-443-24001-0.00018-X.
- A systematic literature review on cardiovascular disorder identification using knowledge mining and machine learning method. Int. J. Recent Technol. Eng. 2019;7(6S):1009-1015.
- [Google Scholar]
- Significance of Visible Non-Invasive Risk Attributes for the Initial Prediction of Heart Disease Using Different Machine Learning Techniques. Comput. Intell. Neurosci.. 2022;2022:1-12.
- [CrossRef] [Google Scholar]
- EASDM: Explainable Autism Spectrum Disorder Model Based on Deep Learning. J. Disabil. Res.. 2024;3
- [CrossRef] [Google Scholar]
- Machine learning for autism spectrum disorder diagnosis using structural magnetic resonance imaging: Promising but challenging. Front. Neuroinform.. 2022;16
- [CrossRef] [Google Scholar]
- Brain-charting autism and attention deficit hyperactivity disorder reveals distinct and overlapping neurobiology. Biol. Psychiatry. 2024
- [CrossRef] [Google Scholar]
- Applying Machine Learning to Facilitate Autism Diagnostics: Pitfalls and Promises. J. Autism Dev. Disord.. 2015;45:1121-1136.
- [CrossRef] [Google Scholar]
- Brown, R.T., 2024. Psychopharmacology, in: Encyclopedia of Adolescence. Elsevier, pp. 432–447. DOI: 10.1016/B978-0-323-96023-6.00044-0.
- Prevalence and Characteristics of Autism Spectrum Disorder Among Children Aged 4 Years — Early Autism and Developmental Disabilities Monitoring Network, Seven Sites, United States, 2010, 2012, and 2014. MMWR. Surveill. Summ.. 2019;68:1-19.
- [CrossRef] [Google Scholar]
- Parsing evoked and induced gamma response differences in Autism: A visual evoked potential study. Clin. Neurophysiol.. 2024;165:55-63.
- [CrossRef] [Google Scholar]
- Comparing automated and non-automated machine learning for autism spectrum disorders classification using facial images. ETRI J.. 2022;44:613-623.
- [CrossRef] [Google Scholar]
- Autism Spectrum Disorder Detection with Machine Learning Methods. Curr. Psychiatry Res. Rev.. 2020;15:297-308.
- [CrossRef] [Google Scholar]
- Machine Learning Methods for Diagnosing Autism Spectrum Disorder and Attention- Deficit/Hyperactivity Disorder Using Functional and Structural MRI: A Survey. Front. Neuroinform.. 2021;14
- [CrossRef] [Google Scholar]
- An update on pharmacotherapy of autism spectrum disorder in children and adolescents. Int. Rev. Psychiatry. 2018;30:78-95.
- [CrossRef] [Google Scholar]
- Neurodevelopmental heterogeneity and computational approaches for understanding autism. Transl. Psychiatry. 2019;9:63.
- [CrossRef] [Google Scholar]
- The Prevalence of Parent-Reported Autism Spectrum Disorder Among US Children. Pediatrics. 2018;142
- [CrossRef] [Google Scholar]
- Relationship between Comorbid Psychopathology in Children and Adolescents with Autism Spectrum Disorder and Parental Well-being. Dev. Neurorehabil.. 2022;25:151-161.
- [CrossRef] [Google Scholar]
- Maenner MJ, Shaw KA, Baio J, et al. Prevalence of autism spectrum disorder among children aged 8 years—Autism and Developmental Disabilities Monitoring Network, 11 sites, United States, 2016. MMWR Surveill Summ 2020;69(No. SS–4):1–12. PMID:32214087 https://doi. org/10.15585/mmwr.ss6904a1.
- Comparison of 2 Case Definitions for Ascertaining the Prevalence of Autism Spectrum Disorder Among 8-Year-Old Children. Am. J. Epidemiol.. 2021;190:2198-2207.
- [CrossRef] [Google Scholar]
- Advanced Deep Learning Approaches for Accurate Brain Tumor Classification in Medical Imaging. Symmetry (basel).. 2023;15:571.
- [CrossRef] [Google Scholar]
- Relations among co-occurring psychopathology in youth with autism spectrum disorder, family resilience, and caregiver coping. Res. Autism Spectr. Disord.. 2021;85:101803
- [CrossRef] [Google Scholar]
- Psychopathology Trajectories of Children With Autism Spectrum Disorder: The Role of Family Poverty and Parenting. J. Am. Acad. Child Adolesc. Psychiatry. 2013;52:1057-1065.e1.
- [CrossRef] [Google Scholar]
- Automatic autism spectrum disorder detection using artificial intelligence methods with MRI neuroimaging: A review. Front. Mol. Neurosci.. 2022;15
- [CrossRef] [Google Scholar]
- Autism likelihood in infants born to mothers with asthma is associated with blood inflammatory gene biomarkers in pregnancy. Brain, Behav. Immun. - Heal.. 2024;40:100845
- [CrossRef] [Google Scholar]
- Early Diagnosis of Autism Spectrum Disorder: A Review and Analysis of the Risks and Benefits. Cureus 2023
- [CrossRef] [Google Scholar]
- A Review of Machine Learning Methods of Feature Selection and Classification for Autism Spectrum Disorder. Brain Sci.. 2020;10:949.
- [CrossRef] [Google Scholar]
- Analysis and Detection of Autism Spectrum Disorder Using Machine Learning Techniques. Procedia Comput. Sci.. 2020;167:994-1004.
- [CrossRef] [Google Scholar]
- An evaluation of machine learning approaches for early diagnosis of autism spectrum disorder. Healthc. Anal.. 2024;5:100293
- [CrossRef] [Google Scholar]
- A Review on Internet of Things (IoT)-Related Disabilities and Their Implications. J. Disabil. Res.. 2024;3
- [CrossRef] [Google Scholar]
- A Multi-Classifier-Based Recommender System for Early Autism Spectrum Disorder Detection using Machine Learning. Healthc. Anal.. 2023;4:100211
- [CrossRef] [Google Scholar]
- Mobile detection of autism through machine learning on home video: A development and prospective validation study. Plos Med.. 2018;15:e1002705.
- [Google Scholar]
- F. Thabtah, Autism Spectrum Disorder Screening, in: Proceedings of the 1st International Conference on Medical and Health Informatics 2017. ACM, New York, NY, USA, pp. 1–6. DOI: 10.1145/3107514.3107515.
- Zwaigenbaum, L., Penner, M., 2018. Autism spectrum disorder: advances in diagnosis and evaluation. BMJ k1674. DOI: 10.1136/bmj.k1674.
Appendix A
Supplementary data
Supplementary data to this article can be found online at https://doi.org/10.1016/j.jksus.2024.103468.
Appendix A
Supplementary data
The following are the Supplementary data to this article:


