

Enhanced production, purification and biochemical characterization of therapeutic potential fibrinolytic enzyme from a new Bacillus flexus from marine environment
⁎Corresponding author. dfarraj@ksu.edu.sa (Dunia A. Al Farraj)
-
Received: ,
Accepted: ,
This article was originally published by Elsevier and was migrated to Scientific Scholar after the change of Publisher.
Peer review under responsibility of King Saud University.
Abstract
Objectives
The main aim of this study is to isolate and characterize fibrinolytic enzyme from Bacillus flexus.
Methods
Fish meal of Sardinella longiceps and anchovy was optimized using a two-level full factorial design (25) and response surface methodology. The significant physical factors and nutrient sources (peptone, maltose, and magnesium chloride) were identified by statistical approach. The properties of a purified enzyme including their effect at different temperature, pH and the effect of metal ions were evaluated.
Results
Enzyme yield was improved 3.5 fold than unoptimized medium. Central composite design optimized culture medium enhanced enzyme yield (4711 ± 29.3 U/g of substrate). The fibrinolytic enzyme was highly active at alkaline pH (8.0), 50 °C and the molecular weight was 32 kDa.
Conclusions
From these findings, it concludes that this fibrinolytic enzyme could be a novel potent thrombolytic agent.
Keywords
Fibrinolytic enzyme
Bacillus
Cheap substrates
Blood clot
Fibrinolytic agent

1 Introduction
Cardiovascular diseases (CVDs) cause high mortality throughout the World. The thrombotic disease such as ischemic heart disease, high blood pressure, and acute myocardial infarction is of great concern nowadays and still thrombolytic therapy is primary way to treat these diseases (Marder, 2009). Microorganisms have been widely known as a vital source of thrombolytic agents. It is highly essential to look for novel and safer fibrinolytic agents from other microbial sources. To overcome various drawbacks, several fibrinolytic enzymes of different bacterial origin have been studied (Sharma et al., 2020). Enzymes from marine microorganisms have various applications than conventional biocatalysts due to its high potentials at large temperature and pH ranges with the potential to catalyze numerous catalytic functions. Fibrinolytic enzymes are produced by solid state fermentation (SSF) or submerged fermentation. SSF has various advantages over submerged fermentation like higher yield, less effluent formation, simpler fermentation apparatus, less need for stringent fermentation condition, provide culture conditions similar to natural habitat of microorganisms and high enzyme yield. Bacteria preferred SSF for the production of enzymes because this process condition is similar with natural environment. The ready availability of media components and substrate cost are the essential factors in industrial production (Vijayaraghavan and Prakash Vincent, 2015). Enzyme production is greatly affected by various nutrient sources and physico-chemical factors. Response surface methodology (RSM) is a combination of various statistical approaches by analyzing the components interactions aids in predicting optimum conditions of independent variables (Deepak et al., 2008). It analyzes the effect of factors, designs experiments and builds up models for foreseeing alterations in production. RSM and two factorial designs reduce the experimental runs for a multiple number of variables, based on which high yield in the production of enzyme can be done (Mukherjee et al., 2012). Based on the above mentioned facts and criteria, in this work the marine bacteria, Bacillus flexus from marine sediments with strong fibrinolytic activity, optimized their production in SSF with fish meal as SSF substrate using RSM.
2 Materials and methods
2.1 Screening of organism from the marine environment
The bacterial strain was screened from South West coast of India. Sample collection was done widely along the coasts of Kanyakumari in deep water, on beaches, under docks, in coves and sampling was on algal sediments. Screening for proteases were done in skimmed milk agar plates at pH, 7.0 with the addition of 3.5% (w/v) sodium chloride to maintain natural environment. PZ value was used to identify the potent proteolytic enzyme-producing bacterial isolate (Vijayaraghavan and Vincent, 2013) and isolates with low PZ value was considered for fibrinolytic enzymes screening. Fibrin substrate plate was formed by using bovine fibrinogen and thrombin. After incubating the fibrin plate at 37 °C, 10 µL sample was inoculated into well (6 mm) and incubated for 5 h. The diameter of the area of clearing zone was estimated, which indicated enzyme activity.
2.2 Production of fibrinolytic enzyme and assay
Submerged fermentation was performed in 100 mL Erlenmeyer flask. The culture flask was incubated for two days at 175 rpm in a rotary shaker incubator. After two days enzyme was extracted. Enzyme activity was measured based on the zone of clearance around the sample well and urokinase was used as the standard.
2.3 Identification of enzyme secreting bacterium
The potent bacterium was selected based on initial screening and enzyme assay. The selected candidate organism was identified based on morphological and biochemical experiments. Further characterization of the particular organism was done based on 16S rDNA gene sequence analysis using forward primer F: 5′-AGAGTTTGATCMTGG-3 and 1492 R: 5′-ACCTTGTTACGACTT-3 reverse primer and found to be Bacillus flexus.
2.4 Screening of factors using traditional method by solid state fermentation
Fish meal refers to waste of Sardinella longiceps and anchovy. These two were dried and mixed 50:50 ratios and used as the substrate. This substrate was used for optimization studies. 5.0 gm substrate was taken and the moisture content was maintained as 70% (pH 8.0) using Tris-HCl buffer. The medium was sterilized and cooled and B. flexus was inoculated at 10% level. Further, Erlenmeyer flask was incubated for 48 h at 37 °C. The factors such as carbon sources (1%) (starch, trehalose, glucose, maltose, sucrose and xylose), nitrogen sources (1%) (beef extract, casein, peptone, gelatine, yeast extract, and urea), and inorganic ions (0.1%) (manganese chloride, magnesium chloride, sodium nitrate, disodium hydrogen phosphate, ammonium sulphate, ammonium chloride, calcium chloride) were analyzed.
2.5 Screening of variables by statistical approach
Five factors (maltose, peptone, magnesium chloride, pH, and moisture) were selected. To maintain pH of the substrate, buffer solution (0.1 M) was used at required pH. Moisture level of the medium was adjusted using suitable buffer. The selected factors were analyzed at two different levels. A total of 32 experimental runs (Table 1) were performed and the corresponding responses were estimated. The statistical software (Design-Expert 8.0.7.0) has been used to design the experiments and analyze the data.
| Run | Maltose % | Peptone % | MgCl2 % | pH | Moisture % | Enzyme activity (U/g) |
|---|---|---|---|---|---|---|
| 1 | 1.00 | 1.00 | 0.01 | 10.0 | 60.0 | 2680 |
| 2 | 1.00 | 1.00 | 0.10 | 7.0 | 90.0 | 1197 |
| 3 | 0.10 | 1.00 | 0.10 | 7.0 | 60.0 | 2076 |
| 4 | 0.10 | 1.00 | 0.10 | 10.0 | 60.0 | 4401 |
| 5 | 1.00 | 0.10 | 0.01 | 7.0 | 90.0 | 1185 |
| 6 | 0.10 | 1.00 | 0.01 | 10.0 | 90.0 | 1152 |
| 7 | 0.10 | 0.10 | 0.01 | 7.0 | 60.0 | 2074 |
| 8 | 1.00 | 1.00 | 0.01 | 7.0 | 60.0 | 916 |
| 9 | 0.10 | 0.10 | 0.10 | 7.0 | 60.0 | 931 |
| 10 | 1.00 | 0.10 | 0.01 | 10.0 | 60.0 | 899 |
| 11 | 0.10 | 0.10 | 0.10 | 10.0 | 60.0 | 1164 |
| 12 | 1.00 | 1.00 | 0.10 | 7.0 | 60.0 | 1976 |
| 13 | 0.10 | 0.10 | 0.01 | 7.0 | 90.0 | 1398 |
| 14 | 0.10 | 0.10 | 0.10 | 10.0 | 90.0 | 1876 |
| 15 | 1.00 | 1.00 | 0.01 | 10.0 | 90.0 | 3001 |
| 16 | 0.10 | 1.00 | 0.10 | 7.0 | 90.0 | 928 |
| 17 | 0.10 | 0.10 | 0.10 | 7.0 | 90.0 | 3659 |
| 18 | 0.10 | 1.00 | 0.01 | 10.0 | 60.0 | 1153 |
| 19 | 0.10 | 1.00 | 0.01 | 7.0 | 90.0 | 897 |
| 20 | 1.00 | 0.10 | 0.01 | 10.0 | 90.0 | 1198 |
| 21 | 1.00 | 0.10 | 0.01 | 7.0 | 60.0 | 1156 |
| 22 | 1.00 | 0.10 | 0.10 | 10.0 | 90.0 | 1837 |
| 23 | 0.10 | 0.10 | 0.01 | 10.0 | 90.0 | 1829 |
| 24 | 0.10 | 0.10 | 0.01 | 10.0 | 60.0 | 1167 |
| 25 | 1.00 | 1.00 | 0.10 | 10.0 | 60.0 | 2698 |
| 26 | 1.00 | 0.10 | 0.10 | 7.0 | 60.0 | 2078 |
| 27 | 0.10 | 1.00 | 0.10 | 10.0 | 90.0 | 1157 |
| 28 | 1.00 | 1.00 | 0.10 | 10.0 | 90.0 | 4802 |
| 29 | 1.00 | 1.00 | 0.01 | 7.0 | 90.0 | 1402 |
| 30 | 0.10 | 1.00 | 0.01 | 7.0 | 60.0 | 1538 |
| 31 | 1.00 | 0.10 | 0.10 | 7.0 | 90.0 | 1109 |
| 32 | 1.00 | 0.10 | 0.10 | 10.0 | 60.0 | 939 |
| Source | Sum of squares | df | Mean square | F-value | p-value |
|---|---|---|---|---|---|
| Model | 3.153E+007 | 25 | 1.261E+006 | 113.69 | <0.001 |
| A-Maltose | 87466.53 | 1 | 87466.53 | 7.89 | 0.0308 |
| B-Peptone | 1.746E+006 | 1 | 1.746E+006 | 157.43 | <0.001 |
| C--MgCl2 | 2.635E+006 | 1 | 2.635E+006 | 237.60 | <0.0001 |
| D-pH | 1.727E+006 | 1 | 1.727+006 | 155.67 | <0.0001 |
| AB | 2.569E+006 | 1 | 2.569E+006 | 231.63 | <0.0001 |
| AD | 1.377E+006 | 1 | 1.377E+006 | 124.11 | <0.0001 |
| AE | 4.993E+005 | 1 | 4.993E+005 | 45.01 | 0.0005 |
| BC | 4.534E+005 | 1 | 4.534E+005 | 40.88 | 0.0007 |
| BD | 5.116E+006 | 1 | 5.116E+006 | 461.27 | <0.0001 |
| BE | 1.355+066 | 1 | 1.355+066 | 122.17 | <0.0001 |
| CD | 1.811E+005 | 1 | 1.811E+005 | 16.32 | 0.0068 |
| DE | 2.214E+005 | 1 | 2.214E+005 | 20.86 | 0.0038 |
| ABC | 71347.53 | 1 | 71347.53 | 6.43 | 0.0443 |
| ABD | 4.741E+005 | 1 | 4.741E+005 | 42.74 | 0.0006 |
| ABE | 3.388E+006 | 1 | 3.388E+006 | 300.95 | <0.0001 |
| ADE | 1.526E+006 | 1 | 1.526E+006 | 137.63 | <0.0001 |
| BCD | 7.469E+005 | 1 | 7.469E+005 | 67.35 | 0.0002 |
| BCE | 65250.78 | 1 | 65250.78 | 111.37 | <0.0001 |
| CDE | 65250.78 | 1 | 65250.78 | 5.88 | 0.0515 |
| ABCD | 2.157E+005 | 1 | 2.157E+005 | 19.44 | 0.0045 |
| ABCE | 2.061E+006 | 1 | 2.061E+006 | 185.82 | <0.0001 |
| ABDE | 57715.03 | 1 | 57715.03 | 5.20 | 0.0627 |
| ACDE | 3.601E+006 | 1 | 3.601E+006 | 324.69 | <0.0001 |
| BCDE | 1.338+005 | 1 | 1.338+005 | 12.06 | 0.0133 |
| ABCDE | 21684.03 | 1 | 21684.03 | 1.96 | 0.2115 |
| Residual | 66547.44 | 6 | 66547.44 | ||
| Cor Total | 3.159E+007 | 31 |
2.6 Response surface design and optimization
The independent variables such as, peptone, pH and MgCl2 were used to optimize fibrinolytic production. The level of factors (−1 and +1) with midpoint (0) and the complete experimental setup with their corresponding value is listed in Tables 3 and 4. Every experiment was conducted in three different experiments. Multiple regression analysis of the data was done and defined predicted response (Y) which is the second-order polynomial equation by virtue of independent variables (X1, X2, and X3) was found out:
| Run | pH | Peptone | MgCl2 | Enzyme activity |
|---|---|---|---|---|
| % | % | U/g | ||
| 1 | 7.0 | 1.0 | 0.1 | 1263 |
| 2 | 10.0 | 1.0 | 0.1 | 3022 |
| 3 | 6.0 | 0.6 | 0.6 | 1597 |
| 4 | 8.5 | 1.3 | 0.6 | 3904 |
| 5 | 8.5 | 0.6 | 0.6 | 4280 |
| 6 | 10.0 | 0.1 | 0.1 | 3993 |
| 7 | 8.5 | 0.6 | 0.6 | 4128 |
| 8 | 10.0 | 1.0 | 1.0 | 4086 |
| 9 | 8.5 | 0.6 | 0.6 | 4490 |
| 10 | 11.0 | 0.6 | 0.6 | 1802 |
| 11 | 8.5 | 0.6 | 0.2 | 3059 |
| 12 | 8.5 | 0.6 | 1.3 | 4029 |
| 13 | 8.5 | 0.2 | 0.6 | 2098 |
| 14 | 8.5 | 0.6 | 0.6 | 4187 |
| 15 | 7.0 | 1.0 | 1.0 | 4678 |
| 16 | 10.0 | 0.1 | 1.0 | 401 |
| 17 | 7.0 | 0.1 | 0.1 | 3278 |
| 18 | 7.0 | 0.1 | 1.0 | 1739 |
| 19 | 8.5 | 0.6 | 0.6 | 4036 |
| 20 | 8.5 | 0.6 | 0.6 | 4182 |
| Source | Sum of squares | df | Mean square | F-value | p-value |
|---|---|---|---|---|---|
| Model | 2.995E+007 | 9 | 3.327E+006 | 49.03 | <0.001 |
| A-pH | 57839.65 | 1 | 57839.65 | 0.85 | 0.3777 |
| B-Peptone | 3.263E+006 | 1 | 3.263E+006 | 48.08 | <0.0001 |
| C--MgCl2 | 70228.84 | 1 | 70228.84 | 1.03 | <0.0001 |
| AB | 4.005E+005 | 1 | 4.005E+006 | 5.90 | <0.0001 |
| AC | 2.424E+006 | 1 | 2.424E+006 | 35.72 | <0.0001 |
| BC | 1.154E+007 | 1 | 1.154E+007 | 170.09 | <0.0001 |
| A2 | 1.063E+007 | 1 | 1.063E+007 | 156.61 | <0.0001 |
| B2 | 2.290E+006 | 1 | 2.290E+006 | 33.75 | 0.0002 |
| C2 | 6.156E+005 | 1 | 6.156E+005 | 461.07 | 0.0131 |
| Residual | 6.787E+005 | 10 | 67868.21 | ||
| Lack of Fit | 5.574E+005 | 5 | 1.115E+005 | 4.59 | 0.0598 |
| Pure Error | 1.213E+005 | 5 | 24260.97 | ||
| Car Total | 3.062E+007 | 19 |
Y = α0 + α1A + α2B + α3C + α1α2AB + α1α3AC + α2α3BC + α1α1A2 + α2α20B2 + α3α3C2
where Y = fibrinolytic enzyme activity in U/g; A = coded value of pH; B = coded value of peptone; C = coded value of MgCl2.
The predicted experimental model was validated with experiments.
2.7 Total protein estimation
The culture supernatant was used as the sample source for the estimation of protein (Lowry et al., 1951).
2.8 Enzyme purification
Enzyme secreted by B. flexus was centrifuged and filtered using filter unit. The crude sample was precipitated with ammonium sulphate at three different saturations (20%, 40% and 60%). The precipitated enzyme was suspended in Millipore water and the precipitated enzyme was dialyzed. The overnight dialyzed enzyme was further dialyzed against buffer A (Tris-HCl buffer, 25 mM, pH 8.0) and lyophilized (Balaraman and Prabakaran, 2007). The lyophilized sample was fractionated using a sephadex G-100 chromatography column. About 25 fractions were collected and enzyme activity was determined. Fibrinolytic enzyme fractions were pooled and lyophilized. The freeze dried sample was mixed with buffer A and determined molecular weight using sodium dedecyl sulphate (SDS)-PAGE (Laemmli, 1970).
2.9 Characterization of enzyme
Optimal temperature of the fibrinolytic protease was found by analyzing the enzyme activity and stability at temperature ranges between 30 and 70 °C. Enzyme stability was performed for 1 h at pH 8.0. Impact of pH on enzyme activity was analyzed using buffers at ranges between 3.0 and 10.0 (Al-Dhabi et al., 2020). pH stability was determined by treating sample for 60 min at a definite temperature (50 °C) for 60 min and enzyme stability was calculated (Taneja et al., 2017). The impact of metal ions (5 mM) was tested using Ca2+, Cu2+, Co2+, Fe2+, Hg2+, Mn2+, Mg2+, Na+ and Zn2+. The influence of inhibiting properties of enzyme was studied by substituting 1–5 mM phenylmethylsulfonyl fluoride (PMSF) with fibrin plate and enzyme assay was performed as described earlier (Shinde et al., 2012).
3 Results and discussion
3.1 Screening and characterization of the Bacillus flexus for fibrinolytic enzyme production
In this study, 33 strains were screened from diverse sources in the marine habitats. PZ value was found to be much less for Bacillus flexus (0.18) which indicated good protease production. Further, the maximum protease producing 10 bacterial strains were used for screening fibrinolytic enzyme production using fibrin-agarose plates. The selected bacterial strain showed 23 mm zone around the well indicated hyper production. The isolate was Gram-positive, catalase-, Vogues-Proskauer’s test, methyl red, indole tests were negative and positive to oxidase experiment. It was unable to hydrolyze urea, nitrate was reduced and citrate was utilized. Based on 16S rDNA sequencing, the organism was characterized as B. flexus.
3.2 Optimization of fibrinolytic enzyme production by traditional method
. Bacterial proteolytic activity predominantly based on the composition of culture media for growth and various physical entities. However, the optimum conditions of the medium differ among organisms (Vijayaraghavan and Vincent, 2012). The selected strain could utilize maltose (1023 ± 15 U/g) improved enzymes production, closely followed by the one which is supplemented with starch (987 ± 14 U/g) with considerable decrease in fibrinolytic activity when supplemented with glucose. All nitrogen sources increased enzyme production with peptone (952 U/g) in the medium increases enzyme production the most followed by gelatin (949 U/g) and casein (938 U/g). The enzyme production was 1.2 fold higher when the medium was supplemented with MgCl2 (863 U/g) and also shows significant increase in enzyme production when supplemented with CaCl2 (860 U/g), and Na2HPO4.
3.3 Analysis of variables by statistical method
Five most significant variables (maltose (A), peptone (B), MgCl2 (C), pH (D), and Moisture (E)) were selected for enzyme production using statistical approach. The enzyme yield varied from 897 to 4802 U/g (Table 1). The important effects, each factors and their corresponding Fvalue, and Pvalue are given in Table 2. As per ANOVA results, all five variables namelyA, B, C, D, and E were effective on enzymes production. All three coefficients (quadratic, interactive and linear) namely AB, AD, AE, B C, BD, B E, DE, C D, AB C, ABD, AB E, AD E, B C E, B CD, A B C D, A B C E, AC D Eand BCDE were significant. The predicted R2 of this model design was 0.9401 and the adjusted R2 value was 0.9891. F-Value 113.69 shows the model is significant and the regression equation involving the coded variables is
Enzyme activity = +1764.78 + 52.28*A + 233.59*B + 286.97* C + 232.28*D + 283.34* AB + 207.41* AD + 124.91*AE +119.03BC + 399.84*BD-205.78*BE + 75.22*CD6*CDE + 85.03*DE-47.22* ABC + 121.72* ABD + 322.97*ABE + 218.41*ADE + 152.78*BCD-196.47*BCE-45.16*CDE-82.09*ABCD + 253.78*ABCE + 42.87*ABDE + 335.47*ACDE + 64.66 *BCDE + 26.03*ABCDE
3.4 Response surface methodology
In this study, the CCD model was statistically significant (p < 0.001). Maltose (A), peptone (B) and MgCl2 (C) variables were used for analysis. In experiment 15, maximum activity (4678 U/ml) was registered (Table 3). The F-value of this model was 49.03 and the calculated p value was <0.001 (Table 4). The R2 of this model was 0.9778 indicated the suitability of the model and the adjusted R2 value was close to the predicted correlation coefficient (0.8556). This model is fitted for the second-order polynomial equation.
Enzyme activity = +4212.37 + 65.08*A + 488*B + 7 1.71*C + 223.75*AB-550.50*AC + 1201.25*BC-858.80*A2-398.65B2-206.68*C2
The generated 3D graphs (Fig. 1A–C) represent the interaction among the medium components and the determined components optimum for maximum enzyme yield. The perturbation plot revealed the impact of all factors simply (Fig. 1D). The increasing concentration of MgCl2 and peptone positively regulated enzymes production. The optimized value of three most important factors was 0.4% MgCl2, 0.92% peptone, at pH 8.2% with predicted estimate of 4692 U/g fibrinolytic activity. The predicted results were confirmed by performing experiments in triplicates under optimized conditions and enzyme activity achieved was 4711 U/g. CCD and RSM have been used frequently to optimize enzymes production and there are few other reports of increasing fibrinolytic enzyme production using RSM (Mukherjee et al., 2012). Enzyme yield was improved 3.5 fold than unoptimized medium and this yield was comparatively high than various previous reports (Deepak et al., 2008; Vijayaraghavan and Vincent, 2014). Comparison with all these strains of Bacillus the present isolate marine B. flexus also had shown increased enzymes production.
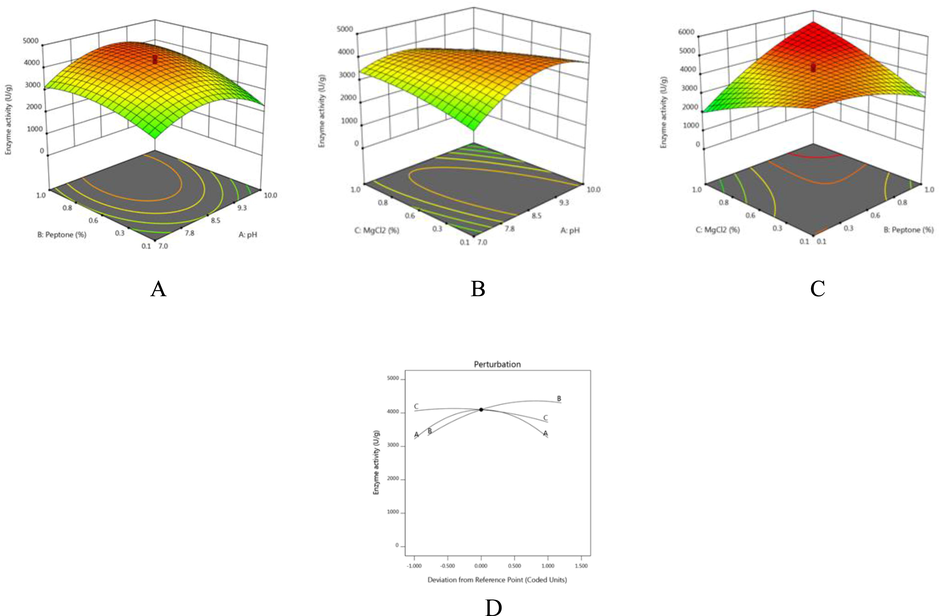
- (A–D). Response surface plots showing interaction between process variables for enhanced production of fibrinolytic enzymes from B. flexus (A) pH and peptone (B) pH MgCl2 (C) peptone and MgCl2 (D) perturbation plot.
3.5 Properties of fibrinolytic enzyme
Enzyme was purified by and molecular weight of enzyme was analyzed using SDS-PAGE (Fig. 2) and determined as 32 kDa. The final purification was 10.8-fold with the estimated recovery of 10%. The molecular weight of fibrinolytic enzyme was comparatively higher than fibrinolytic enzymes from other sources (Simkhada et al., 2010. Also, the molecular weight of the enzyme is significantly high but comparatively lower than plasminogenic activator. The specific activity of fibrinolytic enzyme was 315.2 U/mg protein (Table 5).

- Molecular weight determination using 12% SDS-PAGE (Lane 1 – purified sample, Lane 2 – ammonium sulphate precipitated sample; lane – 3 crude sample).
| Purification steps | Total activity (U) | Total protein (mg) | Specific activity (U/mg) | Purification (fold) | Yield (%) |
|---|---|---|---|---|---|
| Crude enzyme | 12,800 | 212 | 60.6 | 1 | 100 |
| Ammonium sulphate | |||||
| precipitation | 9750 | 145.3 | 67.1 | 1.1 | 76.2 |
| Sephadex G-75 | 1387 | 4.4 | 315.2 | 5.2 | 10.8 |
3.6 Characterization of enzyme
The enzyme activity and stability was both at its highest at pH 8 and was generally active at pH range of 7 to 9 (Fig. 3A). Enzyme was highly active at 50° C but enzyme stability drastically decreases at 70 °C (Fig. 3B). Fibrinolytic enzyme under study was found to be active at pH 8.0 and 60 °C. This optimum temperature obtained in this study was high than some previous reports (Liu et al., 2005). In the case of Bacillus subtilis C10, fibrinolytic enzyme was active between 31 and 43 °C (Thu et al., 2020). Also preservation under normal condition is possible with its high optimal temperature and temperature stability. Recently, Yao et al. (2019) isolated a fibrinolytic enzyme producing Bacillus velezensis BS2 from sea squirt jeotgal. The fibrinolytic enzyme isolated from this organism showed high activity at 37 °C. Inhibition and activation studies on enzyme can give finer details about the origin of enzymes (Mukherjee and Rai, 2011). In a study, Sharma et al. (2020) characterized a thiol-dependent fibrinolytic enzyme from Bacillus cereus RSA1 for therapeutic applications. Mg2+ is one of the significant ions enhanced fibrinolytic enzyme activity which was also enhanced enzymes production. Zn2+, Fe2+ and Hg2+ inhibited the enzyme activity drastically (Fig. 3C). Enzyme activity of the enzyme was higher with Mg2+ and Mn2+ ions and was mildly enhanced by Ca2+ was like Brevibacillum sp. serine metallo proteases (Maeda et al., 2011), and these indicates that these ions may exist in the enzyme.
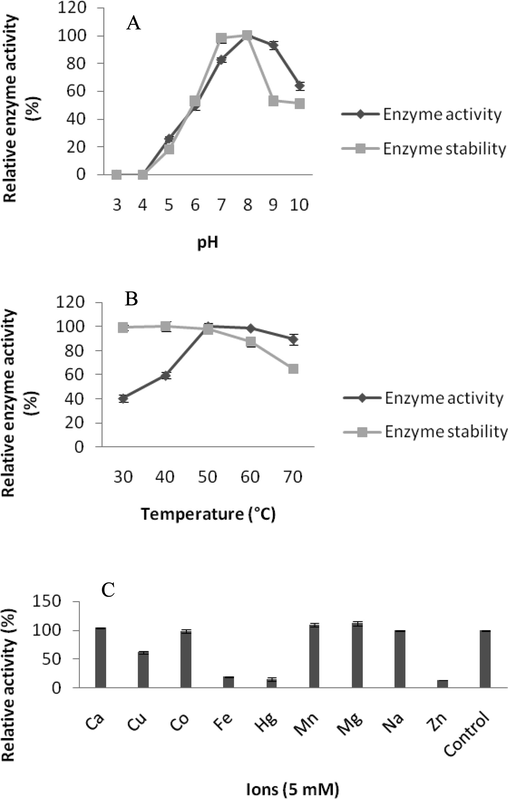
- (A–C). Effect of pH on enzyme activity and stability (A), Effect of temperature on enzyme activity and stability (B), Effect of ions on enzyme activity (C).
4 Conclusion
Fibrinolytic enzyme production in hyper-producing novel strain B. flexus has been utilized. The utilization of inexpensive meal and statistical design of culture conditions in screening and optimization allowed identification of significant factors instantly and their interactions for fibrinolytic enzyme. The present finding has illustrated the application of central composite design by predicting conditions enabling maximum enzyme yield. The present study indicated that this fibrinolytic enzyme from this bacterium can be used efficiently as a fibrinolytic agent.
Acknowledgement
The authors would like to thank the Deanship of Scientific Research at King Saud University for funding this work through research group no. RG1439-044.
Declaration of Competing Interest
The authors declare that they have no known competing financial interests or personal relationships that could have appeared to influence the work reported in this paper.
References
- Characterization and fermentation optimization of novel thermo stable alkaline protease from Streptomyces sp. Al-Dhabi-82 from the Saudi Arabian environment for eco-friendly and industrial applications. J. King Saud Univ. Sci.. 2020;32(1):1258-1264.
- [Google Scholar]
- Balaraman, K., Prabakaran, G., 2007. Production and purification of a fibrinolytic enzyme (thrombinase) from Bacillus sphaericus. Indian J. Med. Res. 126, 459–464.
- Optimization of media composition for Nattokinase production by Bacillus subtilis using response surface methodology. Bioresour. Technol.. 2008;99:8170-8174.
- [Google Scholar]
- Cleavage of structural proteins during the assembly of the head of bacteriophage T4. Nature. 1970;227:680-685.
- [Google Scholar]
- Purifcation and characterization of a novel fbrinolytic enzyme from Rhizopus chinensis 12. Appl. Microbiol. Biotechnol.. 2005;67:209-214.
- [Google Scholar]
- Protein measurement with the Folin phenol reagent. J. Biol. Chem.. 1951;193:265-275.
- [Google Scholar]
- Purification and characterization of a serine protease secreted by Brevibacillus sp. KH3 for reducing waste activated sludge and biofilm formation. Bioresour. Technol.. 2011;102(22):10650-10656.
- [Google Scholar]
- Thrombolytic therapy for deep vein thrombosis: potential application of plasmin. Thromb. Res.. 2009;123:56-61.
- [Google Scholar]
- A statistical approach for the enhanced production of alkaline protease showing fibrinolytic activity from a newly isolated Gramnegative Bacillus sp. strain AS-S20-1. New Biotechnol.. 2011;28:182-189.
- [Google Scholar]
- Bafibrinase: a non-toxic, non-hemorrhagic, direct-acting fibrinolytic serine protease from Bacillus sp. strain AS-S20-I exhibits in vivo anticoagulantactivity and thrombolytic potency. Biochimie. 2012;94(6):1300-1308.
- [Google Scholar]
- Thrombolytic potential of novel thiol-dependent fibrinolytic protease from Bacillus cereus RSA1. Biomolecules. 2020;10(1):3.
- [Google Scholar]
- Bacillus subtillis RTSBA6 6.00, a new strain isolated from gut of Helicoverpa armigera (Lepidoptera: Noctuidae) produces chymotrypsin-like proteases. Saudi J. Biol. Sci.. 2012;19(3):317-323.
- [Google Scholar]
- A novel fibrinolytic protease from Streptomyces sp. CS684. Process Biochem.. 2010;45(1):88-93.
- [Google Scholar]
- Production, purification and characterization of fibrinolytic enzyme from Serratia sp. KG-2-1 using optimized media. 3 Biotech.. 2017;7(184)
- [Google Scholar]
- Characterizations and fibrinolytic activity of serine protease from Bacillus subtilis C10. Curr. Pharmaceut. Biotechnol.. 2020;21(2):110-116.
- [Google Scholar]
- A low cost fermentation medium for potential fibrinolytic enzyme production by a newly isolated marine bacterium, Shewanella sp. IND20. Biotech. Rep.. 2015;7:135-142.
- [Google Scholar]
- A simple method for the detection of protease activity on agar plates using bromocresolgreen dye. J. Biochem. Technol.. 2013;3:628-630.
- [Google Scholar]
- Statistical optimization of fibrinolytic enzyme production using agro residues by Bacillus cereus IND1 and its thrombolytic activity in vitro. Biomed. Res Int.. 2014;2014:725064
- [Google Scholar]
- Cow dung as a novel, inexpensive substrate for the production of a halo-tolerant alkaline protease by Halomonas sp. PV1 for eco-friendly applications. Biochem. Eng. J.. 2012;69:57-60.
- [Google Scholar]
- Characterization of a fibrinolytic enzyme secreted by Bacillus velezensis BS2 isolated from sea squirt jeotgal. J. Microbiol. Biotechnol.. 2019;29(3):347-356.
- [Google Scholar]


