

Translate this page into:
Engineering bedrock depth estimation and ground response analysis of the northern Jeddah urban area, western Saudi Arabia
-
Received: ,
Accepted: ,
This article was originally published by Elsevier and was migrated to Scientific Scholar after the change of Publisher.
Peer review under responsibility of King Saud University.
Abstract
Abstract
The engineering bedrock depth was determined in the northern Jeddah urban area via multichannel analysis of surface waves (MASW) conducted at 76 locations. Depths corresponding to the velocity ranges were estimated below the ground surface and mapped. The engineering bedrock depth was evaluated and it varies from 0 to approximately 36.23 m whereas the depth increased eastward. Further, ground response analysis was conducted to assess the seismic hazard in terms of peak ground acceleration, where it ranges from 3.37 to 17.71 cm/s2, considering the fundamental resonance frequency and amplification potential at the sites of measurement. These variations are due to differences in the soil profile at each location; ground surface acceleration increased at sites with thick layers of soft sediments. In addition, the spectral acceleration and response spectra were assessed at the ground surface with a 5% damping ratio for the identified lithological units. Peak spectral acceleration varies from 16.8 to 62.6 cm/s2. The eastern zone has a higher spectral acceleration than the western zone while the frequency corresponding to the spectral acceleration varies from 1.05 to 14.28 Hz. The spectral acceleration and response spectra are used for assessment the spectrum of structures. Ground response analysis shows that because of the soil condition, potential amplification of wave amplitudes is observed at the ground surface when compared to the engineering bedrock level acceleration. These results should be provided to civil engineers, land-used planners, and decision makers during the designing of either new buildings or rehabilitation of pre-existing structures.
Keywords
Bedrock
Ground response
Spectral acceleration
Jeddah
Saudi Arabia

1 Introduction
The evaluation of the spatial changeability of the engineering bedrock depth in urban expansion zones using multichannel analysis of surface waves (MASW) survey is important for various applications to allocate the input parameters for response spectra. Through geotechnical investigations, the bedrock identification has great importance to adopt the kind of foundation for appropriate structure. Both of peak ground acceleration (PGA) and spectra at a particular site are evaluated for bedrock and ground surface levels including local site response effects. The main objective of our work is the engineering bedrock depth estimation for northern Jeddah area based on shear-wave velocity, Vs, measured through MASW survey. MASW becomes a widespread seismic method applied for geotechnical classification of shallow sediments (Miller et al., 1999; Park et al., 1999; Xia et al., 1999; Park and Miller, 2005; Kanli et al., 2006; Kanlı, 2010; Rehman et al., 2016). Furthermore, MASW is more efficient for determining shallow subsurface properties (Park et al., 2001; Zhang et al., 2004). Aldahri et al. (2017) conducted site soil classification for surface soil in Ubhur area according to the national earthquake hazards reduction program (NHREP) recommendations where, the greatest part of the study area falls in site class C while class B and D covered limited areas in the western and the eastern parts respectively.
The results of MASW include vertical and cross-section of vs profiles. MASW was applied through the study area for 76 sites for shear wave velocity assessment. The estimated values were analyzed and then the engineering bedrock surface depth was classified. The engineering bedrock can be defined as the layer having shear-wave velocity about 700 m/s (Miller et al., 1999; Santamarina et al., 2001; Ryden, 2004; Nath, 2007). While Ansal and Tonuk (2007) indicate that the bedrock layers have Vs varying from 700 to 750 m/s. moreover the program NEHRP (2009) and (Akin et al., 2013), illustrated the value of 760 m/s corresponds to the bedrock.
Depending on the majority of studies, the depth equivalent to Vs of 760 m/s is taken as the engineering bedrock depth in this study. Then, the identified bedrock depths have been mapped illustrating the engineering bedrock depth surface in the northern Jeddah urban area.
2 Study area and local geology
The studied area lies sideways the Red Sea coast to the north of Jeddah city, west Saudi Arabia (Fig. 1). The study area is the northern expansion part of Jeddah area, which has been subject to moderate earthquakes (Fnais et al., 2010). Some of these earthquakes have been felt through the Jeddah region. The maximum moment magnitude (Mw) was 7.2 in 1967 occurred through the Red Sea axial trough and affected the study area (Ambraseys et al., 1994). Unfortunately, the surface soil of the study area ranges from very soft to massive/stiff sediments or rocks. Some of sediments have poor geotechnical properties (e.g., the sabkhah deposits) and consequently cause the damages of buildings and structures in the case of strong earthquakes.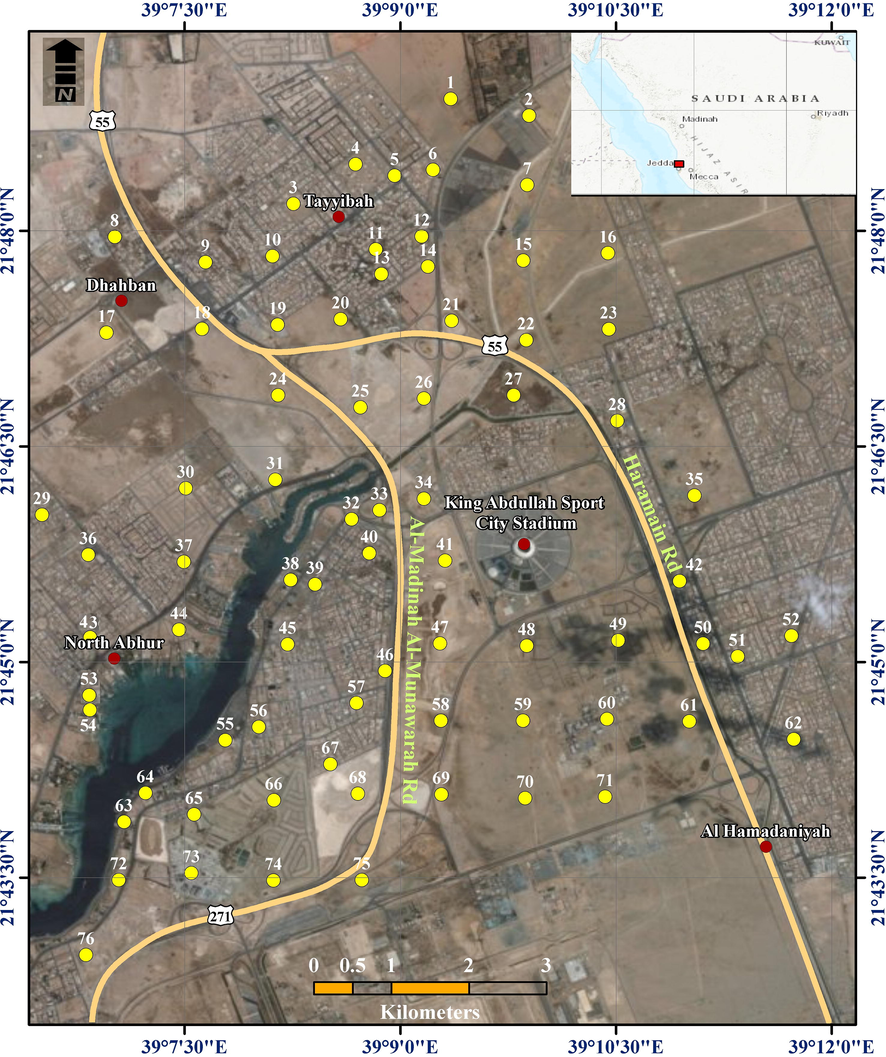
Location map of the study area (Yellow circles are the locations of MASW sites).
The surface geology of northern Jeddah was evaluated by Moore and Al-Rehaili (1989) and differentiated as follows (Fig. 2): Ubhur Formation of early Miocene which consists of green siltstone, and limestone. These Tertiary units have been tilted and overlain northward by alkaline basalt of the Miocene to Pliocene Rahat Group. The Quaternary deposits have been divided into seven lithological units. The oldest is a raised reef limestone that outcrops in the western part followed by undifferentiated alluvial, eolian, and sabkha deposits, which are the youngest. These alluvial fan deposits are divided into two types: terraced and non-terraced deposits. The terraced deposits are composed of poorly sorted, coarse-grained gravels and beds containing a high proportion of cobbles and boulders. The other type is composed of gravel and sand. The reef limestone is widespread westward and raised 3–6 m above sea level and not exposed because it is covered sabkha. Moreover, there are small sabkha deposits detached westward.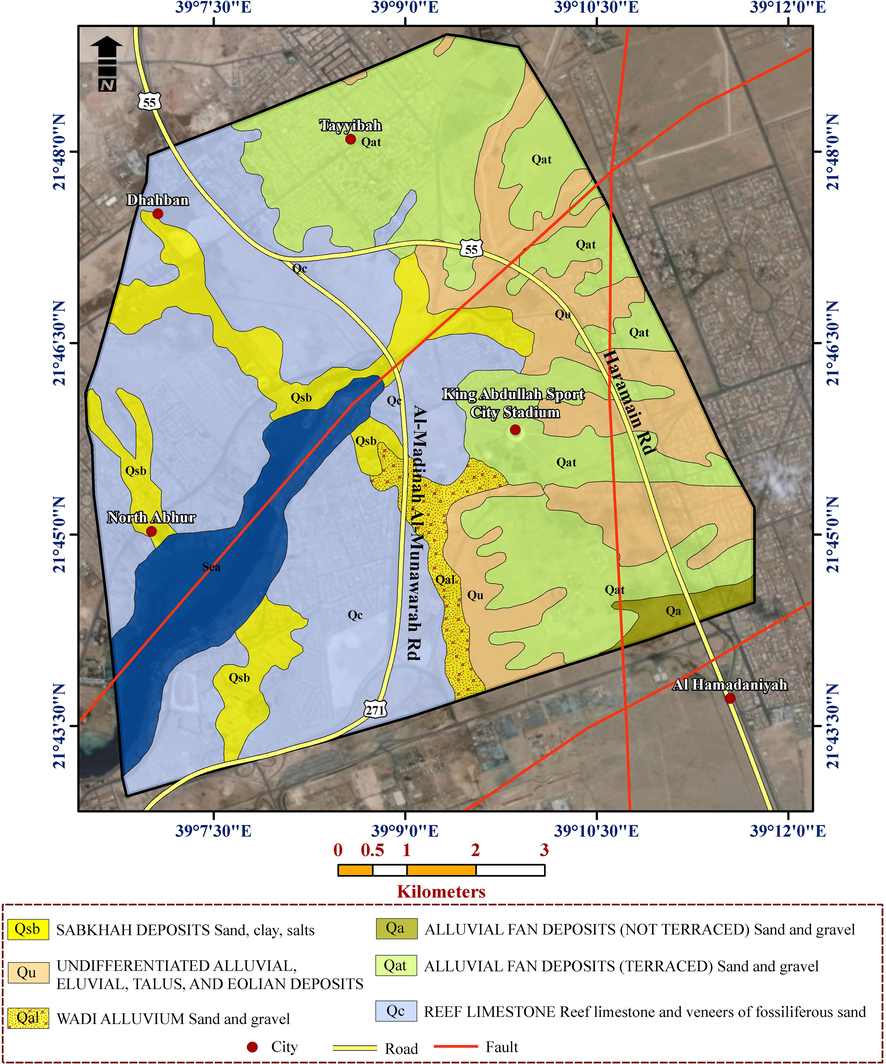
Geological map for the study area.
3 Data acquisition and processing
3.1 Engineering bedrock depth estimation
MASW field data in this study were acquired using Geode seismograph equipped by 24 vertical geophones with 4.5-Hz. Seismic waves were produced by an impulsive source of weight drop. The recorded waves were analyzed using the SurfSeis software to produce a 1-D or 2-D Vs data through three processing steps as follows: i) field-data preparation, ii) dispersion-curve construction, and finally, iii) inversion process. The selected sites for MASW are distributed throughout the study area and cover the identified geologic units. Seventy-six of 1-D MASW surveying profiles were conducted in the investigated area. Field data were collected with 1-m geophone spacing. The energy source was sustained at a distance of 10 m. This source distance is recommended for recording high quality signals within very soft, soft, and hard soils. Then, shear-wave velocity model was assessed through the inversion process based on least-squares fitting algorithm (Xia et al., 1999).
The engineering bedrock depth were estimated for each site of one dimensional velocity profiles of the MASW measurements and the corresponding Vs values (Figs. 3 and 4). Then, shear wave velocity represents the key for calculating seismic hazard at a certain site where the average shear wave velocity for the depth “d” of soil is referred as VH as follows; the average shear wave velocity up to a depth of H (VH) is computed according to Kanli et al. (2006) as;where H = = Cumulative depth in meters.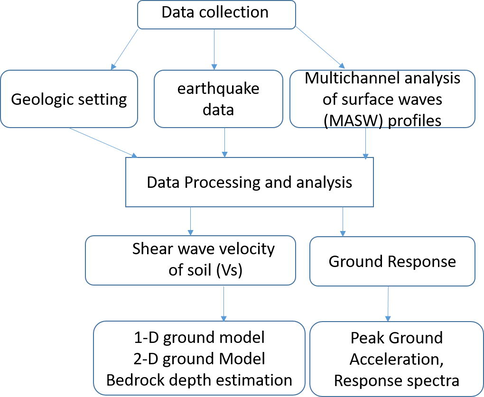
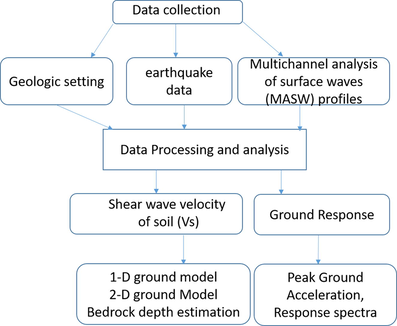
Flowchart showing the methodologies applied in this study.
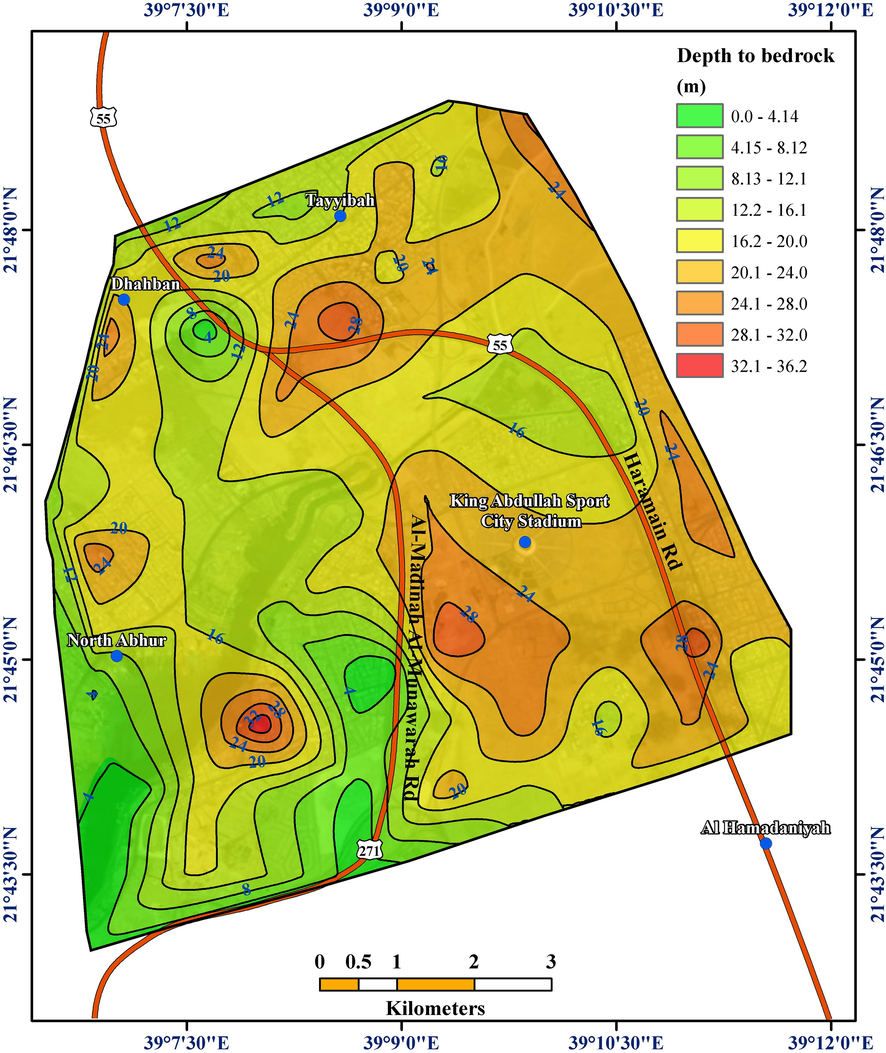
Depth to the engineering bedrock in the study area.
For 30 m average depth, shear wave velocity is written as (Boore, 2004):where di and vi denote the thickness (in meters) and shear-wave velocity in m/s of the ith layer, respectively.
The estimated engineering bedrock depth is shown in Fig. 4. Notably, the corresponding velocity of the overlying soil spans from 200 to 752.05 m/s down to the engineering bedrock level. The average Vs values ranges from 200 to 400 m/s, which can be categorized as medium to dense soil. Whereas the engineering bedrock depth varies between 0 and 36.2 m.
3.2 Ground response assessment
Ground response analyses were applied to calculate surface ground motions by assessing the potential amplification that is used to construct the design response spectrum. In this study due to the lack of acceleration records of any earthquake, it was essential to use the synthetic seismogram. The synthetic ground motion was developed using Boore’s SMSIM program (Boore, 1983; 2003) at the 76 MASW sites and then, applied for ground response analysis.
The Fourier amplitude spectrum of the ground motion at a site is written as follows:where M0 is the seismic moment and can be estimated using the following equation (Hanks and Kanamori, 1979);
The source spectra for all of the models can be given by;where C is a constant, given below, and S (M0, f) is the displacement source spectrum, given by the equation , andwhere, Rθϕ represents the radiation pattern for a range of azimuths θ and takeoff angles ϕ. F accounts for the free surface effect. H is the reduction factor that accounts for the partitioning of energy into two horizontal components and r is the hypocentral distance, σ and β are crustal density and shear wave velocity. Input parameters for the stochastic model are shown in Table 1 according to Sokolov and Zahran (2018).
Factor
Parameter
Representative value
Source
Slip distribution
Random slip
Stress drop Δσ
15 bars (1.5 Mpa)-90 bars (9 Mpa)
Shear-wave velocity β
3.0 km/s
Density ρ
2.8 g/cm3
Rupture propagation velocity
0.8 β
Path
Geometric spreading
Trilinear, R−1 for R < 40 km; R0 for 40 ≤ R < 70 km; R−0.5 for R ≥ 70 km
Quality factor
Q(ƒ) = 250 ƒ0.6
Duration
1/ƒc + 0.05 RHypo
Site
kappa-effect
0.02 and 0.04s
The source spectrum was calculated as follows (Brune, 1970);where Mo is the seismic moment and fc is corner frequency, respectively.
The value of fc is acquired bywhere, fc, β, Δσ (stress drop), and Mo are in Hertz, km/s, bars and dyne-cm, respectively.
The path spectrum can be calculated depending on both of the geometrical spreading and quality factor Q(f) as given below,
While, site spectrum can be interpreted as function of frequency dependent amplification A (f) and diminution D (f) factors as,
The amplification of waves as they travel upward to the surface through a rock column is given byρ (z)avg and βavg(z) are averages of near-surface density and velocity from the surface to the depth of a quarter wavelength (Boore and Joyner, 1997).
The diminution factor D (f) is given by the following equationwhere, k0, is the distance-independent high frequency attenuation operator (Kappa factor).
Type (f) is a filter used to shape the spectrum corresponding to the particular ground motion and is given bywhere, s = 0 for acceleration, 1 for velocity, and 2 for displacement
The distinctive synthetic ground motion at the bedrock throughout peak ground acceleration (PGA) is the most commonly used for ground response measurement at a particular site.
In this study, the peak acceleration at the ground surface for each location was assessed depending on the estimated resonance frequency (f0) and amplification factor (A0) at each site of MASW measurements (Aldahri et al., 2018). The results of the ground response analysis were mapped using the ArcGIS 9.2 package. The PGA at the ground surface for all MASW sites was estimated. Table 2 shows the variation in the PGA value from 3.37 to 17.71 cm/s2. These variations in the ground surface PGA values are based on the variations in the soil profile at each location, where the ground surface acceleration increases at sites with thick soft sediment layers. The ground surface acceleration is considerably higher in areas of alluvial deposits as a result of the thick silty sand layers. Depending on the PGA values at the bedrock and ground surface, it is clear that the PGA at the bedrock surface is influenced by the distance, while local site response effects influence the PGA at the ground surface.
Site No.
Lat.
Long.
F0
A0
PGA (bedrock)
PGA (surface)
PGA (1.5 Hz)
PGA (3 Hz)
PGA (5 Hz)
PGA (8 Hz)
PGA (10 Hz)
Max. PSA
Max. Hz
1
21.81528
39.15585
2
2.06
6.44
8.26
16.46
11.48
12.47
15.38
16.22
17.43
14.286
2
21.81333
39.16494
5.402
4.4
6.44
17.77
35.71
42.18
39.09
23.95
24.12
45.18
4.167
3
21.8031
39.13762
1.361
1.59
5.13
7.146
11.19
10.78
11.89
15.02
16.08
16.82
13.333
4
21.80768
39.14483
1.361
2.15
4.8
8.018
14.41
11.19
12.51
15.75
16.66
17.38
13.333
5
21.80637
39.14935
1.522
2.35
4.8
8.487
17.28
11.63
12.9
16.07
16.96
17.63
13.333
6
21.80705
39.15381
1.848
1.81
4.58
7.624
14.33
10.83
12.23
15.41
16.41
17.07
13.333
7
21.8053
39.16472
4.138
3.31
4.71
13.02
26.74
31.39
19.44
19.58
20.3
32.77
3.571
8
21.79929
39.1169
1.202
2.87
6.75
9.354
16.45
12.72
13.31
16.69
17.56
19.98
1.176
9
21.79635
39.12744
1.991
2.08
6.75
8.377
16.68
12.01
12.63
16.1
16.85
17.63
13.333
10
21.79704
39.1352
1.43
1.69
6.71
7.402
12.4
11.13
11.87
15.49
16.3
17.11
13.333
11
21.79783
39.14718
1.38
1.37
5.3
6.893
10.29
10.63
11.5
15.16
15.97
16.83
13.333
12
21.79933
39.15248
1.64
2.2
5.13
8.406
16.92
11.96
12.85
15.86
16.84
17.54
12.5
13
21.79497
39.14782
1.31
1.34
6.52
6.829
9.919
10.58
11.43
15.07
15.98
16.8
13.333
14
21.79584
39.15322
1.472
2.65
5.29
9.217
18.64
12.74
13.39
16.4
17.38
19.46
1.25
15
21.79652
39.16427
2.07
2.58
5.13
9.511
20.4
13.07
13.72
16.65
17.53
20.76
1.667
16
21.79738
39.17408
5.746
5.93
4.97
23.93
47.14
57.38
63.51
31.38
30.7
63.61
5
17
21.78816
39.11595
1.306
3.68
5.48
11.17
21.84
13.95
14.93
17.55
18.74
26.72
1.176
18
21.7886
39.12703
1.991
2.06
6.28
8.258
16.74
11.63
12.78
15.81
16.95
17.84
13.333
19
21.78908
39.13578
1.491
1.65
6.28
7.263
12.71
10.59
11.99
15.22
16.34
17.3
13.333
20
21.78972
39.1431
4.03
1.486
6.96
7.543
12.21
14.5
12.6
15.61
16.39
17.26
13.333
21
21.78954
39.15597
1.448
2.69
6.75
9.253
18.8
12.7
13.28
16.65
17.49
19.45
1.333
22
21.7873
39.16461
2.01
3.01
6.67
10.47
24.2
13.98
14.28
17.51
18.27
24.44
1.667
23
21.78857
39.17419
3.47
3.25
6.52
12.64
26.24
31.26
17.3
19.15
20.25
31.38
2.941
24
21.78092
39.13583
1.17
2.55
4.78
8.834
15.07
11.85
13.07
16.03
17.14
18.34
1.176
25
21.77952
39.14538
1.387
1.75
4.98
7.478
12.76
10.75
12.09
15.26
16.36
17.44
13.333
26
21.78053
39.15276
5.08
3.378
5.65
14.08
27.86
33.25
31.91
20.75
21.46
34.78
4.545
27
21.78091
39.16315
1.7
2.4
6.42
8.864
19.13
12.09
13.2
16.14
17.31
19.13
1.5
28
21.77794
39.17516
1.87
2.73
6.42
9.965
22
12.93
13.87
16.68
17.85
22
1.5
29
21.76705
39.10847
1.19
2.58
5.48
9.096
14.88
12.11
13.52
16.69
17.52
18.61
14.286
30
21.77012
39.12514
1.435
3.41
5.85
10.87
22.86
13.97
14.88
17.67
18.57
25.12
1.25
31
21.77113
39.13552
1.296
5.95
5.87
15.97
31.66
18.51
19.44
21.78
22.41
43.32
1.176
32
21.76653
39.14437
1.183
2.26
5.88
8.358
13.8
11.62
12.98
15.91
16.98
18.04
13.333
33
21.7676
39.1476
1.157
2.12
5.87
8.15
13.15
11.34
12.81
15.72
16.77
18
12.5
34
21.76892
39.15275
1.379
1.99
5.83
8.107
14.15
11.17
12.69
15.64
16.68
17.95
12.5
35
21.7693
39.18411
1.256
2.86
4.78
9.511
17.29
12.46
13.61
16.46
17.58
21.04
1.176
36
21.76242
39.11384
1.107
3.66
6.1
11.01
18.01
13.6
15.18
18.28
18.8
24.99
1.053
37
21.76162
39.12493
1.46
3.52
5.96
11.33
23.72
14.13
15.5
18.47
19.1
26.2
1.333
38
21.75951
39.13731
1.461
3.01
5.84
10.25
20.62
13.17
14.56
17.58
18.31
22.47
1.333
39
21.75899
39.14012
1.41
3.22
2.74
10.63
20.92
13.49
14.87
17.87
18.57
23.77
1.333
40
21.76261
39.14641
1.324
2.119
5.54
8.155
13.97
11.49
12.79
15.84
16.96
17.94
13.333
41
21.76174
39.15519
1.513
2.374
5.54
8.784
17.38
12.1
13.25
16.23
16.44
18.32
13.333
42
21.75936
39.18238
1.069
2.825
5.87
9.269
15.15
12.29
13.68
16.48
17.44
18.96
1.053
43
21.75284
39.11405
0.992
4.25
6.27
11.87
18.85
14.64
15.75
18.43
19.57
27.38
1
44
21.75374
39.12434
1.203
2.381
6.32
8.806
14.21
11.83
13.36
16.41
17.4
18.45
13.333
45
21.75204
39.13694
1.76
2.16
6.23
8.759
16.84
11.89
13.34
16.41
17.34
18.37
13.333
46
21.74895
39.14825
1.409
2.347
6.23
8.904
16
11.92
13.44
16.53
17.4
18.48
13.333
47
21.75215
39.15461
1.35
2.04
6.11
8.221
13.7
11.32
13.01
16.28
16.96
18.03
14.286
48
21.75187
39.16466
1.209
2.259
5.96
8.522
13.68
11.59
13.19
16.38
17.18
18.26
14.286
49
21.75249
39.17526
1.256
5.09
5.42
14.08
26.1
16.77
17.66
20.59
21.16
35.69
1.176
50
21.75211
39.18511
1.067
2.49
5.45
8.653
13.54
11.83
13.06
16.29
17.23
18.21
14.286
51
21.75062
39.18912
1.506
3.06
5.45
10.28
21.65
13.36
14.34
17.35
18.24
22.65
1.429
52
21.75304
39.19536
1.94
3.06
5.85
10.74
24.55
14.15
14.76
17.5
18.48
24.79
1.667
53
21.74611
39.1141
1.102
2.06
4.95
8.119
12.66
11.36
12.75
15.77
17.07
18.34
13.333
54
21.74442
39.11402
1.028
3.36
4.97
10.42
16.74
13.25
14.46
17.37
18.41
22.12
1.053
55
21.74092
39.12971
1.166
3.71
4.97
11.25
19.02
14.05
15.16
17.98
19.01
25.72
1.111
56
21.74247
39.1336
1.256
4.79
5.16
11.37
19.75
14.18
15.25
18.06
19.1
26.34
1.111
57
21.74523
39.14492
1.487
2.88
6.27
13.77
25.83
16.56
17.37
19.89
20.92
35.05
1.176
58
21.74319
39.15473
1.333
2.332
6.27
10.01
20.6
13.18
14.28
17.05
18.32
22
1.25
59
21.74319
39.16424
11.05
1.546
6.44
8.705
15.37
12.05
13.3
16.16
17.51
18.54
13.333
60
21.74339
39.17398
0.763
1.7
5.4
3.379
9.927
10.58
12.32
15.59
16.51
17.69
13.333
61
21.74311
39.18352
1.28
4.149
5.98
12.39
22.8
14.83
16.31
19.3
19.74
29.37
1.176
62
21.74102
39.19562
2.09
2.325
6.09
9.237
18.45
12.51
13.81
16.99
17.56
19.17
1.818
63
21.73147
39.11798
1.167
2.59
6.75
9.248
15.31
12.21
13.43
16.2
17.68
18.93
14.286
64
21.73481
39.12047
1.24
2.828
7.07
9.78
17.01
12.59
13.81
16.66
17.85
20.3
1.176
65
21.73232
39.1261
1.342
2.2
6.96
8.641
15.07
11.73
12.99
15.86
17.17
18.63
14.286
66
21.73398
39.13536
1.28
2.615
6.97
9.408
16.41
12.25
13.48
16.42
17.72
19.18
1.25
67
21.73816
39.14192
1.504
3.46
4.96
11.36
24.97
14.43
15.25
18
19.18
26.78
1.333
68
21.73472
39.14508
1.52
4.413
5.22
13.59
31.91
16.47
17.2
19.69
20.73
34.14
1.333
69
21.73463
39.15477
1.297
2.74
4.97
9.605
17.29
12.64
13.82
16.77
17.96
20.61
1.25
70
21.7342
39.16447
1.461
1.59
4.96
7.424
12.13
10.81
12.27
15.36
16.69
17.86
13.333
71
21.73437
39.17376
3.65
1.611
5.52
8.029
13.29
15.56
13.18
15.68
17.21
18.21
13.333
72
21.72473
39.11737
1.048
3.24
6.65
10.34
16.4
13.16
14.32
17.29
18.51
22.13
1
73
21.72552
39.12577
1.24
2.58
6.24
9.288
15.75
12.28
13.49
16.46
17.87
19.04
14.286
74
21.72467
39.13529
1.352
5.13
6.36
14.67
30.11
17.2
18.03
20.53
21.64
37.54
1.176
75
21.72471
39.14556
1.48
4.503
6.75
13.7
31.35
16.43
17.14
19.5
20.74
33.9
1.429
76
21.71603
39.11357
1.013
1.33
7.17
7.338
9.57
10.82
12.28
15.49
16.89
18.27
12.5
4 Results and discussion
The estimated shear-wave velocity at 76 MASW locations used to identify the engineering bedrock depth at each site (Fig. 4). The recorded depth of engineering bedrock for northern Jeddah urban area varies from zero (exposed on the ground surface) to approximately 36.23 m below ground surface. This depth in the western part is less than 15 m while increased eastward where it ranges between 20 and 36 m depth. This indicates that the engineering bedrock in the western zone obtained at a shallow depth than the rest of the studied area. These results correlated with the borehole data of Aldahri et al. (2017).
The ground motion frequency is of utmost importance where the PGA value alone cannot describe the surface ground motion. So, the response spectra are widely accepted parameter to specify the frequency content. Accordingly, the integrated influences of acceleration, amplitude, and frequency components can be expressed well the effects of ground motion. In this study, the ground surface response spectra for 76 locations were plotted with 5% critical damping. Fig. 5 shows examples of ground response analysis at the MASW site Nos. 1, 13, 22, 34, 52, and 73. Site No. 1 presents two PGA peaks of 16.53 cm/s2 and 17.64 cm/s2 which occurred at 1.25 Hz and 10.37 Hz, respectively. Site No. 13 shows two PGA peaks of 9.9 cm/s2 and 17.0 cm/s2 at 1.5 Hz and 10.7 Hz, respectively. Furthermore, site No. 22 shows two PGA peaks of 24.6 cm/s2 and 18.3 cm/s2 at 2.0 Hz and 10.5 Hz, respectively. Moreover, site No. 34 shows two PGA peaks of 15.5 cm/s2 and 17.9 cm/s2 at 1.53 Hz and 10.6 Hz, respectively. In addition, site No. 52 shows two PGA peaks of 24.9 cm/s2 and 19.5 cm/s2 at 2.0 Hz and 10.75 Hz, respectively. Finally, site No. 73 shows two PGA peaks with the same value of 18.5 cm/s2 at 1.3 Hz and 10.9 Hz. According to these values, it can be stated that there is vertical variation in the density of the subsurface materials where these sediments vary from dense to very dense at different depths which is reflected in the presence of two fundamental resonance frequencies at the MASW measurement sites.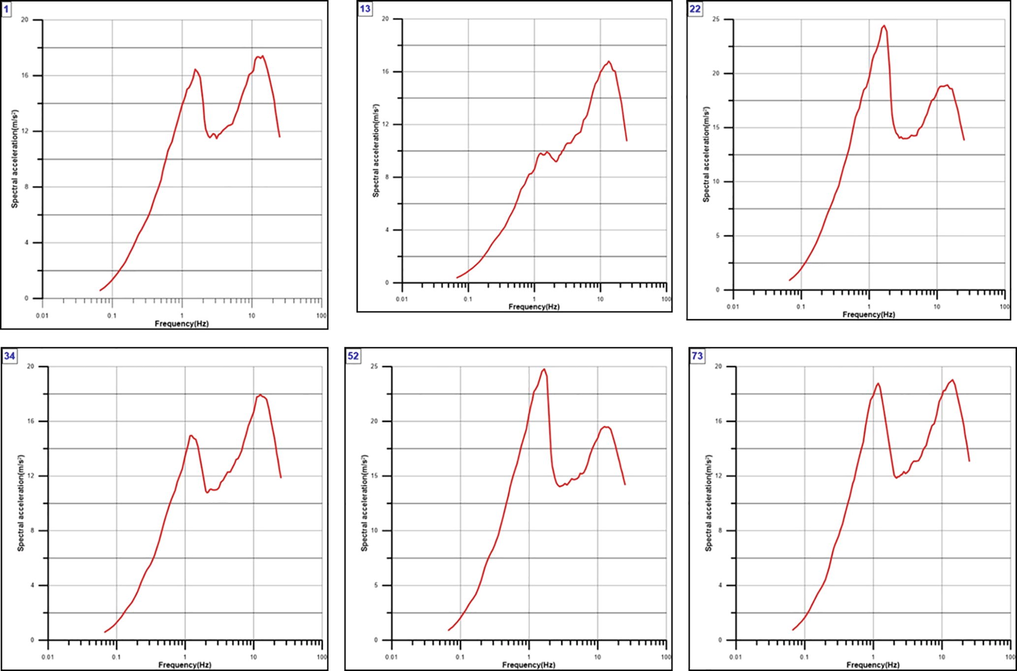
Ground response spectra for 5% damping at MASW sites in the study area.
The spectral acceleration (SA) values for all MASW stations of measurements at 1.5, 3, 5, 8, and 10 Hz were computed. These frequencies represent the frequency range for single-story to multistory buildings (Day, 2001). The Peak spectral acceleration (PSA) and corresponding frequency of each site were calculated. PSA varies from 16.8 to 62.6 cm/s2 (Fig. 6). The eastern study area has higher spectral acceleration compared to the western part. Table 2 shows that the frequency corresponding to the PSA varies from 1.05 to 14.28 Hz.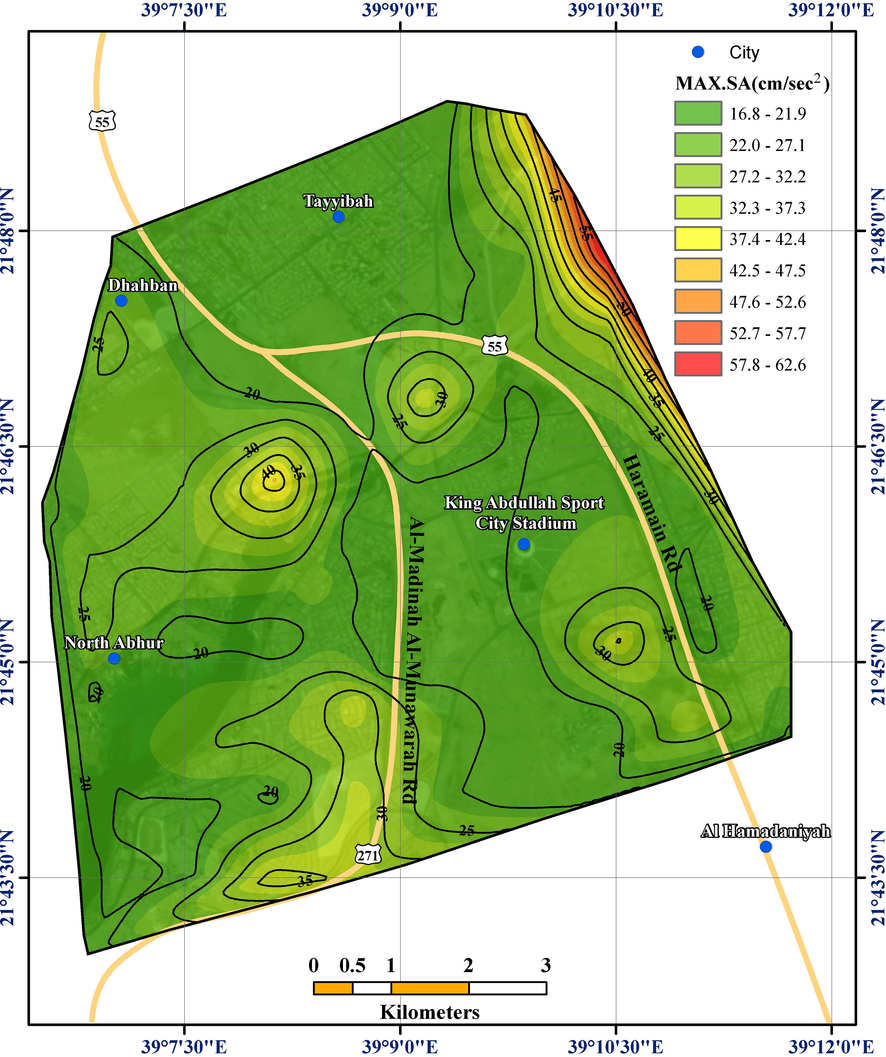
Maximum peak spectral ground acceleration with 5% damping at the study area.
Most of the urban area characterized by low-rise buildings and the frequency of the soil cover can be close to their fundamental frequency of vibration. According to Parolai et al., (2006), when the fundamental frequency of vibration of a building is higher than that the fundamental frequency of soil fo it may, however be, close to the frequency of higher modes. Higher modes are expected at frequencies fn = (2n + 1) fo where n = 1,2,3…… and fo is the fundamental frequency. The H/V spectral ratio provides the lower frequency threshold from which ground motion amplification due to soft soil can be expected (Aldahri et al., 2018). Therefore, it cannot exclude that in the study area, such soil amplification of ground motions may occur at higher mode frequencies close to the fundamental frequency of vibration of low-rise buildings, even if it is smaller than that at the fundamental frequency of the sedimentary cover (Parolai et al., 2006).
5 Conclusions
Based on the aforementioned, it is highly recommended that the sites of unconsolidated sediments should be treated from an engineering perspective. Although the value of the spectral acceleration is not high, it may be hazardous where the risk lies in the value of the frequency corresponding to the spectral acceleration, which may cause severe damage to facilities and infrastructure. This point should be considered before designing important engineering facilities in the study area. Results of this study should be forwarded to civil engineers, land-used planners, and decision makers during the design of either new buildings or rehabilitation of pre-existing structures.
Acknowledgments
The authors extend their appreciation to the Deanship of Scientific Research at King Saud University for funding this work through research group No. (RG-1440-003). Great thanks are extending to the reviewers for their beneficial review and valuable comments.
Declaration of Competing Interest
The authors declare that they have no known competing financial interests or personal relationships that could have appeared to influence the work reported in this paper.
References
- Seismic microzonation of Ubhur district, Jeddah, Saudi Arabia, using H/V spectral ratio. Arab. J. Geosci.. 2018;11(6)
- [CrossRef] [Google Scholar]
- Surface soil assessment in the Ubhur area, north of Jeddah, western Saudi Arabia, using a multichannel analysis of surface waves method. J. Geol. Soc. India. 2017;89:435-443.
- [Google Scholar]
- Akin, M., Kramer, S., Topal, T., 2013. Evaluation of Site Amplification of Erbaa, Tokat (Turkey). Seventh International Conference on Case Histories in Geotechnical Engineering. Paper 23. http://scholarsmine.mst.edu/icchge/7icchge/session04/23.
- The Seismicity of Egypt, Arabia and the Red Sea: A Historical Review. UK: Cambridge University Press; 1994. p. :181.
- Ansal, A., Tonuk, G., 2007. Source and site factors in microzonation. In: Pitilakis, K.D. (Ed.), Earthquake Geotechnical Engineering, 4th International Conference on Earthquake Geotechnical Engineering-Invited Lectures, pp. 73–92.
- Stochastic simulation of high-frequency ground motions based on seismological models of the radiated spectra. Bull. Seism. Soc. Am.. 1983;73:1865-1894.
- [Google Scholar]
- Simulation of ground motion using the stochastic method. Pure Appl. Geophys.. 2003;160:635-675.
- [Google Scholar]
- Estimating Vs30 (or NEHRP site Classes) from shallow velocity models (depths < 30 m) BSSA. 2004;94:591-597.
- [Google Scholar]
- Site amplifications for generic rock sites. Bull. Seism. Soc. Am.. 1997;87:327-341.
- [Google Scholar]
- Tectonic stress and the spectra of seismic shear waves from earthquakes. J. Geophys. Res.. 1970;75(26):4997-5009.
- [Google Scholar]
- Geotechnical Earthquake Engineering Handbook. McGraw-Hill; 2001.
- Microtremor measurements in Yanbu City of western Saudi Arabia: a tool of seismic microzonation. J. King Saud University-Science. 2010;22:97-110.
- [CrossRef] [Google Scholar]
- Vs30 mapping and soil classification for seismic site effect evaluation in Dinar region, SW Turkey. Geophys. J. Int.. 2006;165:223-235.
- [Google Scholar]
- Kanlı, A.I., 2010. Integrated Approach for Surface Wave Analysis from Near-Surface to Bedrock, Chapter 29, p. 461–476, Advances in Near-Surface Seismology, Geophysical Developments Series No. 15, SEG Reference Publications, Society of Exploration Geophysics Reference Publications Program, Tulsa, Oklahoma-USA. Publisher: Society of Exploration Geophysicists, American Geophysical Union and Environmental and Engineering Geophysical Society (Ed. Com.: R.D. Miller, J.D. Bradford and K. Holliger).
- Moore, T.A., Al-Rehaili, M.H., 1989. Geologic Map of the Makkah Quadrangle, Sheet 21D, Kingdom of Saudi Arabia, Ministry of Petroleum and Mineral Resources, Deputy Ministry for Mineral Resources Publication, Jeddah, K.S.A.
- Multichannel Analysis of Surface Waves to Map Bedrock. The Leading Edge: Kansas Geological Survey; 1999. p. :1392-1396.
- Nath, S.K., 2007. Seismic microzonation framework-principles and applications, Proc. Workshop on Microzonation, Indian Institute of Science, Bangalore, 26 – 27 June 2007, India, pp. 9–35.
- NEHRP recommended seismic provisions for new buildings and other structures (FEMA-P750). Washington DC: FEMA; 2009.
- Park, C.B., Miller, R.D., 2005. Seismic characterization of wind turbine sites near Lawton, Oklahoma, by the MASW method: Kansas Geological Survey Open-file Report 2005-22.
- Park, C.B., Ivanov, J., Miller, R.D., Xia, J., Ryden, N., 2001. Seismic investigation of pavements by MASW method-geophones approach, Proc. SAGEEP 2001, Denver, Colorado, RBA-6.
- Parolai, S, Bormann, P., Milkereit, C., 2006. Measurements of the fundamental resonance frequency of the sedimentary cover in thje Cologne area: contribution to the seismic microzonation. Ergebnisse aus dem Deutschen Forschungesnetz Naturkatastrophen, pp. 301–305.
- Multichannel analysis of surface waves for seismic site characterization using 2D genetic algorithm at Bahrah area, Wadi Fatima, Saudi Arabia. Arabian J. Geosci.. 2016;9(8)
- [CrossRef] [Google Scholar]
- Surface Wave Testing of Pavements. Doctoral Thesis, Department of Engineering Geology. Lund Institute of Technology, Lund University; 2004.
- Soil and Waves. New York: John Wiley & Sons Inc; 2001.
- Generation of stochastic earthquake ground motion in western Saudi Arabia as a first step in development of regional ground motion prediction model. Arabian J. Geosci.. 2018;11:38.
- [Google Scholar]
- Estimation of near-surface shear-wave velocity by inversion of Rayleigh wave. Geophysics. 1999;64:691-700.
- [Google Scholar]
- The selection of field acquisition parameters for dispersion images from multichannel surface wave data. Pure Appl. Geophys.. 2004;161:185-201.
- [Google Scholar]


