

Translate this page into:
Eleven genetic variants of seven important candidate genes involved in manifestation of type 2 diabetes mellitus
⁎Corresponding author at: Department of Zoology, College of Science, King Saud University, Riyadh 11451, Saudi Arabia. aalidaoud@ksu.edu.sa (Daoud Ali)
-
Received: ,
Accepted: ,
This article was originally published by Elsevier and was migrated to Scientific Scholar after the change of Publisher.
Abstract
Background
Diabetes especially type 2 diabetes mellitus (T2DM) is securing the rank under five around the world and leading cause of death cardiac disease and cancer. T2DM is a severe inflammatory state mainly associated to obesity and enhanced oxidative stress.
Objectives
We have investigated eleven genetic polymorphisms of seven important genes viz. IL-10, TNF-α, IL-6, adiponectin, IL-1, IL-18, and Vitamin D-receptor. We have focused to investigate the haplotypes, gene-gene interactions and their role in determining individual susceptibility to T2DM and their manifestation.
Methods
Eleven genetic variants of seven important candidate genes in 440 T2DM individuals and 440 controls were genotyped using conventional polymerase chain reaction (PCR) and PCR restriction fragment length polymorphism (PCR-RFLP). All calculations were done by SPSS software and LD were analysed by haploview (SHEsis software).
Results
Genotypic frequency of rs1800872, rs1800795, rs2241766, rs17846866 and rs1946518 showed highly significant association in our population. While allele frequencies of rs1800795, rs2241766 and rs1946518 showed highly significant association. The allele set of “CGGAGGTAFTB”, “CGGAGTTAFTB” and “CGGATGTCFTB” increase the chance of diabetes up to 1.6 times. This study reflects that these individuals are more susceptible of having T2DM.
Conclusions
The present study will provide a new insight in the development and the manifestation of T2DM. These genetic studies showing gene interaction for the susceptibility of the disease may be used as prognostic markers and alter treatment strategies for T2DM.
Keywords
Diabetes
Gene interaction
Genetic variants
Linkage
Allele

1 Introduction
Diabetes especially type 2 diabetes mellitus (T2DM) is securing the rank under five around the world and leading cause of death cardiac disease and cancer. From our previous reports which revealed that South east Asia including India has 78.3 million diabetics which are expected to increase up to 140.2 million till 2040 (Bid et al., 2008; Banerjee and Saxena, 2012a,2012b; Saxena et al., 2012a,2012b; IDF, 2015). The complex interactions and associations among lymphoid cells are usually mediated by a group of proteins which are collectively designated as cytokines. They include immune modulating agents like interleukins and inteferons (Banerjee and Saxena, 2012a,2012b). Apart from this the major sub group of cytokines, the chemokines which are of low molecular weight cytokines that alter the behaviour of leukocyte. Traditionally the cytokines have been classified into pro- and anti-inflammatory. They are antagonistic in behaviour for each other i.e. proinflammatory effector functions are inhibited by anti-inflammatory cytokines. These inflammatory mediators have been proposed to be involved directly or indirectly in causing T2DM and their manifestation. As Asian Indians have more prone and have a greater susceptibility to T2DM, they are a good site of population for carrying out such genetic studies (Bid et al., 2009a,2009b,2010). Polymorphisms (SNPs), mainly those within the regulatory regions of cytokines genes often have to be involved at expression levels and can be disease modifiers. Individuality in the inheritance of this polymorphic genes lead to change in their immune responses. This might change the severity as well as the duration of inflammation, thereby leading to the progression of T2DM (Dinarello, 1996; Wilson et al., 1997; Bidwell et al., 1999). All genes of IL-1 family are polymorphic and most of these polymorphisms have been shown to be involved in either the susceptibility or the severity of inflammatory conditions and diseases (Haukim et al., 2002). The pro-inflammatory cytokine IL-18, a member of IL-1 family is playing a crucial role in the cascade of inflammation. It is highly expressed in atherosclerotic plaques and plays an important role in the destabilization of plaques (Mallat et al., 2002). A polymorphic variation in IL-6 gene might increases risk for T2DM development and was already reported (Vozarova et al., 2003; Illig et al., 2004; Saxena et al., 2014). While, the predominance nature of IL-10 genotype in T2DM is mainly due to its protective nature against the inflammation and encouraging humoral responses which delay the activation of inflammatory cytotoxic reactions involved in destruction of pancreatic β-cell. IL-10 is involved to down regulate the secretion of mainly pro-inflammatory cytokines secreted from monocytes/macrophages (Sankaran et al., 1999). Moreover, VDR gene is also a novel candidate gene and contributes to the T2DM susceptibility (Saxena et al., 2018). VDR is a part of the steroid/thyroid hormone receptor family and is involved in regulating the normal functions of the pancreas especially the secretion of insulin. They play the major role in regulating the β-cell insulin secretion (Saxena et al., 2018). It would be quite interesting to know whether the polymorphisms in aforesaid genes taken together would predispose and unwinding the hidden related facts in the T2DM manifestation. In our earlier reports, we have thoroughly went from anthropometric and biochemical parameters in T2DM in association with individual as well as in combination of polymorphisms with cytokine gene (Saxena et al., 2009,2012a,2012b; Saxena et al., 2015). We have investigated eleven genetic polymorphisms of seven important genes viz. IL-10, TNF-α, IL-6, adiponectin, IL-1, IL-18, and Vitamin D-receptor. We have focused to investigate the gene-gene interactions and their role in determining individual susceptibility to T2DM and their manifestation.
2 Material and methods
2.1 Molecular and biochemical studies
2.1.1 Patient selection and clinical evaluation
Enrolled Type 2 diabetes patients (n = 440) from the OPD of King George’s Medical University (KGMU), Lucknow, India parallelly with age/Sex-matched normal healthy controls (n = 440) with proper written consent after due approval of IEC including all anthropometric and biochemical data.
2.1.2 DNA extraction and genotyping
Genomic DNA was extracted from peripheral blood mononuclear cells (PBMCs) using salting out method (Saxena et al., 2009,2012a,2012b). Eleven genetic variants of seven important candidate genes viz. IL-10-592A/C (rs1800872), TNF-a-308G/A (rs1800629), IL-6-174G/C (rs1800795), IL-6-597G/A (rs1800797), Adiponectin + 45G/T (rs2241766;Q1), Adiponectin + 10211 T/G (rs17846866;Q2), IL-1b-511C/T (rs16944), IL-18-607 A/C (rs1946518), Vitamin D Receptor (VDR) FokIT/C (rs2228570), VDR TaqIC/T (rs731236) and VDR BsmIA/G (rs1544410) were genotyped using conventional polymerase chain reaction (PCR) in a 15 µl reaction mixture containing 100 ng of template DNA, buffer (100 mM Tris, pH 9.0; 500 mM KCl; 15 mM MgCl2; 0.1% gelatin), 200 lM dNTP, 10 pmol of each primer and 1.0 unit Taq DNA polymerase followed by PCR restriction fragment length polymorphism (PCR-RFLP). The minor allele frequency (MAF) ≥ 0.01 for genotyped SNPs were included in the present study. The primers designed by Primer 3.0 online software. Other methodological regarding sequences of primers, condition of PCR reactions, size of amplicon (bp), type of restriction endonucleases (RE) required were as per Table 1 (Bid et al., 2009a,2009b). To maintain the efficacy and quality of genotyping random duplicate samples in ∼ 20% of the samples were performed. The PCR products digested with RE as per Table 1 (Fermentas, USA) respectively were electrophoresed on 12.5% polyacrylamide gels. The genotyping results were cross checked in 20% random duplicates and success rate in more than 98% concordance was obtained.
Genes
SNP [Position (rs no.)]
Primer Sequences (5′–3′)
PCR Conditions (Tm/Cy)
Amplicon Size (bp)
RE
IL-10
−592A/C (rs1800872)
F-CCTAGGTCACAGTGACGTGG
R-GCTAGTCAGGTAGTGCTCACC63/35
411
RsaI
TNF-α
−308G/A (rs1800629)
F-AGGCAATAGGTTTTGAGGGCCAT
R-TTGGGGACACAAGCATCAAGG64/35
147
NCoI
IL-6
−174G/C (rs1800795)
F-TTGTCAAGACATGCCAAGTGGT
R-GGGAAAATCCCACATTTGATAA57/44
231
NlaIII
−597G/A (rs1800797)
F-GGAGTCACACACTCCACCT
R-CTGATTGGAAACCTTATTAAG61.5/35
527
FokI
Adiponectin
+45G/T (rs2241766)
F-GGCTCAGGATGCTGTTGCTGG
R-GCTTTGCTTTCTCCCTGTGTCT60/35
327
BspHI
+10211 T/G (rs1784686)
F-GCTAAGTATTACAGATTTCAGGGCAG
R-CAGCAACAGCATCCTGAGC60/35
222
PleI
IL-1β
−511C/T (rs16944)
F-TGGCATTGATCTGGTTCATC
R-GTTTAGGAATCTTCCCACTT60/35
304
SacI
IL-18
−607 A/C (rs1946518)
F-CTTTGCTATCATTCCAGGAA
R-TAACCTCATTCAGGACTTCC60/35
300
MseI
VDR
FokI T/C (rs2228570)
F-AGCTGGCCCTGGCACTGACTCTGCTCT
R-ATGGAAACACCTTGCTTCTTCTCCCTC58/35
265
Fok I
TaqI C/T (rs731236)
F-CAACCAAGACTACAAGTACCGCGTCAGTGA
R-AACCAGCGGGAAGAGGTCAAGGG63/35
740
Taq I
BsmI A/G (rs1544410)
F-CAGAGCATGGACAGGGAGCAA
R-GCAACTCCTCATGGCTGAGGTCTC63/35
825
Bsm I
2.2 Statistical analysis
Allele frequencies and genotypic frequencies were compared by 2 × 2 and 2 × 3 contingency table by Chi-square test (χ2) and Fisher’s exact test respectively followed by HWE assiation at individual locus usingChi-squire statistic.
Moreover, SHEsis software were used for multiple regression analysis (MRA) to analyze the gene-gene interaction association along with Pairwise Linkage disequilibrium (LD) based on D’ statistics and correlation coefficient (r2) (Shi and He, 2005). Studied Gene-Gene Interactions, Logistic regression was used to study the combination of gene-gene interactions between eleven variants of eight genes.
3 Results
The biochemical parameters showed significant association with FBS, PPBS, TC, TGL, HDL, LDL and VLDL (P < 0.001) when compared with healthy controls (Table 2). All the genotyping data for individual SNPs in T2DM patients (n = 440) and age-sex matched healthy controls (n = 440) have been summarized and the genotypic frequency of rs1800872, rs1800795, rs2241766, rs17846866 and rs1946518 showed highly significant association in our population. While rs1800629 and rs731236 showed significant association in our population. The rs1800797, rs16944, rs2228570 and rs1544410 showed no significant association (Table 3). When we assessed the allele frequencies of these variants we found that rs1800795, rs2241766 and rs1946518 showed highly significant association and rs2241766 increases the chance of having diabetes by twice [OR; 1.955(95% CI;1.595–2.395)]. Only allele of rs1800629 showed significant association in our population (p = 0.010) (Table 4). Further we have gone to analyse the carriage rate allele frequencies of individual alleles and found that ‘C’ allele of rs1800795 and rs1800872, both ‘T’ and ‘G’ allele of rs2241766 and ‘A’ allele of rs1946518 showed highly significant association. While recessive allele of rs1544410 i.e. allele ‘b’ also showed highly significant association (Table 5). Later on we go for gene gene interaction analysis of all studied variants of IL-10-592A/C (rs1800872), TNF-a-308G/A (rs1800629), IL-6-174G/C (rs1800795), IL-6-597G/A (rs1800797), Adiponectin + 45G/T (rs2241766;Q1), Adiponectin + 10211 T/G (rs17846866;Q2), IL-1b-511C/T (rs16944), IL-18-607 A/C (rs1946518), Vitamin D Receptor (VDR) FokIT/C (rs2228570), VDR TaqIC/T (rs731236) and VDR BsmIA/G (rs1544410) and found very interesting results. We found that the allele set
Clinical characteristics
Controls
Cases
Age (yr)
45.68 ± 9.11
48.10 ± 8.32
Fasting blood glucose (FBS) mg/dl
82.18 ± 7.68
169.32 ± 74.38***
Post-prandial blood glucose (PPBS) mg/dl
141.25 ± 14.10
278.15 ± 106.27***
Total cholesterol (TC) mg/dl
178.40 ± 27.35
226.51 ± 38.35***
Triglycerides (TGL) mg/dl
124.90 ± 44.24
114.16 ± 19.12***
High density lipoproteins (HDL) mg/dl
47.10 ± 13.15
44.98 ± 9.12**
Low density lipoproteins (LDL) mg/dl
66.13 ± 25.10
157.10 ± 51.47***
Very low density lipoproteins (VLDL) mg/dl
24.90 ± 7.40
23.01 ± 3.26***
Serum creatinine (SCRT) mg/dl
1.03 ± 0.11
1.05 ± 0.07
Gene
Genotype
Controls (n = 440)
Patients (n = 440)
p-value
IL-10 rs1800872 (−592A/C)
CC
243
220
0.000
CA
148
205
AA
49
15
TNF-α rs1800629 (−308 G/A)
GG
248
288
0.022
GA
167
132
AA
25
20
IL-6 rs1800795 (−174 G/C)
GG
230
310
0.000
GC
187
114
CC
23
16
IL-6 rs1800797 (−597 G/A)
AA
259
267
0.764
AG
161
151
GG
20
22
AdipoQ rs2241766 (+45G/T;Q1)
TT
73
200
0.000
TG
318
227
GG
49
13
AdipoQ rs17846866 (+10211 T/G;Q2)
TT
270
221
0.000
TG
121
176
GG
49
43
IL-1β rs16944 (−511C/T)
TT
256
226
0.890
TC
168
190
CC
16
24
IL-18 rs1946518 (−607 A/C)
CC
245
126
0.000
AC
167
277
AA
28
37
VDR FokI (T/C) (rs2228570)
FF
86
74
0.567
Ff
259
270
ff
95
96
VDR TaqI (C/T) (rs731236)
TT
134
146
0.009
Tt
237
196
tt
69
98
VDR BsmI (A/G) (rs1544410)
BB
317
320
0.543
Bb
89
94
bb
34
26
Gene
Allele
Controls (n = 880)
Patients (n = 880)
p-value
Odd’s Ratio
IL-10 rs1800872 (−592A/C)
C
634
645
0.556
0.939 (0.761–1.158)
A
246
235
TNF-α rs1800629 (−308 G/A)
G
663
708
0.010
0.742(0.592–0.931)
A
217
172
IL-6 rs1800795 (−174 G/C)
G
647
734
<0.000
0.552(0.438–0.697)
C
233
146
IL-6 rs1800797 (−597 G/A)
A
679
685
0.732
0.962(0.769–1.203)
G
201
195
AdipoQ rs2241766 (+45G/T;Q1)
T
464
627
<0.000
0.450(0.370–0.548)
G
416
253
AdipoQ rs17846866 (+10211 T/G;Q2)
T
661
618
0.022
1.280(1.037–1.579)
G
219
262
IL-1β rs16944 (−511C/T)
T
680
642
0.076
1.218(0.979–1.515)
C
200
238
IL-18 rs1946518 (−607 A/C)
C
657
592
<0.000
1.955(1.595–2.395)
A
223
351
VDR FokI (T/C) (rs2228570)
F
431
418
0.535
1.061(0.880–1.279)
f
449
462
VDR TaqI (C/T) (rs731236)
T
505
488
0.414
1.082(0.896–1.306)
t
375
392
VDR BsmI (A/G) (rs1544410)
B
723
734
0.487
0.916(0.715–1.173)
b
157
146
Gene
Carriage Rate
Controls (n = 440)
Patients (n = 440)
p-value
Odd’s Ratio
Controls (n = 440)
Patients (n = 440)
p-value
Odd’s Ratio
IL-10 rs1800872 (−592A/C)
C+
391
425
<0.000
0.282(0.155–0.510)
A+
197
220
0.121
0.811(0.622–1.057)
C−
49
15
A−
243
220
TNF-α rs1800629 (−308 G/A)
G+
415
420
0.445
0.790(0.423–1.445)
A+
192
152
0.006
1.467(1.117–1.926)
G−
25
20
A−
248
288
IL-6 rs1800795 (−174 G/C)
G+
417
424
0.254
0.684(0.356–1.313)
C+
210
130
<0.000
2.177(1.650–2.873)
G−
23
16
C−
230
310
IL-6 rs1800797 (−597 G/A)
A+
420
418
0.524
0.804(0.411–1.573)
G+
181
173
0.582
1.079(0.824–1.412)
A−
20
22
G−
259
267
AdipoQ rs2241766 (+45G/T ;Q1)
T+
391
427
<0.000
0.243(0.130–0.455)
G+
367
240
<0.000
4.189(3.062–5.732)
T−
49
13
G−
73
200
AdipoQ rs17846866 (+10211 T/G;Q2)
T+
391
397
0.509
0.864(0.561–1.332)
G+
170
219
0.001
0.635(0.486–0.831)
T−
49
43
G−
270
221
IL-1β rs16944 (−511C/T)
T+
424
416
0.198
1.529(0.801–2.919)
C+
184
214
0.042
0.759(0.582–0.991)
T−
16
24
C−
256
226
IL-18 rs1946518 (−607 A/C)
C+
412
403
0.247
1.351(0.811–2.249)
A+
195
314
<0.000
0.319(0.242–0.422)
C−
28
37
A−
245
126
VDR FokI (T/C) (rs2228570)
F+
345
344
0.935
1.013(0.736–1.396)
f+
354
366
0.295
0.832(0.590–1.173)
F−
95
96
f−
86
74
VDR TaqI (C/T) (rs731236)
T+
371
342
0.013
1.541(1.095–2.167)
t+
306
294
0.385
1.134(0.854–1.506)
T−
69
98
t−
134
146
VDR BsmI (A/G) (rs1544410)
B+
406
414
0.286
0.750(0.442–1.272)
b+
123
120
<0.000
0.472(0.343–0.649)
B−
34
26
b-
317
320
“AGGATTTCFTB”, “CAGATTTCFTB”, “CGCATTTCFTB”, “CGGAGGTAFTB”, “CGGAGTTAFTB”, “CGGATGTCFTB”, “CGGATTTCFTB”, “AGGATTTAFTB”, “CGCATTTAFTB”, “CGGATGTAFTB”, “CGGATTCCFTB” and ”CGGATTTAFTB” showed significant association in the manifestation of the disease (Table 6). Allele set of “CGGAGGTAFTB”, “CGGAGTTAFTB” and “CGGATGTCFTB” increase the chance of diabetes upto 1.6 times; the OR are 1.436 [95% CI; 0.796 ∼ 2.587], 1.610 [95% CI; 0.890 ∼ 2.912] and 1.466 [95% CI;0.791 ∼ 2.717] respectively. This shows that these set of allele from IL to 10-592A/C (rs1800872), TNF-a-308G/A (rs1800629), IL-6-174G/C (rs1800795), IL-6-597G/A (rs1800797), Adiponectin + 45G/T (rs2241766;Q1), Adiponectin + 10211 T/G (rs17846866;Q2), IL-1b-511C/T (rs16944), IL-18-607 A/C (rs1946518), Vitamin D Receptor (VDR) FokIT/C (rs2228570), VDR TaqIC/T (rs731236) and VDR BsmIA/G (rs1544410) increased the risk of the disease upto 1.6 times. Linkage disequilibrium (D’) and Correlation coefficient (r2) of IL-10-592A/C (rs1800872), TNF-a-308G/A (rs1800629), IL-6-174G/C (rs1800795), IL-6-597G/A (rs1800797), Adiponectin + 45G/T (rs2241766;Q1), Adiponectin + 10211 T/G (rs17846866;Q2), IL-1b-511C/T (rs16944), IL-18-607 A/C (rs1946518), Vitamin D Receptor (VDR) FokIT/C (rs2228570), VDR TaqIC/T (rs731236) and VDR BsmIA/G (rs1544410) eleven variants with T2DM in North Indian population is shown in (Fig. 1).
Loci chosen for hap-analysis:
Case (freq)
Control (freq)
Chi2
Fisher's p
Pearson's p
Odds Ratio [95%CI]
rs1800872 rs1800629 rs1800795 rs1800797 rs2241766 rs17846866 rs16944 rs1946518 rs2228570 rs731236 rs1544410
A G G A T T T C F T B*
13.67(0.016)
29.39(0.033)
9.875
0.001686
0.001683
0.361 [0.187 ∼ 0.698]
C A G A T T T C F T B*
22.76(0.026)
42.53(0.048)
11.574
0.000674
0.000673
0.407 [0.239 ∼ 0.692]
C G C A T T T C F T B*
0.00(0.000)
51.30(0.058)
67.026
0.00e + 000
2.82e-016
–
C G G A G G T A F T B*
32.00(0.036)
18.78(0.021)
1.460
0.227055
0.226977
1.436 [0.796 ∼ 2.587]
C G G A G T T A F T B*
33.84(0.038)
17.86(0.020)
2.519
0.112552
0.112483
1.610 [0.890 ∼ 2.912]
C G G A T G T C F T B*
29.41(0.033)
16.89(0.019)
1.494
0.221614
0.221535
1.466 [0.791 ∼ 2.717]
C G G A T T T C F T B*
99.48(0.113)
156.80(0.178)
40.820
1.82e-010
1.72e-010
0.366 [0.268 ∼ 0.501]
A G G A T T T A F T B*
32.59(0.037)
0.00(0.000)
28.041
1.24e-007
1.21e-007
–
C G C A T T T A F T B*
37.32(0.042)
0.00(0.000)
32.326
1.38e-008
1.34e-008
–
C G G A T G T A F T B*
32.82(0.037)
0.00(0.000)
28.250
1.11e-007
1.09e-007
–
C G G A T T C C F T B*
38.12(0.043)
0.00(0.000)
33.060
9.47e-009
9.17e-009
–
C G G A T T T A F T B*
33.51(0.038)
0.00(0.000)
28.870
8.09e-008
7.92e-008
–
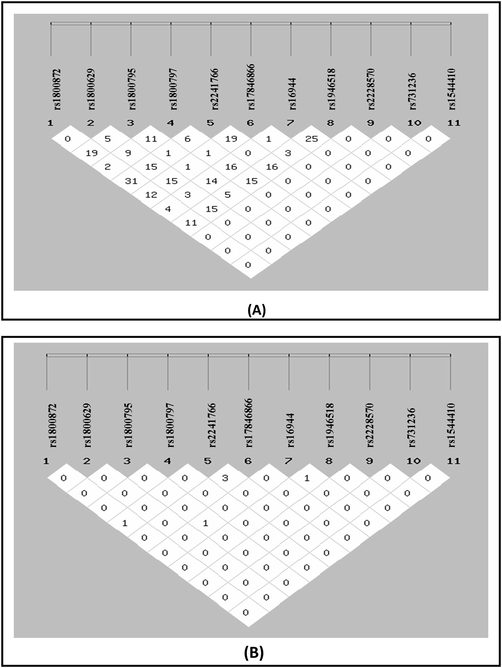
(A) Linkage Disequilibrium (D’) and (B) Correlation coefficient (r2) of all eleven studied gene variants.
4 Discussion
Diabetes is basically a condition with an involvement of pro-inflammatory state having an enhanced level of circulating cytokines and suggests a causal role for inflammation in its etiology. Previous reports documented that hyperglycemia is associated with T2DM and acutely enhanced level of peripheral cytokines viz. IL-1, TNF-α and IL-6 (Tsiavou et al., 2004). A significant association of IL-4 gene variants have also been reported with increased risk of T2DM along with other related complications in north Indians (Achyut et al., 2007). However, as per our previous reports in IL-1Ra gene variants we have reported four different alleles in north Indians with T2DM. Most of the T2DM individuals were homozygous genotype I as per our previous report2 and its association with coronary artery disease (CAD) individuals with and without T2DM (Marculescu et al., 2002). It was documented that these genetic variants increases the risk of having T2DM upto 3.4 times. Other IL-1 gene variants viz. IL-1 α-889, IL-1 β + 3954 (rs 1143634) and IL-1 β-511) in T2DM as well as periodontitis were also reported (Struch et al., 2008; Lopez et al., 2009). One of the case-control study of IL-1β gene variant found significant association in genotypic frequencies (P < 0.0001) but no association was observed in allele frequencies of −511C and −511 T. While a new sub member of IL-1 family, the IL-18 gene variant have been vastly studied by other groups in T2DM associated complications. One of the renowned research group i.e. Opstad et al. (2011) studied three IL-18 gene variants +183 A/G, −137 G/C and −607C/A in T2DM individuals and reported that only IL-18 + 183 A/G was significantly associated with T2DM manifestation. However, in the population of china only −607C/A gene variant was found to be associated with T2DM (Huang et al., 2010). Controversial results were reported by European researchers on IL-18 gene variants with T2DM and other metabolic diseases and disorders (Thompson et al., 2007; Rafiq et al., 2008; He et al., 2010). In contrast to the previous reports we found that in north Indians, −607C/A gene variants showed significant genotypic association (P = 0.002) and most of the individuals were heterozygous. Moreover, lots of controversies on the results on IL6-174 G/C and -597 A/G gene variants with T2DM or insulin resistance. Apart from this, ‘G’ allele of -174 G/C SNP was found to be associated with increased T2DM risk in Americans and Spanish Caucasians but not in the Finnish Diabetes Prevention Study (DPS) (Kubaszek et al., 2003a,2003b).
Furthermore, nondiabetic individual was found to be associated with IL6-174C/C genotype in higher insulin sensitivity (Fernandez-Real et al., 2000; Kubaszek et al., 2003a,2003b). While -174 G/C was found to be associated with T2DM risk in North Indians and in the metagenomic Indian study (Mukhopadhyaya et al., 2010; Popko et al., 2010; Ferreira et al., 2011). Although TNFα-308 G/A was also a focused gene variant in T2DM of several groups. In Arragonians, TNFα-308 G/A gene variant was found to be associated with T2DM (Vendrell et al., 2003). However, Greece and UK/Irish origin reports showed contended results with other reports from China, Japan and Mexico (, Boraska et al., 2010). Significant associations was reported from Croatian Caucasian, Finnish, Indian, Mexican and Taiwanese individuals on TNFα-308 G/A gene variants with T2DM. No association was observed in genotypic and allelic frequencies. The −592*A allele of IL-10-592 A/C gene variant was reported and found to be increased in T2DM individuals. The low frequency of T2DM in Taiwanese population may be attributed to the involvement of ‘C’ allele of IL-10-592 which is very rare in Caucasians. Many research groups have reviewed the Adiponectin gene variants in various ethnic groups.
The study on urban Asian Sikhs, 5 tag SNPs of Adiponectin gene revealed that it has no relation in T2DM. However, in Whitehall II study, adiponectin was found independently a predictor of diabetes and GWAS showed significant association with the gene loci of Adiponectin. In +45 T/G gene variant, subjects with ‘GG’ and ‘TG’ genotypes were at greater risk of having T2DM in obese Iranians while, both these genotypes were related with gestational T2DM in the women of Malaysia. Our previous report reported for the first time that +10211 T/G polymorphism in intron 1 of Adiponectin gene is related with T2DM individuals in support with previous report in an Asian Indians. Result also in support with Pima Indians and French Caucasians. Linkage disequilibrium is the occurrence of some allele and genetic combinations in a population more or less often than would be expected from a random formation of haplotypes from other alleles depends on their frequencies.
Gene-gene interaction analysis of eight gene variants when taken together in our previous genetic report, CGGATTTC* and CGGAGTCA* set of allele combination was reported to increase the risk upto 7.5 and 4.248 times respectively. Similarly, in this present report we have observed that allele set of “AGGATTTCFTB”, “CAGATTTCFTB”, “CGCATTTCFTB”, “CGGAGGTAFTB”, “CGGAGTTAFTB”, “CGGATGTCFTB”, “CGGATTTCFTB”, “AGGATTTAFTB”, “CGCATTTAFTB”, “CGGATGTAFTB”, “CGGATTCCFTB” and ”CGGATTTAFTB” in IL-10-592A/C (rs1800872), TNF-a-308G/A (rs1800629), IL-6-174G/C (rs1800795), IL-6-597G/A (rs1800797), Adiponectin + 45G/T (rs2241766;Q1), Adiponectin + 10211 T/G (rs17846866;Q2), IL-1b-511C/T (rs16944), IL-18-607 A/C (rs1946518), Vitamin D Receptor (VDR) FokIT/C (rs2228570), VDR TaqIC/T (rs731236) and VDR BsmIA/G (rs1544410) were found to significantly associated and increases the risk of having T2DM.
Moreover, allele set of “CGGAGGTAFTB”, “CGGAGTTAFTB” and “CGGATGTCFTB” increase the chance of diabetes upto 1.6 times in our population. This study reflects that these individuals are more susceptible of having T2DM. The present study will provide a new insight in the development and the manifestation of T2DM. Gene variant studies have shown a considerable level of variation amongst various ethnic groups around the globe. Therefore, it is mandatory to perform such genetic studies so that individuals can be benefitted. Individuals who are at high risk will be able to take prior precautionary measures so, they may avoid or delay the onset of disease. These genetic studies showing gene interaction for the susceptibility of the disease may be used as prognostic markers and alter treatment strategies for T2DM.
Acknowledgements
The authors would like to extend their sincere appreciation to the Deanship of Scientific Research at King Saud University for its funding of this research through the Research Group Project No RG-1435-076.Author MS is thankful to ICMR, New Delhi, India.
Declaration of Competing Interest
The authors declare that they have no known competing financial interests or personal relationships that could have appeared to influence the work reported in this paper.
References
- Genetic association of interleukin-1β (−511C/T) and interleukin-1 receptor antagonist (86 bp repeat) polymorphisms with type 2 diabetes mellitus in North Indians. Clin. Chim. Acta. 2007;377:163-169.
- [Google Scholar]
- An overview and molecular genetics of type 2 diabetes mellitus. Type 2 diabetes causes treatment and preventive strategies edt. Isidoros Calpis and Stefanos Frangopoulos. New York, USA: Nova Publishers; 2012. p. :1-64.
- Interleukin-1: Role in type 2 diabetes mellitus. Clin. Chim. Acta. 2012;413:1163-1170.
- [Google Scholar]
- Vitamin D receptor (FokI, BsmI and TaqI) gene polymorphisms and type 2 diabetes mellitus: a North Indian study. Indian J. Med. Sci.. 2009;63(5):187-194.
- [Google Scholar]
- Association of IL-4 and IL1RN (receptor antagonist) gene variants and the risk of type 2 diabetes mellitus: a study in the north Indian population. Indian J. Med. Sci.. 2008;62:259-266.
- [Google Scholar]
- Vitamin D receptor (FokI, BsmI and TaqI) gene polymorphism and type 2 diabetes mellitus: A North Indian study. Indian J. Med. Sci.. 2009;63:187-194.
- [Google Scholar]
- Association of Glutathione Stransferase GSTM1, T1 & P1 gene polymorphisms with type II diabetes mellitus in North India. J. Post. Grad. Med.. 2010;56:176181
- [Google Scholar]
- Cytokine gene polymorphism in human disease: on-line databases. Genes. Immunol.. 1999;1:3-19.
- [Google Scholar]
- Large-scale association analysis of TNF/LTA gene region polymorphisms in type 2 diabetes. BMC Med. Genet.. 2010;11:69.
- [Google Scholar]
- Interleukin-6 gene polymorphism and insulin sensitivity. Diabetes. 2000;49:517-520.
- [Google Scholar]
- Risk of glycemic disorder in elderly women adjusted by anthropometric parameters and cytokine genotypes. Rev. Assoc. Med. Bras.. 2011;57:565-569.
- [Google Scholar]
- Cytokine gene polymorphism in human disease: on-line databases. Genes. Immun.. 2002;3:313-330.
- [Google Scholar]
- Genome-wide association study identifies variants at the IL18-BCO2 locus associated with interleukin-18 levels. Arterioscler. Thromb. Vasc. Biol.. 2010;30:88590.
- [Google Scholar]
- 607 C/A polymorphism in the promoter of IL-18gene is associated with 2 h post-loading plasma glucose level in Chinese. Endocrine. 2010;37:507-512.
- [Google Scholar]
- IDF “Diabetes Atlas, Seventh Edition”, 2015.
- Significant association of the interleukin-6 gene polymorphisms C-174G and A-598G with type 2 diabetes. J. Clin. Endocrinol. Metab.. 2004;89:5053-5058.
- [Google Scholar]
- Promoter polymorphisms of the TNF-α (G-308A) and IL-6 (C-174G) genes predict the conversion from impaired glucose tolerance to type 2 diabetes. Diabetes. 2003;52:1872-1876.
- [Google Scholar]
- The C-174G promoter polymorphism of the IL-6 gene affects energy expenditure and insulin sensitivity. Diabetes. 2003;52:558-561.
- [Google Scholar]
- Interleukin-1 gene cluster polymorphisms associated with periodontal disease in type 2 diabetes. J. Periodontol.. 2009;80:1590-1598.
- [Google Scholar]
- Expression of interleukin-18 in human atherosclerotic plaques and relation to plaque instability. Eur. Heart. J.. 2002;23:831-834.
- [Google Scholar]
- Interleukin-1 receptor antagonist genotype is associated with coronary atherosclerosis in patients with type 2 diabetes. Diabetes. 2002;51:3582-3585.
- [Google Scholar]
- Metagenomic study of single-nucleotide polymorphism within candidate genes associated with type 2 diabetes in an Indian population. Genet. Mol. Res.. 2010;9:2060-2068.
- [Google Scholar]
- Circulating levels of IL-18 are significantly influenced by the IL-18 +183 A/G polymorphism in coronary artery disease patients with diabetes type 2 and the metabolic syndrome: an observational study. Cardiovasc. Diabetol.. 2011;10:110.
- [Google Scholar]
- Influence of interleukin-6 and G174C polymorphism in IL-6 gene on obesity and energy balance. Eur. J. Med. Res.. 2010;15:123-127.
- [Google Scholar]
- Gene variants influencing measures of inflammation or predisposing to autoimmune and inflammatory diseases are not associated with the risk of type 2 diabetes. Diabetologia. 2008;51:2205-2213.
- [Google Scholar]
- Cytokine gene polymorphisms predict acute graft rejection following renal transplantation. Kidney Int.. 1999;56:281-288.
- [Google Scholar]
- An interleukin-10 A-592C gene polymorphism associated with Type 2 Diabetes: A North Indian Study. Biochem. Genet.. 2012;50:549-559.
- [Google Scholar]
- Overt Diabetic Complications in Obese Type 2 Diabetes Mellitus Patients from North India. Arch. Appl. Sci. Res.. 2009;1:57-66.
- [Google Scholar]
- Cytokine Gene Variants as Predictors of Type 2 Diabetes Mellitus. Curr. Diabetes Rev.. 2018;14(3):307-319.
- [Google Scholar]
- Genetic association of adiponectin gene polymorphisms (+45T/G and +10211T/G) with type 2 diabetes in North Indians. Diabetes Metab. Syndr.. 2012;6:65-69.
- [Google Scholar]
- IL-1β, IL-18 and IL-1Ra gene variants in type 2 diabetes. J. Chem. Pharma. Res.. 2015;7(8):560-567.
- [Google Scholar]
- IL-6-597 A/G (rs1800797) and -174 G/C (rs1800795) gene polymorphisms in Type 2 diabetes. Ind. J. Med. Res.. 2014;140:60-68.
- [Google Scholar]
- SHEsis is a powerful software platform for analyses of linkage disequilibrium, haplotype construction, and genetic association at polymorphism loci. Cell. Res.. 2005;15:97-98.
- [Google Scholar]
- Interleukin-1 gene polymorphism, diabetes, and periodontitis: results from the Study of Health in Pomerania (SHIP) J. Periodontol.. 2008;79:501-507.
- [Google Scholar]
- A common interleukin 18 haplotype is associated with higher body mass index in subjects with diabetes and coronary heart disease. Metabolism. 2007;56:662-669.
- [Google Scholar]
- TNF-α, TGFβ1, IL-10, IL-6, gene polymorphisms in latent autoimmune diabetes of adults (LADA) and type 2 diabetes mellitus. J. Clin. Immunol.. 2004;24:591-599.
- [Google Scholar]
- A polymorphism in the promoter of the tumor necrosis factor-alpha gene (308) is associated with coronary heart disease in type 2 diabetic patients. Atherosclerosis. 2003;167:257-264.
- [Google Scholar]
- The interleukin-6 (-174) G/C promoter polymorphism is associated with type-2 diabetes mellitus in Native Americans and Caucasians. Hum. Genet.. 2003;112:409-413.
- [Google Scholar]
- Effects of a polymorphism in the human tumor necrosis factor alpha promoter on transcriptional activation. Proc. Nat. Acad. Sci. U.S.A.. 1997;94:3195-3199.
- [Google Scholar]


