

Electrochemical studies on the interactions of iron(ii) with some essential amino acids
⁎Corresponding author at: Renata Limited, Plot # 1, Milk Vita road, Section-07, Mirpur, Dhaka, Bangladesh. drhmnaseemakhtar@gmail.com (H.M. Naseem Akhtar)
-
Received: ,
Accepted: ,
This article was originally published by Elsevier and was migrated to Scientific Scholar after the change of Publisher.
Peer review under responsibility of King Saud University.
Abstract
Iron-amino acid complex is a nutritional feed ingredient for human and animals that contains organic iron. The organic iron is required by human and animals for numerous functions, including: oxygen transport, immunity, milk production and muscle development. The aim of this study is to interact Iron with three essential amino acids such as glycine, aspartic acid and proline, which was proved to be successful using cyclic voltammetry, chronoamperomety and chronocoulometry in the hydrochloric acid buffer. pH of maximum interaction was also investigated through all of these techniques. Then at the pH of maximum interaction, composition of interaction was also determined. pH of maximum interaction for glycine and proline are same and it is at pH 2.2. But for aspartic acid, it is at pH 1.8. An important feature is found in all the three interactions. It is that in all the cases more than one species are formed in the analysis of composition study. The findings from the chronoamperometric study are that after the interaction the spike heights are decreased, indicating towards a decrease in the rate of electrolysis and finally successful interaction. Chronocoulometric response shows that in case of Fe(II)-glycine and Fe(II)-aspartic acid interactions the charge at τ is increased, but for Fe(II)-proline interaction, it is decreased in comparison with the Fe(II) in the absence of any ligand. In all the cases adsorption occurs. The observations from the plots Q vs t1/2 and -Qr vs θ gives the conclusion that adsorption occurs at the electrode after interaction in all the cases.
Keywords
Iron
Amino acids
Voltammetry
Chronoamperomety
Chronocoulometry
pH

1 Introduction
Iron is the second most abundant metal on earth and an important transition metal. It has many oxidation states ranging from 2− to 6+, but 2+ and 3+ valances are of the greatest importance in biological systems. The 2+ and 3+ oxidation states, characterized by their d6 and d5 ground state configuration respectively, are exquisitely sensitive to both pH and the nature of the ligating functionality. At a cellular level, this sensitivity has been exploited, in as much as this metal can function both as an electron source and an electron sink (Chang, 1981).
A number of complexes are formed by iron(II). Most of them are octahedral. Iron(III) also forms a large number of complexes. These are mostly octahedral ones and the octahedron may be considered its characteristic co-ordination polyhedron. It also forms a few tetrahedral complexes, e.g. FeCl4− (Cotton and Wilkinson, 1972).
Iron is the most widespread and important transition metal which has functional roles in living systems. Hemoglobin, myoglobin, cytochromes, and some enzymes are the chief heme proteins, which are characterized by the presence of the heme group as the iron containing unit (Cotton and Wilkinson, 1972).
Amino acids are the building blocks of proteins. By definition, an amino acid contains at least one amino group and at least one carbonyl group (Chang, 1981). Nearly twenty five amino acids have been obtained from the hydrolysis of proteins.
Among all the amino acids, certain may be synthesized in the body while the other cannot be synthesized in the body at a rate necessary for normal growth and hence must be supplied in the diet. Therefore, the first category of amino acids is called dispensable or non-essential amino acids, while those of the second category are known as indispensable or essential amino acids. A deficiency in any of the essential amino acids prevents growth in young animals and may even cause death (Agarwal, 2006).
The amino acids used in the present study are glycine, aspartic acid and proline (Fig. 1). Among these the former two are aliphatic amino acids and the last one is a heterocyclic amino acid. Again between the two aliphatic amino acids, glycine is neutral and aspartic acid is acidic in nature (David and Gosser, 1993; Haider, 1994; Donald, 2003).
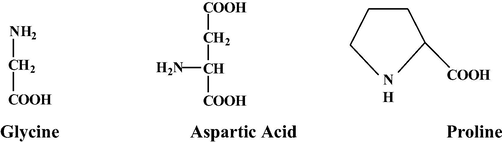
- Three common amino acids.
2 Materials and methods
2.1 Reagents and solutions
The buffers were prepared using potassium chloride (Merck, Germany) and hydrochloric acid (Sigma-Aldrich Laborchemikalien, GmbH). Preparation of the ferrous sulphate was accomplished by the reaction between iron turnings and sulphuric acid (Aldrich Chemical Co Ltd, Gillingham Dorset England). Ligands used were glycine (Serva Feinbiochemica. Heidelberg) and aspartic acid (BDH Chemicals Ltd, Poole England), proline (Aldrich Chem. Co.). Cleaning of the electrodes and all the solutions were prepared using de-ionized water. 99.997% Nitrogen (Bangladesh Oxygen, Ltd.) was used for purging purpose.
2.2 Equipments
The current–voltage measurements were performed with an Epsilon electrochemical work station of Bioanalytical systems, Inc. (USA). A voltammetric cell (three electrode electrolysis system) made of borosilicate glass was used in this work. Glassy carbon electrode (GCE) electrode was used as working electrode, Ag/AgCl (satd. KCl) as reference electrode, and a platinum wire as counter electrode. The agitating of the solution was done by an AGE (Velp Scientifica) magnetic stirrer.
3 Results and discussion
3.1 Cyclic voltammetric study of interaction of Fe(II) with glycine
Fe(II) interacts significantly with glycine in the hydrochloric acid buffer. After interaction with glycine, the number of peaks is unaltered, but the peak currents for both cathodic and anodic peaks are so much decreased. This decrease in peak current is due to the complexation of Fe(II) with glycine, since the number of uncoordinated Fe(II) is decreased. A remarkable change can be noticed in the peak positions (Fig. 2) and as a result the peak separation potential reduced (Finar, 1975; Bott and Jackson, 1969; Donath et al., 2011; Hertrampf and Olivares, 2004).
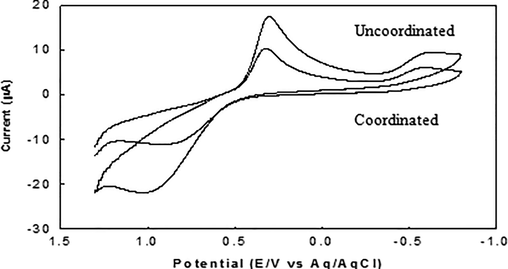
- Voltammograms of Fe (II)/Fe(III) system in the (i) presence (coordinated) of and (ii) absence (uncoordinated) of glycine in hydrochloric acid buffer of pH 2.0.
The half-wave potential is also altered. After interaction, the value of reduction potential achieves less negative value and becomes a stronger oxidizing agent. From the above points together, it may clearly be stated that Fe(II) successfully interacts with glycine and undergoes complexation (Sabbir et al., 2008; Naseem Akhtar et al., 2008).
3.2 pH of maximum interaction of Fe(II) with glycine
The redox behavior of Fe(II)-Glycine (1:1) interaction was observed at pH 1.2, 1.4, 1.6, 1.8, 2.0 and 2.2. Similar to the findings in the case of Fe(II) in the buffer before interaction, it also shows one cathodic and its corresponding anodic peak as well as a second cathodic peak which may be due to the buffer. But at pH 1.2 and 1.6 the anodic peak is absent and a slight humplike shape is formed. This may be due to any obstacle in electron transfer. Again at pH 1.4, 1.8 and 2.0 the peaks are sharper (Zhang and Anson, 1992; Bear et al., 1992).
At pH 2.2, there appears an extra peak or prepeak in the cathodic region. This situation may arise due to the simultaneous existence of coordinated and uncoordinated Fe(II) in the system (Bard and Faulkner, 1986; Bockris and Reddy, 1970). After interaction with glycine, the peak current decreases to a considerable extent compared to the Fe(II) before interaction at almost all the pH values and it is prominent at pH 1.2, 1.6 and 2.2. Table 1 shows that the decrease is maximum at pH 2.2. It means that here the number of electroactive species is the minimum. Therefore, it may be said that at pH 2.2 this Fe(II)-glycine complex formation is feasible (Pavlishchuk and Addison, 2000; Nicholson and Shain, 1964; Kambara, 1954).
| pH | Cathodic peak current after interaction [ipc(ai)] μA | Decrease in Cathodic peak current after interaction [Δipc(ai)] μA | Cathodic peak potential after interaction [Epc(ai) ] V | Anodic peak potential after interaction [Epc(ai) ] V | Peak potential separation after interaction [ΔE (ai) ] V | Half wave potential after interaction [E1/2(ai)] V | Reduction potential [Eo] V (−) |
|---|---|---|---|---|---|---|---|
| 1.2 | 4.582 | 8.632 | 0.3303 | – | – | 0.4353 | – |
| 1.4 | 9.383 | 0.076 | 0.3762 | 0.9098 | 0.5336 | 0.4970 | 0.2668 |
| 1.6 | 6.110 | 9.521 | 0.2959 | – | – | 0.4353 | – |
| 1.8 | 9.820 | 3.669 | 0.3361 | 0.8754 | 0.5393 | 0.4353 | 0.2696 |
| 2.0 | 8.510 | 4.297 | 0.3189 | 0.8697 | 0.5508 | 0.4044 | 0.2754 |
| 2.2 | 5.455 | 10.855 | 0.2787 | 0.7549 | 0.4762 | 0.4250 | 0.2381 |
The value of the peak separation at pH 2.2 is smaller than that for Fe(II) before interaction. It is the smallest value among the studies at six pH values of this interaction. This signifies that after the interaction the Fe(II)/Fe(III) system tends towards the reversible system at this pH value (Glasstone, 2000).
The significant matter is that compared to free Fe(II), the shift in the half-wave potential (E1/2) at all the pH values is towards more positive values (Pavlishchuk and Addison, 2000; Nicholson and Shain, 1964; Kambara, 1954). Compared to the uncoordinated Fe(II), reduction potential achieves a more positive value, which means that Fe(II) co-ordinated with glycine becomes a stronger oxidizing agent. Moreover, among all the pH values, the complexed species of pH 2.2 is the strongest oxidizing agent (Pavlishchuk and Addison, 2000; Nicholson and Shain, 1964).
Considering the above discussions on the peak shape, peak position, complexation capability, peak current, peak separation potential and reduction potential after interaction between Fe(II) and glycine it may be concluded that the pH of maximum interaction for the present interaction is 2.2 (See Table 2).
| Conc. glycine | Cathodic peak current after interaction [ipc(ai)] μA | Decrease in Cathodic peak current after interaction [Δipc(ai)] μA | Cathodic peak potential after interaction [Epc(ai) ] V | Anodic peak potential after interaction [Epa(ai) ] V | Peak potential separation after interaction [ΔEp(ai)] V | Half wave potential after interaction [E1/2(ai)] V | Reduction potential [Eo] V (−) |
|---|---|---|---|---|---|---|---|
| 0.50 | 6.863 | 9.447 | 0.2659 | 1.0074 | 0.7415 | 0.3900 | 0.3708 |
| 1.00 | 5.084 | 11.226 | 0.3246 | 0.9902 | 0.6656 | 0.4162 | 0.3328 |
| 1.33 | 4.579 | 11.731 | 0.3361 | 0.9902 | 0.6541 | 0.4162 | 0.3270 |
| 1.67 | 4.503 | 11.807 | 0.3705 | 0.9443 | 0.5738 | 0.4338 | 0.2869 |
| 2.00 | 5.053 | 11.257 | 0.3533 | 0.9156 | 0.5623 | 0.4425 | 0.2812 |
| 2.33 | 5.368 | 10.942 | 0.3992 | 0.8525 | 0.4533 | 0.4950 | 0.2266 |
| 2.67 | 3.632 | 12.678 | 0.3705 | 0.9156 | 0.5451 | 0.4512 | 0.2726 |
| 3.00 | 3.922 | 12.388 | 0.4049 | 0.8467 | 0.4418 | 0.4688 | 0.2209 |
| 3.33 | 3.632 | 12.678 | 0.3877 | 0.8754 | 0.4877 | 0.4688 | 0.2438 |
| 3.67 | 2.500 | 13.810 | 0.3820 | 0.8754 | 0.4934 | 0.4600 | 0.2467 |
| 4.00 | 2.905 | 13.405 | 0.3475 | 0.9557 | 0.6082 | 0.4338 | 0.3041 |
| 4.33 | 2.368 | 13.942 | 0.3648 | 0.8869 | 0.5221 | 0.4338 | 0.2610 |
| 4.67 | 2.632 | 13.678 | 0.3648 | 0.9500 | 0.5852 | 0.4338 | 0.2926 |
| 5.00 | 2.237 | 14.073 | 0.3246 | 0.9443 | 0.6197 | 0.4075 | 0.3098 |
3.3 Composition of maximum interaction of Fe(II) with glycine
Analysis to study the Fe(II)-glycine complexation criteria, a fixed amount of Fe(II) was mixed with different concentrations of glycine and the pH was maintained at 2.2. All the observations were recorded at scan rate 100 mVs−1. Compared to Fe(II) in the absence of glycine, both the cathodic and anodic peaks become more closer to each other with the increase in ligand concentrations after interaction. It is found that they are at minimum distance when the concentration of glycine is about more than three times with respect to Fe(II). This signifies that the Fe(II)/Fe(III) system is approaching towards reversibility (Barcley and Anson, 1969; Manivel et al., 2007; Gillaspie and Tenent, 2010). The half-wave potential also changes after interaction at different concentrations of glycine. In general, these facts confirm the successful interactions at all the concentrations, but showing highest extent of interaction at some concentrations. This may be due to the formation of more than one species (Pavlishchuk and Addison, 2000; Nicholson and Shain, 1964).
It is observed that with the increase in the concentrations of glycine, the decrease in peak current in the cathodic region, becomes gradually larger, compared to the uncoordinated Fe(II). It remains almost constant at more than one range of ligand (glycine) concentrations. This different regions of constant value in peak current may mean the possibilities of forming different species (Barcley and Anson, 1969; Manivel et al., 2007; Gillaspie and Tenent, 2010).
Measurement of the reduction potential showed something which is very important. With the increase in ligand ratio, the reduction potential, at first goes to most positive value and then it approaches towards more negative values. This also gives the idea of forming more than one species (Barcley and Anson, 1969; Manivel et al., 2007; Gillaspie and Tenent, 2010). From the above considerations and findings, it may be concluded that at pH 2.2, Fe(II) forms more than one species with glycine (Bott and Jackson, 1969; Hertrampf and Olivares, 2004).
3.4 Cyclic voltammetric study of interaction of Fe(II) with aspartic acid
The Fe(II)-aspartic acid interaction exhibits an additional prepeak in the cathodic region, which may be due the co-existence of coordinated and uncoordinated Fe(II) and in the anodic region, there is a humplike shape in place of the peak, may be due to the effect of complexation. The peak current is decreased to a very considerable amount. All these facts give an indication to the successful interaction of Fe(II) with aspartic acid (Bott and Jackson, 1969; Donath et al., 2011; Hertrampf and Olivares, 2004). After interaction the peak in the cathodic region moves towards more positive potential, but the hump in the anodic region towards less positive potential. The half wave potential is also shifted towards more positive potential. All these facts together indicate towards successful interaction (Sabbir et al., 2008; Naseem Akhtar et al., 2008).
3.5 pH of maximum interaction of Fe(II) with aspartic acid
Fe(II)-aspartic acid interaction (1:1) was also analysed at the previously mentioned six pH values. Here the characteristics of the cyclic voltammograms are very much changed with respect to those of Fe(II) before interaction as well as in comparison with the Fe(II)-glycine interaction. The cathodic peaks at almost all the pH values, have been shifted towards more positive potentials and the anodic peaks towards less positive potentials. These shifts in both these cases confirm the formation of Fe(II)-aspartic acid complex in solution (Zhang and Anson, 1992; Bear et al., 1992). At pH 1.6 and 2.2 there are significant anodic peaks. But in other cases it is present as humps. These are similar to Fe-glycine interaction at pH 1.2 and 1.6.
The character of the shift in both the regions is almost similar to that in the Fe(II)-glycine interaction. These shifts confirm the cause of complexation. At pH 1.8 and 2.0 the existence of a hump together with the cathodic peak gives the idea of simultaneous existence of co-ordinated and uncoordinated Fe(II) as well as saying about the proceedings of interaction (Bard and Faulkner, 1986; Bockris and Reddy, 1970).
The peak current measurements show that the decrease in peak current with respect to Fe(II) before the interaction is more or less similar to that of the Fe(II)-glycine interaction and the largest decrease is at pH 1.8. Again the peak potential separation in this case gives the same idea as that for Fe(II)-glycine interaction (Pavlishchuk and Addison, 2000; Nicholson and Shain, 1964). Half wave potential shows the similar points as was found for Fe(II)-glycine interaction. Moreover, it shows a shift towards more positive potentials at all the pH values. At pH 1.6 and 2.2, the reduction potential shows a significant character. Compared to the uncoordinated Fe(II), it achieves a less negative value, which means that Fe(II) co-ordinated with aspartic acid becomes a stronger oxidizing agent (Pavlishchuk and Addison, 2000; Nicholson and Shain, 1964). The above discussions and different parameters may conclude that the pH of maximum interaction for Fe(II)-aspartic acid is 1.8.
3.6 Composition of maximum interaction of Fe(II) with aspartic acid
Study for the investigation of the interaction criteria was also observed using different concentrations of aspartic acid. Similar to the Fe(II)-glycine interaction, the anodic and the cathodic peaks become closer with the increase in the concentration of aspartic acid. This gives a signal toward reversibility of the Fe(II)/Fe(III) system (Barcley and Anson, 1969; Manivel et al., 2007; Gillaspie and Tenent, 2010). Again, it is also not measurable at all the ligand concentrations. The changes in the half wave potentials are almost similar to the fact happened to the Fe(II)-glycine interaction. Both of these happenings confirm about the successful interaction at different ligand concentrations (Barcley and Anson, 1969; Manivel et al., 2007; Gillaspie and Tenent, 2010).
As in the Fe(II)-glycine interaction, the Fe(II)-aspartic acid interaction also exhibits the same trend in the case of peak currents. The decrease in peak current in the cathodic region increases with the increase in ligand concentration and becomes almost constant in a large region of the concentrations of aspartic acid. This means the formation of a group of species. It is also found that in the above mentioned region, the half wave potentials are also almost similar (Manivel et al., 2007; Gillaspie and Tenent, 2010). Similar to the Fe(II)-glycine interaction, the redox potential of Fe(II)-glycine interaction also shifts to the less negative value, which also gives the same conclusion. Therefore, it may be concluded that at pH 1.8, Fe(II) forms a group of species of different compositions with aspartic acid.
3.7 Cyclic voltammetric study of interaction of Fe(II) with proline
The Fe(II)-proline interaction shows a surprising matter. It shows a hump adjacent to a peak in the cathodic region. This happens may be due to the co-existence of coordinated and uncoordinated Fe(II). The peak in the anodic region is absent, which may be due to the greater consumption of Fe(II) by proline. The peak current also drops to a considerable amount after interaction. This may be due to the large extent of interaction (Finar, 1975; Bott and Jackson, 1969; Donath et al., 2011; Hertrampf and Olivares, 2004). The peak position and the half wave potential are also altered after interaction. Both of these parameters are shifted towards the less positive potentials. Again, due to the absence of anodic peak, the peak separation potential and the reduction potential are beyond calculation. These discussions also give a signal towards successful interaction (Sabbir et al., 2008; Naseem Akhtar et al., 2008).
3.8 pH of maximum interaction of Fe(II) with proline
Investigation of Fe(II)-proline interaction (1:1) was also observed at all the previously mentioned pH values. The number and character of the peaks are similar here as those of the above two interactions. At high pH values (2.0 and 2.2), the anodic peaks are absent. Peaks in the cathodic region is sharper at lower pH values (1.2, 1.4 and 1.6). At pH 1.8 the presence of an extra peak gives the same conclusion as those for Fe(II)-glycine interaction at pH 2.2 and for Fe(II)-aspartic acid interaction at pH 1.8 and 2.0, i.e. the simultaneous existence of both the coordinated and uncoordinated Fe(II) (Zhang and Anson, 1992; Bear et al., 1992). Both the anodic and cathodic peaks shift towards less positive potential at higher pH values. But at lower ones, towards more positive potentials (Bard and Faulkner, 1986; Bockris and Reddy, 1970). The peak currents decrease with increasing pH and have the maximum decrease at pH 2.2. Compared to the decrease in peak current with the previous interactions, the decrease in current is found to be maximum in case of Fe(II)-proline interaction (Pavlishchuk and Addison, 2000; Nicholson and Shain, 1964). The peak separation, half wave potential and the reduction potential do not follow any considerable trend compared to the above two interactions (Pavlishchuk and Addison, 2000; Nicholson and Shain, 1964). Therefore, from the point of view of decrease in peak current after interaction, it may be concluded that pH 2.2 is the pH of maximum interaction for Fe(II)-proline interaction.
3.9 Composition of maximum interaction of Fe(II) with proline
Here the analysis for composition study was also done at pH 2.2, where all the other conditions are similar to that of the iron-glycine and iron-aspartic acid interactions. The cathodic and anodic peaks shift and become closer, which are similar to the facts in the previous two interactions. This indicates that the Fe(II)/Fe(III) system is approaching towards reversible process (Barcley and Anson, 1969; Manivel et al., 2007; Gillaspie and Tenent, 2010). But half wave potential does not follow any trend. The decrease in peak current after interaction becomes almost constant in two to three regions of ligand concentrations. This indicates towards the formation of more than one species. The reduction potential is not measurable at most of the ratios, as at some of the ligands concentrations, the anodic peaks are absent. It is also a significant matter that the absence of anodic peaks is found in the vicinity of the above mentioned regions (Barcley and Anson, 1969; Manivel et al., 2007; Gillaspie and Tenent, 2010). Therefore, it may be said that Fe(II) forms more than one species with proline at pH 2.2.
3.10 Chronoamperometric and chronocoulometric study of interaction of Fe(II) with glycine, aspartic acid and proline
Chronoamperometric study of Fe(II) was done in the presence of glycine, aspartic acid and proline. The results show that the spike height after interaction with glycine is decreased. Similar are the cases for both of aspartic acid and proline (David and Gosser, 1993; BAS Epsilon, 2000). Chronocoulometric response shows that the charge at τ is increased after interaction with glycine. The facts in the case of aspartic acid and proline are also same.
But the plots of Q vs t1/2 and -Qr vs θ on the same graph show that both in the presence and absence of glycine, the two plots do not intersect at Q = 0 axis as well as they do not have equal slopes. Therefore, it may be said that in both of these cases adsorption occur. Identical findings were observed in the case of aspartic acid and proline (David and Gosser, 1993; BAS Epsilon, 2000; Naseem Akhtar et al., 2008).
Chronoamperometric study was also accomplished at different pH values for Fe(II)-glycine, aspartic acid and proline interactions. Fe(II)-glycine interaction shows that the height of the current spike is the maximum at pH 1.2 and remains almost constant in the pH range of 1.4–1.8. Finally, at pH 2.0 and 2.2 it shows the lowest height. This means that the rate of electrolysis is lowest at pH 2.2. For Fe(II)-aspartic acid interaction, the current spike height decreases with increase in pH from 1.2 to 1.8 as well as increases from pH 2.0 to 2.2, and is the minimum at pH 1.8. Again for Fe(II)-proline interaction, the current spike is the minimum in the vicinity of pH 2.2 (David and Gosser, 1993; BAS Epsilon, 2000).
The charge response of Fe(II)-glycine interaction was found from the chronocoulometric study. The amount of charge at τ (i.e. at 100 mS) increases with the increase in pH with a small exception at pH 1.2. It achieves the maximum value at pH 2.2. Fe(II)-aspartic acid interaction does not show any unusual character. But at pH 1.6 and 2.0 the amount of charge at τ is the maximum. And in between these values, at pH 1.8, there is a drop in the amount of charge. Again for Fe(II)-proline interaction, the amount of charge at τ at first, gradually increases from pH 1.2 to 1.6. Then after a drop, it again increases from pH 1.8 to 2.2. But as a whole it has the maximum charge at pH 2.2. The plots of Q vs t1/2 and -Qr vs θ on the same graph was also done at all the pH values and for all the three interactions. The plots for Fe(II)-glycine interaction are displayed in Fig. 3.
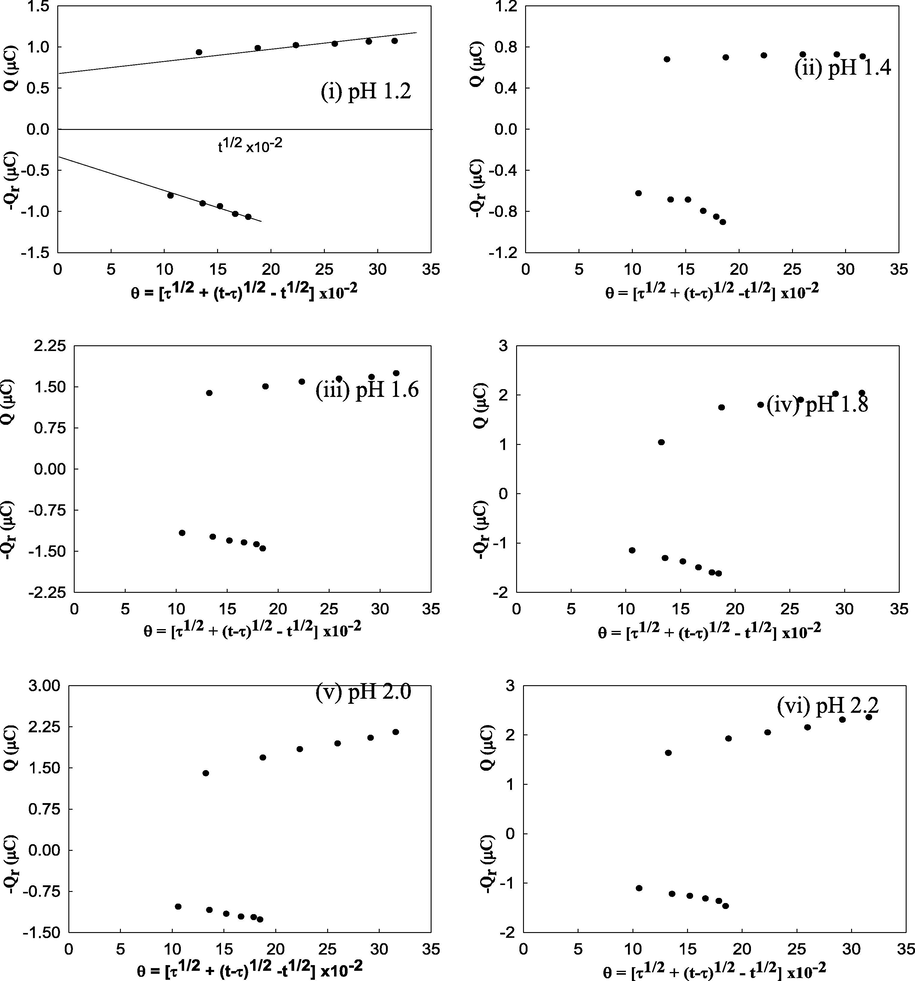
- Plots of Q vs t1/2 and -Qr vs θ for Fe(II)/Fe(III) system in presence of glycine at pH 1.2, (ii) 1.4, (iii) 1.6, (iv) 1.8, (v) 2.0 and (vi) 2.2 in hydrochloric acid buffer.
These show a general qualitative feature at all the pH values. In all the cases the two plots do not intersect at Q = 0 axis as well as they do not have equal slopes. Therefore, it may be said that at all the pH values, adsorption occurs. But at pH of maximum interactions, it seems to be adsorbed to a small extent (David and Gosser, 1993; BAS Epsilon, 2000; Naseem Akhtar et al., 2008). Therefore like the cyclic voltammetric analysis from chronoamperometric as well as from chronocoulometric analysis, it may be said that maximum interaction between Fe(II) and glycine occurs at pH 2.2., between Fe(II) and aspartic acid at pH 1.8 and between Fe(II) and proline at pH 2.2.
4 Conclusion
With the increase in pH for glycine and proline, both the anodic and cathodic peaks shift almost towards less positive potential. But for aspartic acid, the anodic follows the same trend, but the cathodic shows anomalous character. In case of peak separation and half wave potential, all the three amino acids show almost the same character. But the values for the peak separation are highest for proline. Decrease in peak current after interaction follows the same trend for glycine and proline and here it is the maximum at pH 2.2. But anomalous character is found for aspartic acid, which shows a maximum decrease at pH 1.8. In general, the values of decrease are highest for proline. The reduction potentials are almost similar for all the amino acids, but the values are higher for proline. The interactions in case of different ligand concentrations, only glycine, the smallest amino acid shows both the anodic and the cathodic peaks after interaction with iron. But the cyclic amino acid, proline gives anodic peaks only at some concentrations. And aspartic acid does not show any specific character. The peak potential separation is found on the basis of the presence of both the anodic and the cathodic peaks. As a result, it is measurable for Fe(II)-glycine interaction at all the ratios. But for aspartic acid and proline, it cannot be measured in all the cases. The values for half wave potential was found to be the lowest for Fe(II)-proline interaction and highest for Fe(II)-glycine interaction which may be due to the fact that the former amino acid being cyclic and the latter being the smallest one. Fe(II)-aspartic acid interaction gives almost moderate values. The reduction potential is also dependent on the presence of anodic peak. All the three amino acids after interaction with iron give almost similar values for reduction potential. The decrease in peak current after interaction with iron is highest for proline and lowest for aspartic acid. But in all the cases, the decrease in peak current becomes larger with the increase in ligand concentration, which may be due to the larger consumption of Fe(II) by the ligands. An important feature is found in all the three interactions. It is that in all the cases more than one species are formed.
Chronoamperometric analysis shows that Fe(II) after interaction with all the amino acids gives a decrease in spike height, due to the shortage of free electroactive species. Chronocoulometric response shows that in case of Fe(II)-glycine and Fe(II)-aspartic acid interactions the charge at τ is increased, but for Fe(II)-proline interaction, it is decreased in comparison with the Fe(II) in the absence of any ligand. In all the cases adsorption occurs.
Declaration of Competing Interest
The authors declare that they have no known competing financial interests or personal relationships that could have appeared to influence the work reported in this paper.
References
- Chemistry of Organic Natural Products (Volume-1) (18th edition). India: Krishna Prakashan Mandir; 2006.
- The combined adsorption of cadmium(ll) and thiosulfate on mercury. J. Electrochem. Soc.. 1969;116:438.
- [Google Scholar]
- Electrochemical Methods, Fundamentals and Applications. USA: John Wiley and Sons; 1986.
- Surface modification with macrocycle-containing redox-active polymers: towards the design of novel spectroelectrochemical group ia/iia metal cation sensors. Analyst. 1992;117:1247-1254.
- [Google Scholar]
- Modern Electrochemistry. London, UK: Macdonald; 1970.
- Study of ferricyanide by cyclic voltammetry using the CV-50W. Curr. Separa. 1969;15(1):25-30.
- [Google Scholar]
- Physical Chemistry with Applications to Biological Systems. New York, USA: Macmillan Publishing CO, INC.; 1981.
- Advanced Inorganic Chemistry (third ed.). Interscience Publishers; 1972.
- Cyclic Voltammetry (Simulation and Analysis of reaction mechanisms). Wiley-VCH Inc.; 1993.
- Burger’s Medicinal Chemistry and Drug Discovery (Volume-3) (sixth ed.). USA: John Wiley and Sons, Inc; 2003.
- Cyclic voltammetry of Iron ions in molten halides electrolytes. Rev. Roum. Chim.. 2011;56(8):763-769.
- [Google Scholar]
- Finar, I.L., 1975. Organic Chemistry (Volume-2). 5th edition, Longman group limited.
- An introduction to Electrochemistry, 10th printing, Litton Educational Publishing. USA: INC; 2000.
- Metal-oxide films for electrochromic applications: present technology and future directions. J. Mater. Chem.. 2010;20:9585-9592.
- [Google Scholar]
- Introduction to Modern Inorganic Chemistry. Dhaka, Bangladesh: Friends International; 1994.
- Instruction manual for BAS Epsilon for electrochemistry, 2000. Bioanalytical Systems, Inc. USA.
- Polarographic diffusion current observed with square wave voltage. II. BASIC theory for a reversible electrode. Chem. Soc. Jpn.. 1954;27:527-530.
- [Google Scholar]
- Medium effects on the electro-deposition of MnO2 on glassy carbon electrode: a comparative study in alkane, perfluoro alkane carboxylic acids and methanesulphonic. Acid. 2007;52(28):7841-7848.
- [Google Scholar]
- Cyclic voltammetric study of the redox behavior of Fe(II)/Fe(III) systems forming during the oxidation of Fe(II) complexes with saccharin and with saccharin and 1,10-phenanthroline. Russian J. Elect. Chem.. 2008;44(12):1504-1509.
- [Google Scholar]
- Theory of stationary electrode polarography: single scan and cyclic methods applied to reversible, irreversible, and kinetic systems. Anal. Chem.. 1964;36:706.
- [Google Scholar]
- Conversion constants for redox potentials measured versus different reference electrodes in acetonitrile solutions at 25°C”. Inorg. Chim. Acta. 2000;298(1):97-102.
- [Google Scholar]
- Cyclic voltammetric study on the interaction of ranitidine with iron and copper at glassy carbon, platinum and gold electrodes. Dhaka Univ. J. Sci.. 2008;57(2):193-198.
- [Google Scholar]
- Voltammetry and in-situ Fourier transform IR spectroscopy of two anthraquinone disulfonates adsorbed on graphite electrodes. J. Electroanal. Chem.. 1992;331:945-951.
- [Google Scholar]


