

Electrical resistivity tomography of a gypsiferous subsurface soil: Geotechnical detection of a geoenvironmental phenomenon
⁎Corresponding author. mdafalla@ksu.edu.sa (Muawia Dafalla),
-
Received: ,
Accepted: ,
This article was originally published by Elsevier and was migrated to Scientific Scholar after the change of Publisher.
Peer review under responsibility of King Saud University.
Abstract
The near-surface soils are generally exposed to environmental changes and can be influenced by water, humidity, temperature, and other factors related to erosion or physical changes. It has been reported that serious distress occurred in the ground surface and below ground for many areas subjected to seasonal weather changes. The gypsum rich material is often linked to the cavity formation, uplift, and cracking of road surfaces due to the high solubility of gypsum in water and acidic media. Electrical resistivity techniques along with the advanced method of identifications (Scanning electron microscope; SEM and X-ray diffraction: XRD) were utilized to detect cavities and gypsum rich subsurface soils. A site where many cavities were formed as a result of dissolving gypsum and anhydrite was considered for this study. Syscal R1 electrical resistivity equipment (IRIS instrument) was used for several cross-sections established within the site. Several electrical resistivity tomography lines were constructed and studied. The SEM (scanning electron microscope) was used to examine and compare forms and fabrics of gypsum and minerals containing sulfates. The chemical analysis (EDAX) using an electron beam was conducted to establish elements present within tested samples. Quantitative chemical tests for some parameters including sulfate ions were carried out. A prediction model based on statistical correlations between sulfate ion content and the electrical resistivity is presented. Electrical resistivity is found to be inversely proportional to the sulfate content for concentrations of 0 to 5%.
Keywords
Electrical resistivity
Gypsum
SEM
Geoenvironmental
Soil

1 Introduction
Gypsiferous soils are deposits that contain gypsum (CaSO4·2H2O) and are considered very problematic in supporting foundations due to their level of solubility in water and the significant effects on the overall geotechnical properties that govern soil-structure interactions.
It is claimed that an area of about one million square kilometres worldwide include deposits rich in gypsum and gypsiferous soil (Verheye and Boyadgiev 1997). The Saudi building code SBC 303 (2007) addressed collapsing soils as a main hazardous supporting ground. The wide occurrence of gypsiferous soils in the Middle East was reported by many researchers (Fooks and French, 1977; Tomlinson, 1978; Razouki and Kuttah, 2004; Ahmed, 2013; Aqeel, 2016).
The gypsum or gypsiferous soils were frequently observed within bedded limestone and dolomite formation (Blight, 1976). The gypsum content in soil can be a serious issue depending on the exposure and environmental conditions (Razouki and El-Janabi, 1999). Collapsible soils are soils that lose cementation when inundated. Gypsiferous soils are collapsing due to dissolution and dissolved material being washed away. The gypsiferous soils show a large reduction in void ratio under a low level of stress upon wetting (Ahmed, 2013). Collapse as measured using ASTM D 5333–03 refers to the decrease in the height of a confined soil on inundation or adding water. This process is mechanical and does not inform about the chemical reaction and progress of deterioration of gypsum rich soils. On heating gypsum to 40 °C it will start losing water molecules and becomes free of water at 70 °C and this stage, it is known as anhydrite (CaSO4). Anhydrite can also become gypsum when gaining water, but with excessive volume change. Puppala et al. (1999) claimed that expansion in some of the expansive soils may be attributed to the high content of sulfate.
Using electrical resistivity to assess chemical content in a subsoil material is not new. The electrical resistivity was used in evaluating bentonite content in soil bentonite mixtures (Abu-Hassanein, 1996). The technique is also utilized in the assessment of vadose zone flow models (Binley et al., 2002). Samouëlian et al. (2005) provided a very good reference on the electrical resistivity measurements of soil material. A comprehensive study presented by Rhoades et al. (1989) covered the accuracy of models that determine the soil salinity in the field using the measurements of electrical conductivity. The works of Osman and Harith (2010) investigated the trends of the electrical resistivity with some geotechnical parameters, namely; moisture content, friction angle, bulk density, and standard penetration tests.
The electrical resistivity was also used to identify the gypsum deposits interlayered with other soils or formations (Guinea et al., 2009). The electrical resistivity values for gypsum vary according to impurities and other materials intermixed with gypsum. A range of 80 to 1000 O.m for deposits including gypsum and lutites was quoted by Lugo et al. (2008).The lower ranges of electrical resistivity can be in the order of 10 to 24 Ωm. This is likely attributed to unconsolidated sediments. For massive gypsum and pure anhydrite, the electrical resistivity value can exceed 1000 Ωm. Works of Dafalla Alfouzan (2012) found that magnesium, sulfate content, calcium, and sodium have a significant influence on the measured electrical resistivity values and introduced preliminary models to predict electrical resistivity from soil density and chemical constituents. Geo-electrical studies were used in the evaluation of the pollution concentration level within landfill subsoil and various characterizations works (Koda et al., 2017; Oyeyemi et al., 2017). Moghal et al (2020a, 2020b) stated that the variations in electrical conductivity is related to the compression behavior Moghal et al (2020a, 2020b) also studied the behavior and strength of calcium based derivatives and the lime leachability.
The application of the two-dimensional electrical resistivity tomography (2D- ERT) is becoming very wide and covering different fields. This included fields like the determination of cadmium in Cacao Crop Soils (Bravo and Benavides-Erazo, 2020). This study covers only the influence of gypsum content out of many intrinsic and extrinsic factors that may affect the electrical resistivity. This paper presents the results of a study carried out for a gypsiferous soil formation, located at a site in the central part of Saudi Arabia. The study included advancing four boreholes (4) and three (3) shallow test pits as shown in Fig. 1. A series of near-surface cavities and openings were reported within the top 2 m below the ground level. The main objective of the study was to utilize electrical resistivity along with geotechnical and chemical tests to predict zones of gypsiferous soils and possible cavities within a site. Fig. 2(a) presents a typical test pit profile (Test Pit 1) while Fig. 2(b) presents a generalized soil profile.
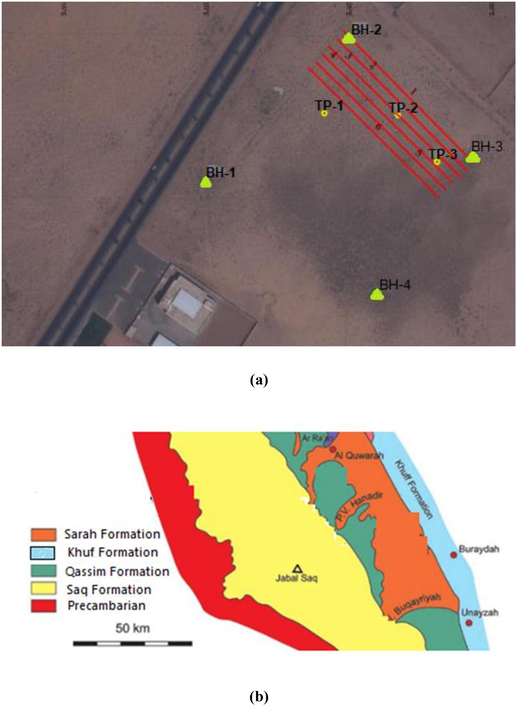
- (a) Satellite image indicating test pits, boreholes, and electrical resistivity lines. (b) Simplified geological map of the Qassim district, modified after Vaslet (1990).
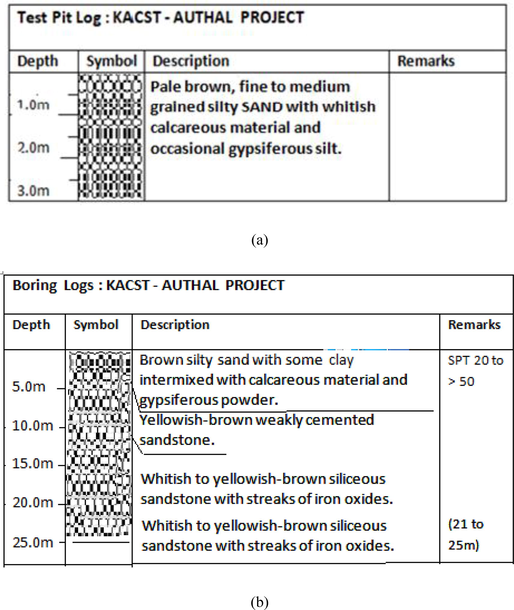
- (a) A typical test pit profile (Test Pit 1); (b) Generalized soil profile.
2 Materials and testing methods
2.1 Materials
The material used in this study is limited to the subsurface material encountered on the site. The top layers consist of brown silty sand with some clay, intermixed with calcareous materials, and gypsiferous powder. The top layers extend to a depth of 3 m to 8 m below ground level. The top layers are underlain by yellowish-brown to pale yellow weakly cemented sandstone. Geotechnical properties of the subsurface soil material were examined. Grain size distribution tests, moisture content, dry unit weight, specific gravity, and Atterberg limits were carried out. The grain size parameters (Fig. 3) indicated 10 %, 30 % and 60 % material passing through sieves correspond to diameter sizes of 0.17 mm, 0.2 mm and 0.51 mm respectively. (D10 = 0.17, D30 = 0.2 and D60 = 0.51). Coefficient of Uniformity; Cu = D60 / D10 = 3; Coefficient of Curvature; Cc = (D30)2 / (D10 × D60) = 0.509. The specific gravity was measured as 2.65. All samples were of low plasticity or non-plastic.
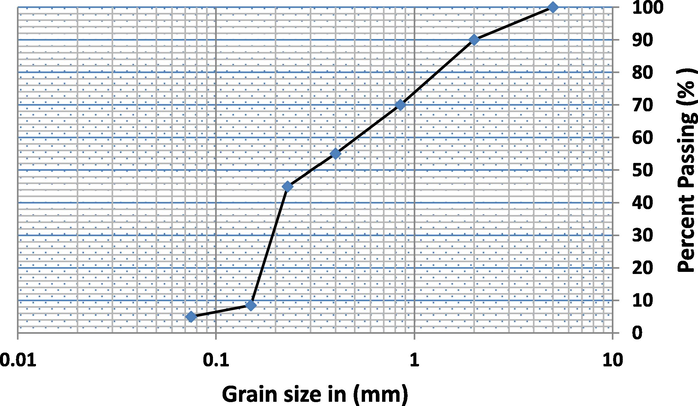
- The grain size distribution of a gypsum rich sample (TP-1).
These physical and mechanical properties present a little indication of the nature and likely behavior of the material. Further tests to inspect the cementation and collapse potential were carried out. Sulfate content tests for selected 15 samples were conducted. The use of acid extraction and barium chloride solution can obtain barium sulfate and then allows determination of sulfate gravimetrically. A test pit near a zone suspected of high gypsum content was selected and presented as a typical material for the suspected gypsiferous soil within the site. Advanced examinations were conducted for Test pit 1.
2.2 Electrical resistivity tomography
In electrical resistivity tomography tests, a direct current is allowed to penetrate the subsurface ground by two electrodes while the other two electrodes are used to measure the voltage at a certain depth.
The electrical resistivity equipment utilized for this study is Syscal R1. The system is supplied with 72 electrodes and is capable of producing two-dimensional sections. The manufacturer of the system stated that the output current is automatically adjusted (automatic ranging) to optimize the input voltage values and thus provide a high-quality measurement. Such systems can be useful in many applications, including salinity control, depth-to-rock determination, and weathered bedrock mapping. It can also be used to determine shallow groundwater conditions (aquifer depth and thickness). Electrodes spacing can be varied up to 10 m, however, in this study 6 2D electrical resistivity tomography profiles were applied with 177 m total length and 3 m electrode spacing as the study targeting the shallow subsurface layers. The system is also capable of transferring data to the computer and can be processed using specially tailored software (Res2DInv).
2.3 Collapse potential tests
The gypsum rich soils lose strength when subjected to prolonged wetting. One of the methods to detect the collapse potential is the American standard testing method (ASTM D5333-03, 2003). The procedure for this test is conducted using one dimensional oedometer. The sample was placed on the cell and loaded dry in stages to 300 kPa. Subsequently the sample is wetted to evaluate the collapse potential at this pressure. l.
2.4 Advanced testing
The advanced testing program included direct viewing of the material using SEM (scanning electron microscope) to high magnifications. The fabric features of the air dried tested samples at magnifications ranging from 100 to 20,000 enabled a clear view of the subsurface material constituents. SEM examinations were conducted in King Abdulaziz City for Science and Technology laboratories. A high-resolution instrument operated at 5 to 10 kV was used for imaging. All samples were air dry prepared. Hard samples dd not require chemical treatment or fixation to stabilize the structure.
Several micrographs were obtained and a few were selected as representatives of the tested samples. The SEM viewing helped to see the structure of the site gypsiferous soil at high magnifications and was compared to well-known forms and composition of gypsum material.
The equipment is linked with an EDAX system. This system is based on the concept of using X-ray energy to cause electrons to move from an adjacent orbit to a k-orbit. Limited areas were examined for the occurrence and quantities of specified elements.
X-ray diffraction tests (XRD) tests were also carried out on the mineralogical composition. In this test, the radiation was produced using a Cu target (copper) at a voltage of 40 kV and a current of 30 mA. Constituents of tested samples can be established based on a comparison of the peaks of known minerals.
2.5 Chemical tests
Chemical tests were considered to find the concentration of sulfate content for selected 15 samples taken from 15 different locations of measured electrical resistivity. Many sulfate salts are highly soluble in water with few being poorly soluble including calcium sulfate. Table 1 presents the sulfate contents as measured for the selected samples.
| No. | Resist. (ρ) ohm.m | SO4-2 (%) |
|---|---|---|
| 1 | 8 | 4.5 |
| 2 | 12 | 4.6 |
| 3 | 5 | 4.7 |
| 4 | 8 | 4.8 |
| 5 | 66 | 0.45 |
| 6 | 52 | 0.45 |
| 7 | 16.5 | 0.01 |
| 8 | 15 | 0.3 |
| 9 | 40 | 4.6 |
| 10 | 64 | 0.6 |
| 11 | 110 | 1.2 |
| 12 | 71 | 0.01 |
| 13 | 17 | 0.66 |
| 14 | 61 | 0.12 |
| 15 | 60 | 3.4 |
3 Results
3.1 Identification tests materials
The identification tests conducted confirmed a poorly graded silty sand material. These results are in agreement with the general subsurface profile described in Fig. 2. The material is generally non-plastic but intermixed with gypsiferous powder and calcareous material. Slight cementation can be felt in top layers until some weakly cemented sands and sandstone is reported below the silty sand. Fig. 3 presents a grain size distribution for a gypsum rich sample from Test pit 1.
3.2 Electrical resistivity tomography tests
The electrical resistivity tests conducted on-site for six lines are presented in Fig. 4. The length of each line is 177 m and placed parallel to each other with a 3 m interval. Program electre2 was used to prepare a sequence for input into Syscal R1. By the end of collecting data, all field information was entered into the computer using Prosys 2. Res2DINV program was used to process the data and present the final models. The profile of the electrical resistivity is shown using colour code where dark blue, blue, light blue, green and light green indicate a low resistivity varying from as little as less the 1 Ω meter to 20 Ω m. Dark green, yellow, brown and red represent electrical resistivity of 20 to more than 300 Ω m. For precise colour shades and corresponding electrical resistivity see Fig. 4. Results for line 1 indicate low resistivity (of the order of 5 Ω m) for the top 6 m indicating loose to medium dense sand. Extra cemented sand is observed below 7 m depth. Results for lines 2, 3, 4, 5, and 6 indicated similar results to line 1 with a noticeable increase at 7, 8, 10, 6, and 9 m depth respectively. It worth noting here that Guinea et al (2010) reported very high resistivity values for gypsum deposits where the sulfate content is extremely high. Studies in the literature indicated variable trends for the electrical resistivity. A recent work conducted by Bhamidipati and Kalinski (2020) indicated that resistivity increased with decrease in moisture, but it did not vary significantly with gypsum content. The sulfate deposits can be gypsum or anhydrite. The difference between the two is presence of two water molecules in gypsum but the anhydrite is only calcium sulfate. The anhydrate is more soluable in water than the gypsum. The electrical resistivity trends can differ between different gypsum deposits due to many other factors which include the water content, the chemistry of other substances within the soil and the density of the formation. In order to overcome these differences it is suggested to calibrate the electrical resistivity for each site for the gypsum content by taking samples and perform a simplified correlation study as presented in this research.
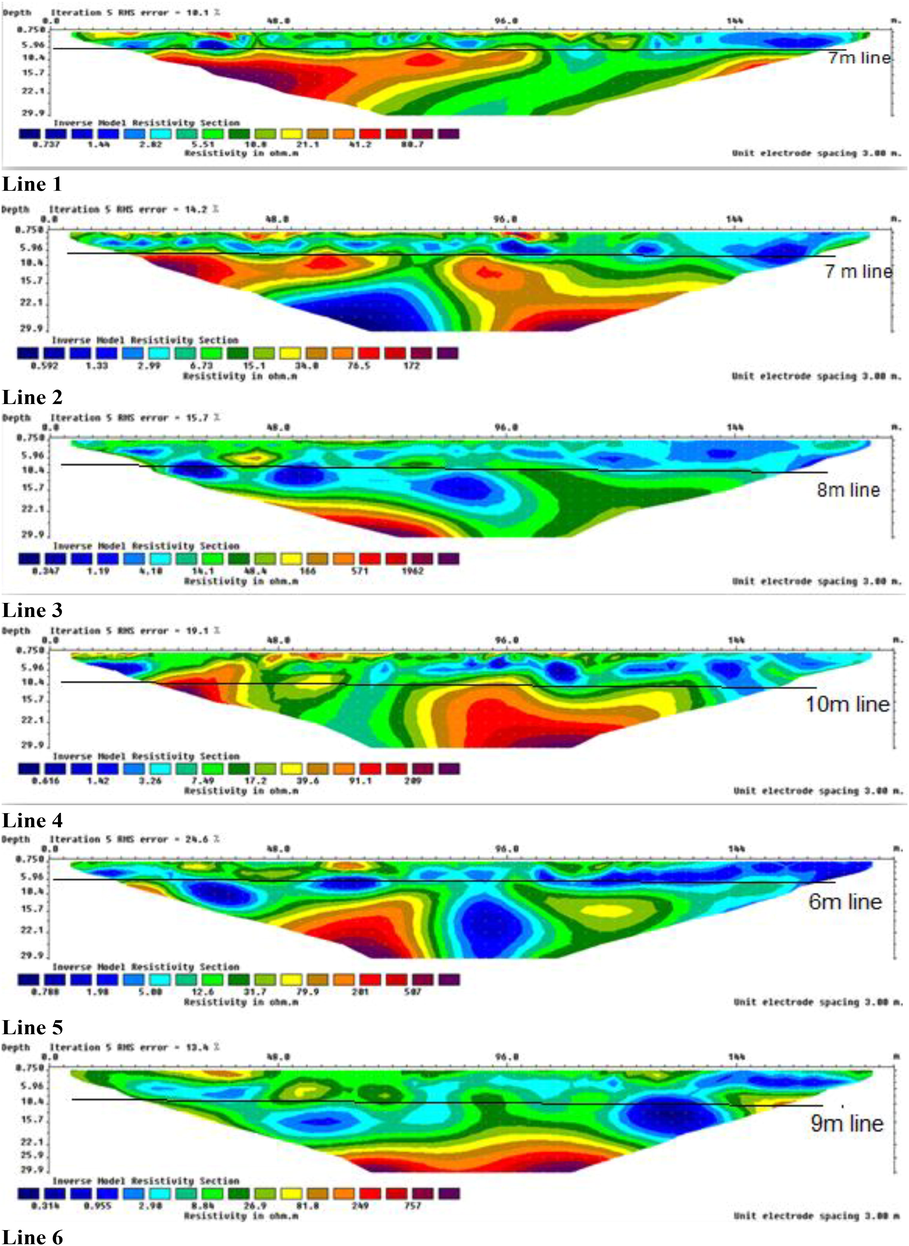
- 2D inverse model resistivity for six lines across the site.
The electrical resistivity lines can cover vast areas and can be useful in predicting areas with higher concentration of gypsum. This study is aimed at shallow depth investigation for gypsum rich zones. The average depth lines given in Fig. 4 present the depth that is likely to have cavities.
3.3 Collapse potential test
The gypsum rich soils are prone to collapse on wetting, therefore a collapse potential test (ASTM D5333) as carried out for a selected sample from Test pit 1 at 2 m depth. The sample was allowed to consolidate under no surcharge and natural moisture content conditions. At a surcharge pressure of 300 kPa, the cell is inundated with distilled water. The collapse at 300 kPa yielded a value of 6.3 % as presented in Fig. 5. Beyond 300 kPa the compressibility is almost near up to 1300 kPa stress. A plastic strain is observed on the removal of stress to 100 kPa.
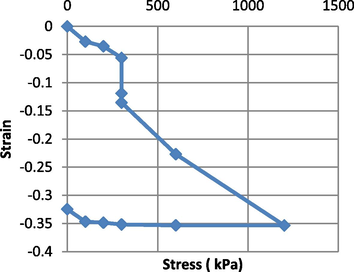
- Compression test indicating collapse potential at 300 kPa stress (Moisture content 7.2 %, Dry density 17.20 kN/m3).
3.4 SEM, EDAX, and XRD tests
The SEM view at magnifications of x100, x800, x2000, and × 20000 shows how the gypsum material provides cementation to lumps and aggregations of other particles. The crystalline sharp-edged clear particles can take different forms but are easily distinguished from other neighboring particles. The pores and spaces between particles do not take regular forms and mostly random. Other chemical bonds can exist along with the gypsum and SEM alone is not sufficient to describe the particle to particle bond. Fig. 6 shows views of the gypsiferous material. As can be observed, the gypsum is in crystalline nature taking different shapes and random orientation which is typical to images shown by other researchers. Fig. 7 presents the EDAX results indicating calcium, sulpher and carbon peaks. The XRD peaks reported at 7.54, 4.26, 3.39, 3.33, 3.30, 2.86, 2.68, and 2.09 A˚ are indicative of the minerals present which include quartz, illite, mica, gypsum, and others (Fig. 8).
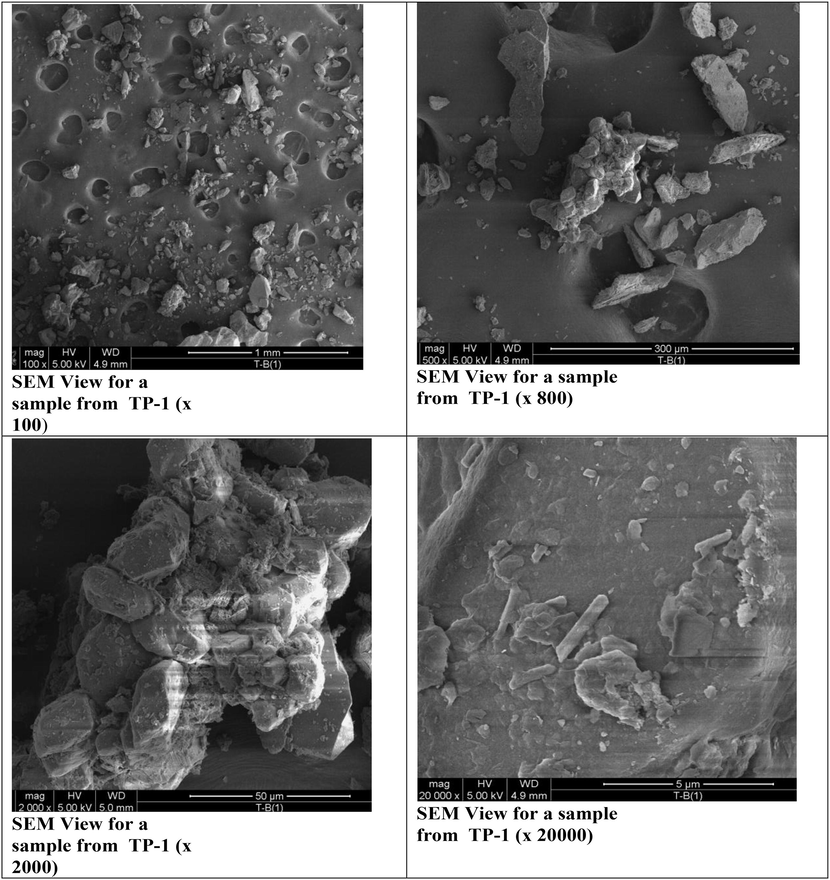
- Views of gypsiferous material from test pit 1.
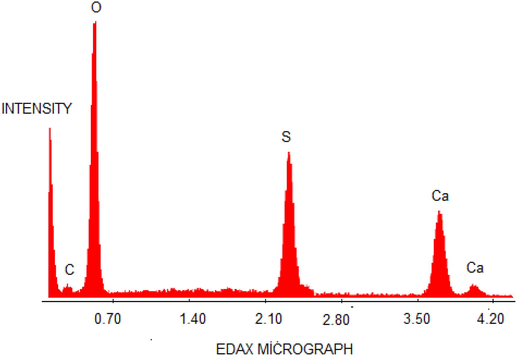
- Micro-structural assessment mode with the EDAX spectrum.
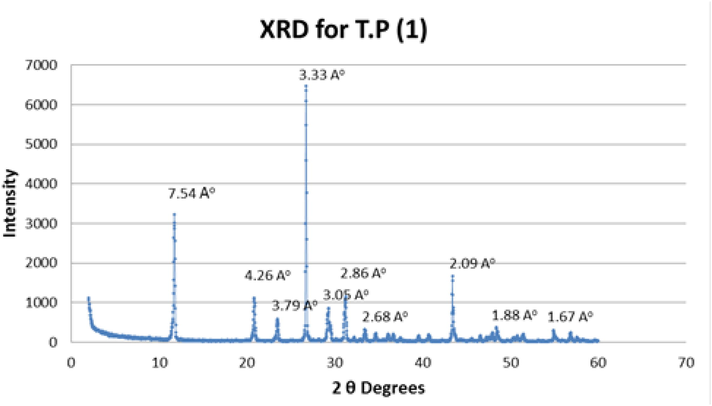
- XRD results for a gypsum rich soil, TP-1.
3.5 Chemical tests results
The samples taken from specific levels corresponding to the measured electrical resistivity were marked from 1 to 15 in Table 1. The sulfate content is tabulated as a percentage.
4 Discussion
The use of conventional site investigation methods are not sufficient to detect the gypsiferous impurities without conducting advanced testing approaches (Asfahani and Mohamad, 2002, Goyal et al. 1996). Visual investigation and observing the color and crystalline forms can be confused for carbonate and calcareous deposits. Low-density material reflected by the standard penetration tests is a good guide to expect gypsum-rich material but the numerous tests needed are expensive. The collapse potential tests are informative as they can quantify the loss of strength due to inundation with water. Electrical resistivity tests are influenced by several factors but can also provide a good survey of soils rich in sulfates.
The influence of moisture is crucial when determining the electrical resistivity. The influence of moisture can be eliminated by comparing electrical resistivity values for a single depth where moisture is likely varying within a very small range. Assuming a uniform moisture level at equal depths within a site can help in making the electrical resistivity imaging a good tool to spot zones of high sulfate contents. This can be carried out by correlating known parts of high gypsum content with measured electrical resistivity. Advanced confirmatory tests including the scanning electron microscope can be used to establish a qualitative investigation and views for gypsum at variable magnifications. These features were observed for samples extracted from the test pit (TP-1). Magnifications of 100, 800, 2000, and 20,000 are shown in Fig. 9.
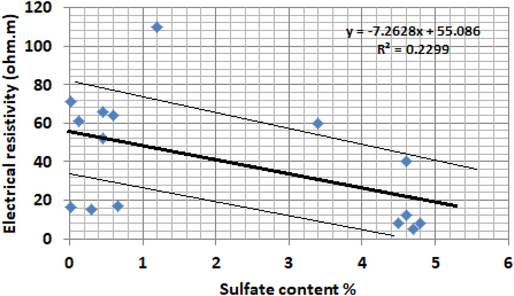
- The general trend of electrical resistivity versus sulfate content.
Correlation factors between electrical resistivity and tested parameters were investigated using the R statistical package. Works of Dafalla and Alfouzan (2012) indicated that soil chemistry influences the electrical resistivity and found that the impact of sulfate content is the highest among anions and cations when compared to aluminum, calcium, iron, magnesium, silicon, sodium, potassium, and chlorides.
The R model team (2011) used in this study considered sulfate content as the only dominant parameter for the tested 15 samples. The obtained model is given below:
x is the sulfate content. The residual standard error is 28.65 on 13 degrees of freedom and multiple R-Squared is 0.23. p-value is 0.0755.
The assumption made here is that other chemical and physical parameters are of negligible effect. This is not true but can be considered satisfactory as the main purpose is to map zones of high gypsum content. This level of accuracy is reflected by the low correlation factor obtained. The model equation can be improved by testing materials of similar physical conditions and chemistry, and then a better correlation factor can be obtained. The authors encourage more research in this area to develop an efficient approach to predict the sulfate content based on electrical resistivity tests. For any site, a simple prediction model can be established. The model can estimate the areas of high collapse potential and sulfate content based on the electrical resistivity mapping.
An alternative method using the standard penetration test to check the in-situ density is also reliable but conducting numerous tests throughout the site is not practical and will add to the site investigation budget. The use of electrical images can point out the zones of low resistivity which are likely to be similar to gypsiferous deposits. Fig. 9 presents the trend of electrical resistivity versus the sulfate content. SEM viewing supported with EDAX as well as the XRD tests are valuable tools and introduced for identification purposes. Comparing features and fabrics in a close-up view will show the crystalline nature and formed gypsum (Azam et al., 1998; Jordon et al., 1991). Jordon et al. (1991) introduced a method to differentiate between gypsum and Anhydrite in the SEM by using a backscattered electron-signal.
The EDAX investigation showed dominant calcium elements, silicon, sulfur, and carbon. Quantitative analysis based on EDAX cannot be reliable as the view is unlikely representative of the tested sample. The XRD indicated the presence of quartz, feldspar, and gypsite minerals. Many other minerals in which sulfur and calcium are a component for example, the clay minerals; kaolin and illite. Practicing engineers need to examine the mineralogy of the subsoil when cavities are encountered in order to assess the possibility of further solubility that may take place.
5 Conclusions
The conclusion drawn from this study is that the electrical resistivity tomography can be utilized to predict zones of high gypsum content. These are associated with low electrical resistivity. The obtained results showed that the electrical resistivity is reduced by the increase in sulfate content. The results showed a reasonable trend that can be improved if all chemical constituents are known. Electrical resistivity is found inversely proportional to the sulfate content for concentrations of 0 to 5 %. For the general survey, electrical resistivity mapping can be a useful tool. The electrical resistivity tests can provide information on open cavities if available within a site. This geophysical technique can be recommended alongside the geotechnical investigation works to provide a wider mapping and site coverage. Chemical and advanced testing methods including SEM, EDAX, and XRD are required for identification purposes to confirm the presence of minerals within the subsurface soils.
Author contributions
The entire work was conceptualized by M.D. and F.A. Experimental and Fieldworks including electrical resistivity measurements were conducted by F.A. Experimental studies and mineralogical tests were conducted by M.D. using the facilities available to King Saud University and King Abdulaziz City for Science and Technology. Funding acquisition for the works and literature survey were jointly arranged by M.D. and F.A. Analysis, drafting of the manuscript, and conclusions were jointly prepared by M.D. and F.A. All authors have read and agreed to the published version of the manuscript.
Funding
Deanship of Scientific Research at King Saud University. Grant reference: Vice Deanship of Scientific Research Chairs, BRCES.
Acknowledgments
The authors are grateful to the Deanship of Scientific Research, King Saud University for funding this study through Vice Deanship of Scientific Research Chairs.
Declaration of Competing Interest
The authors declare that they have no known competing financial interests or personal relationships that could have appeared to influence the work reported in this paper.
References
- Determining bentonite content in soil–bentonite mixtures using electrical conductivity. Geotech. Testing J.. 1996;19:51-57.
- [Google Scholar]
- Effect of gypsum on the hydro-mechanical characteristics of partially saturated sandy soil. Cardiff University; 2013. Ph.D. diss
- Investigation of expansive soils in Obhor Sabkha, Jeddah-Saudi Arabia. Arabian J. Geosci. 2016
- [CrossRef] [Google Scholar]
- Geo-electrical investigation for sulphur prospecting in Teshreen Structure in Northeast Syria. Exploration Mining Geol.. 2002;11:49-59.
- [Google Scholar]
- ASTM D5333-03, 2003. Standard Test Method for Measurement of Collapse Potential of Soils, ASTM International, West Conshohocken, PA, 2003, http://www.astm.org.
- Expansive characteristics of gypsiferous/anhydritic soil formations. Eng. Geol.. 1998;51(2):89-107.
- [Google Scholar]
- Bhamidipati, R.A., Kalinski, M.K.M., 2020. Geotechnical and electrical resistivity properties of gypsum rich sands. In: Advances in Computer Methods and Geomechanics. DOI: 10.1007/978-981-15-0890-5_59.
- Vadose zone flow model parameterization using cross-borehole radar and resistivity imaging. J. Hydro.. 2002;267:147-159.
- [Google Scholar]
- Migration of Subgrade Salts Damages Thin Pavements. Transport. Eng. J. ASCE. 1976;102:779-791.
- [Google Scholar]
- The use of a two-dimensional electrical resistivity tomography (2D-ERT) as a technique for cadmium determination in cacao crop soils. Appl. Sci.. 2020;10:4149.
- [CrossRef] [Google Scholar]
- Saudi Building Code SBC-303, 2007. Soils and Foundations. Saudi Building Code National Committee, Riyadh, Saudi Arabia.
- Influence of physical parameters and soil chemical composition on electrical resistivity: a guide for geotechnical soil profiles. Int. J. Electrochem. Sci.. 2012;7:3178-3190.
- [Google Scholar]
- Soluble salt damage to surfaced road in the middle east. The Highway Engineer, J. Institution Highway Engineers. 1977;24(11):10-20.
- [Google Scholar]
- Estimation of temporal changes in soil moisture using resistivity method. Hydro. Proces.. 1996;10:1147-1154.
- [Google Scholar]
- Guinea A., Playà E., Rivero L., Himi M., 2009. Importance of gypsum purity in electric imaging. 15th Near Surface meeting, Dublin, Ireland, Expanded Abstracts, P08.
- Guinea et al., 2010. Electrical resistivity tomography and induced polarization techniques applied to the identification of gypsum rocks June 2010 Near Surface Geophysics 8 (1730), DOI: 10.3997/1873-0604.20100095.
- Gypsum-anhydrite differentiation by SEM using the back-scattered electron-signal. J. Sedimentary Res.. 1991;61(4):616-618.
- [CrossRef] [Google Scholar]
- Application of electrical resistivity data sets for the evaluation of the pollution concentration level within landfill subsoil. Appl. Sci.. 2017;7:262.
- [CrossRef] [Google Scholar]
- Aplicación de la tomografía eléctrica a la prospección de formaciones evaporíticas. Geogaceta. 2008;44:223-226.
- [Google Scholar]
- Effect of heavy metal contamination on the compressibility and strength characteristics of chemically modified semiarid soils. J. Hazardous, Toxic, Radioactive Waste. 2020;24(4):04020029.
- [Google Scholar]
- Effect of calcium-based derivatives on consolidation, strength, and lime-leachability behavior of expansive soil. J. Mater. Civ. Eng.. 2020;32(4):04020048.
- [Google Scholar]
- Syed Osman, S.B., Tuan Harith, Z.Z., 2010. Correlation of electrical resistivity with some soil properties in predicting factor of safety in slopes using simple multi Meter. UTP Institution repository. University Teknologi Petronas, ID Code 5649.
- Subsoil characterization using geoelectrical and geotechnical investigations: implications for foundation studies. Int. J. Civ. Eng. Technol. (IJCIET). 2017;8(10):302-314. Article ID: IJCIET_08_10_031
- [Google Scholar]
- Puppala, A.J., Hanchanloet, S., Jadeja, M., Burkart, B., 1999. Sulfate induced heave distress: a case study. In: Proceedings, Transportation Research Board Annual Meeting, Washington, DC.
- R Development Core Team, 2011. R a language for statistical computing. R Foundation for Statistical Computing, 2011 http://www.R-project.org.
- Decrease in the CBR of a gypsiferous soil due to long-term soaking. Q. J. Eng. Geol. Hydrogeol.. 1999;32:87-89.
- [Google Scholar]
- Effect of soaking period and surcharge load on resilient modulus and California bearing ratio of gypsiferous soils. Quart. J. Eng. Geol. Hydrogeol.. 2004;37:155-164.
- [Google Scholar]
- Estimating soil salinity from saturated soil-paste electrical conductivity. Soil Sci. Soc. Am. J.. 1989;53:428-433.
- [Google Scholar]
- Electrical resistivity survey in soil science: a review. Soil Tillage Res.. 2005;83:173-193.
- [Google Scholar]
- Evaluating the land use potential of gypsiferous soils from field pedogenic characteristics. Soil Use Manag.. 1997;13:97-103.
- [Google Scholar]


