

Translate this page into:
Effects of BRT®Ever Green and Aqua Perla as substrate improvement agents on vegetative growth, yield, and nutrient of lettuce (Lactuca sativa L)
⁎Corresponding authors. Mohammed.Omer.Mustafa.Mohammed@phd.uni-mate.hu (Mohammed Mustafa), Hiwa2009@yahoo.com (Hiwa M. Ahmed) hiwamuhsinahmed@gmail.com (Hiwa M. Ahmed)
-
Received: ,
Accepted: ,
This article was originally published by Elsevier and was migrated to Scientific Scholar after the change of Publisher.
Peer review under responsibility of King Saud University.
Abstract
Objectives
Lettuce (Lactuca sativa L.) is an important vegetable in which cultivation management includes substrate characteristics that influence its quality and nutritional value. In this study, the effects of substrates on lettuce growth, yield, and nutrient content were evaluated grown in two different locations.
Methods
The experiment was set up in two experimental locations. For this experiment, there are 3 types of substrates were used namely BRT® green moss; DCM Aquaperla®; Floresca (substrate). Plant growth yield, chlorophyll content, and N P K content in a lettuce leaf and root were measured.
Results
Results showed that lettuce was grown in the Soroksar area with Florasca (F) + 20% treatment, and in the University area with F + 30% treatment showed the highest lettuce fresh weight (401.30 g, 5.78 mg). Lettuce leaves and roots treated with F + 30% and F% had the highest dry matter content respectively, the chlorophyll content of the lettuce leaves ranged from (362–855 mg/100 g) for F + 20% BRT and F + 30% BRT respectively. Plants treated with F, F + 10%, and F + 20% displayed a direct relationship where decreasing chlorophyll content resulted in decreasing SPAD values. Nutrient contents of leaves showed higher content of (N) nitrogen (48 mg/g) F%, (K) potassium (33.3 mg/g) F%, and (P) phosphorus (7 mg/g), F + AP % treated, in Soroskar. 13 Meanwhile, (N) F%, (K) F + 10% BRT, and (P) F + AP treated had the highest content when lettuce. was grown at the University. Regarding NPK content in roots, P content in Soroskar was treated 15 with F + AP and in the University, N (F, F + 20%), P (F + AP) had higher content. A positive 16 relationship trend between N content and SPAD was observed to be consistent.
Conclusions
In this perspective, where plant growth was largely not affected negatively by the treatments, it can be concluded that the use of substrate additives in/for lettuce production can be acceptable.
Keywords
Lettuce
Additive substrate BRT
NPK content

1 Introduction
Lettuce (Lactuca sativa L.), is an annual plant native to the Mediterranean area (Hernandez et al., 2015) and belongs to the Asteraceae or daisy family (Ning et al., 2019; Ndiaye, 2009). It is often grown as a vegetable for its leaves that are eaten raw or cooked, but its production package is not much known to popular farmers in general (Kuang et al., 2008). In terms of the production of lettuce, substrates are considered to be an important agent (Auler et al., 2015). In addition, the media or substrate is a porous medium consisting of mineral, organic or artificial materials (Schmilewski, 2008), which have great differences in their properties. The substrate used in the cultivation of seedlings of lettuce is important in seed germination and establishment (Islam et al., 2003; Ferrarezi and Testezlaf, 2016), as well as in improving crop yield and quality in lettuce production in areas with limited labor force or with high air temperatures and lower environmental pollution (Ferrarezi and Testezlaf, 2016). Along with a high-quality growing medium capable of providing optimal growing conditions, various additives to growing mixtures were used, including super absorbents (e. g. hydrogels or superabsorbent polymers), which are synthetic substances and water-insoluble polymers capable of retaining water within their structure (Ngobeni et al., 2007; Viztiu et al., 2014). It has been largely utilized during the last decades among different plant species including, cotton, oats, onion, watermelon, salvia, maize, potato, European beech, Norway spruce, and Scots pine (Savi et al., 2014; Faried et al., 2014). According to the Radó-Takács (Radó-Takács, 2016) study, it was shown to be useful in terms of moisture conservation and cost savings associated with agricultural irrigation. Specifically, on ornamental crops, bio-stimulators have played an important role, such as inhibiting or stimulating growth, controlling flowering, and enhancing stress tolerance.
Newly discovered substrates such as (improvement) agents, of Finnish BRT® Ever Green and Fain Bio Activator (FBA), are currently being employed and extensively studied to understand their impacts on various ornamental crops. BRT® Ever Green is an absorbent material constructed of methylene-urea resin that can retain up to 90% of its volume in water, as well as nutrients and fertilizers, before gently and efficiently releasing them for plant consumption. It releases nitrogen and phosphate fertilizer in a controlled manner. This substance also supplies more oxygen to roots to help them flourish. The recommended concentration for this soil amendment product is 10% to 30% (Kohut et al., 2016). The amount of irrigation required in the cultivation is predicted to decrease by integrating this into the growing media. Similarly, DCM Aqua Perla® is a substrate whose aim is to improve moisture and nutrient retention. It is a granule form of a 100 % perfect pure anionic polyacrylate and polyacrylamide polymer that can store up to 5–600 times its weight. It also helps with the formation of strong roots, a more vigorous plant, and greener foliage (Kohut et al., 2016).
BRT®EverGreen which is a lightweight substrate additive was developed by BRT Ltd to replace up to 30% of the total weight of pure peat. Additionally, the product was created to improve the growth media's water-holding capacity and nutrient absorption, according to related studies (Allaire et al., 2005). However, BRT® Green Moss growth media has a beneficial effect on the soilless environment that may utilize it. It is a brand-new growth medium that is organic, sustainable, and entirely recyclable (Radó-Takács, 2016; Allaire et al., 2005; Tilly-Mándy et al., 2016). However, the research is essential to understanding the potential and significant impact of BRT® on the environment and food crop production. Thus, the objective of this study is to measure the effects of substrate on germination, vegetative growth, and yield to determine optimal doses of substrate for the growth and development of lettuce.
2 Material and methods
2.1 Experiment location and plant material
The experiment was set up in two different places: The first experiment was carried out from (January to March 2018), in a greenhouse at Szent Istvan University, Department of Vegetable Growing Budai campus, Lettuce was grown in a glasshouse with an environmental Control Model. The effective capacity of this glasshouse is (Width “W” x Depth “D” x Height “H”) measuring, 5*10 square meters, with interior dimensions of (WxDxH). It had 3 moveable tables that measured and the experiment in full place tray seedlings about 2.6 square meters. The control window had settings for temperature, humidity, and light which, could be programmed. This allowed precise experimental conditions plus energy and electricity savings. The second experiment was conducted in the summertime from (May to July 2018) at the experimental and Research Farm of the Szent Istvan University at Soroksar greenhouse, which is geographically located at 20.2 km in the northeast direction of Budapest about N 47° 24′ 40″, E 19° 7′ 48″ and an altitude of 99–110 m above Baltic-sea level. The experimental and research farm is situated on the Danube casting site, so it is categorized by sandy casting that has the physical properties of sandy soil. The experiment was carried out in a greenhouse in Complete Randomized Design (CRD) with 6 replications (Ahmed et al., 2022).
Factors of substrate considered in the experiment: For the experiment, 3 types of substrates were used, (1) BRT® green moss: Biomass Refine Technologies as products that absorb oil, water, chemicals, and other liquids. (2) DCM Aquaperla®: is a substrate additive developed to improve moisture and nutrient retention – Potassium-polyacrylate. (3) Floresca (substrate) is an accumulation of partially decayed vegetation or organic matter used as a control and mixture media with the substrate. Mainly it is a mixture of black peat, 20% of white peat, and 20% of composted cattle manure. The three recommended rates of BRT®, Ever Green are: (RR); 10% RR; 20% RR; 30% RR. And the Recommended rate of DCM Aquaperla and the substrate. The properties of all substrates are shown in Tables 1–3.
Measured Parameters
Unit
Average
Dry Matter Content
m/m%
69.5
pH-H2O
6.3
Volume
kg/dm3
0.68
Size of granules < 20 mm
%
100
Total Dissolved Solids
m/m%
0.84
Organic matter at 600 °C
m/m%
42.8
Total Nitrogen (N)
m/m%
1.90
Total Phosphorus (P2O5)
m/m%
0.52
Total Potassium (K2O)
m/m%
0.70
Total Calcium (Ca)
m/m%
1.88
Total Magnesium (Mg)
m/m%
0.61
Total Arsenic (As)
m/m%
9.29
Total Cadmium (Cd)
m/m%
0.26
Total Cobalt (Co)
m/m%
4.86
Total Chromium (Cr)
m/m%
24.9
Total Copper (Cu)
m/m%
25.45
Total Mercury (Hg)
m/m%
0.16
Total Nickel (Ni)
m/m%
20.6
Total Lead (Pb)
m/m%
10.05
Total Selenium (Se)
m/m%
0.86
Type of substrate
Tretment
55% Black peat, 25% white peat, and 20% Hungarian grey cattle manure
F
BRT®Evergreen (Biomass Refine Technologies) → Carbamide formaldehyde polymer (17.3%), Formaldehyde (0.9%), Carbamide (2.2%), Clarified phosphorus acid (1.5%), Alkylbenzole sulfur acid (0.8%), Surfactant (0.2%), Water (77.1%)
F/B1
F/B2
F/B3
Aqua perla → Potassium-poliacrilate
F/A
Mineral content
Values
pH (KCl)
6,07
Total Salt (TS - m/m%)
0,05
Na (mg/kg)
835
Nitrogen (NO2 + NO3-N mg/kg)
1040
Phosphorus (P2O5 - mg/kg)
6180
Potassium (K2O - mg/kg)
7500
Mg (mg/kg)
1910
Cu (mg/kg)
13,4
2.2 Plant growing
For this experiment, one variety of lettuce used was from the company (Bejo from the Netherlands), type “Sotalis- F1” as a test crop. Lettuces were grown separately from the second stage (plant growing period). Treatments were substrate additives developed for improvement, three levels of BRT®, EverGreen: recommended rate (RR); 10% RR; 20% RR; 30% RR respectively, And DCM Aquaperla, in the recommended dose of 2 kg/m3, the chemical properties of BRT®Evergreen are shown in (Table 3). Each treatment has six replications, with each replication having five lettuce plants. Therefore, a total of 150 experimental plants were used in the experiment. Watering of plants was done every day with the number of turns depending on the visual assessment of plants and with the use of a drip irrigation system, The experiment with one dependent factor was laid out in Complete Randomized Design (CRD).
The first experiment was carried out on 24 March 2018, using a seedling plate for direct sowing, at the glasshouse at Szent István University. Sowing of Sotalis- F1 variety in three different types of substrates Florasca, Aquaperla with 3 Levels of BRT10%, BRT20%, BRT30 of BRT® EverGreen was carried out. They received 10 L of tap water and were put into (the place is missing). Temperature, relative humidity, and lightning were kept constant throughout the whole experiment. The preparation of substrate was according to the recommended rate Per % (RR%), the substrate fertilizer tests were applied in seedling plate according to the rate of 10 Kg Peat with 1Kg of BRT10 and (2 kg from the BRT, 3Kg BRT) as a mixture, and Aquaperla 50% to peat 50% are mixed. When the cotyledons emerged, plants were supplied with 1 to 2 L of water starter concentration for the first time on 20 April after one-month transplantation.
2.3 Measured and observed parameters
Plant growth yield measurement: Growth and yield data collection parameters were collected during the field experiment by sampling three randomly selected plants from central rows of each experimental unit for 43 days after transplanting. During the experiment, three leaves from every plant and five plants in every repetition were measured. In this case, for every repetition, 15 leaves were used. The fresh weight of leaves was measured using a precision balance EMS (Balingen, Germany) (Ebadi et al., 2022), and results were expressed in g/plant for each sample. Chlorophyll content was measured with a Chlmeter (Soil Plant Analysis Development (SPAD) chlorophyll meter (SPAD 502; Minolta Camera, Osaka, Japan). For SPAD measurement, three measurements were taken on a randomly chosen big leaf in the middle of every three lettuce plants, and the SPAD meter showed up the average automatically. Lettuce head diameter: Lettuce head and root diameter were measured by using a caliper. Plant leaves and roots were dried after the harvest in an oven at 70 °C for 48 h for dry mass determination (Agüero et al., 2008).
2.4 N P K content in a lettuce leaf and root
The root and green parts of the lettuce sample were ground into small pieces and digested with sulphuric acid to analyze NPK content. The nitrogen (N) content, Phosphorus (P) content, and Potassium (K) content was analyzed according to the modified methods (Šestak et al., 2022; Ge et al., 2019).
2.5 Statistical analysis
Analysis of variance (ANOVA) was used to evaluate the data. The Shapiro-Wilk test and the Bartlett test were used to ensure the data were normally distributed and homogeneous, respectively, before attempting an analysis of variance. Non-Gaussian data were expressed as a logarithmic function (logx + 1). A Tukey's Honest Significance Difference (HSD) test at 5% (=0.05) was used when the combined ANOVA revealed a significant difference.
3 Results
The two-way ANOVA results of fresh lettuce weight showed that there was a significant difference between the two independent variables at F (4,145) = 10.33, p < 0.01 for Soroksar, and University F (4,150) = 4.68, p = 0.01, since both p values are below 0.05 (Table 2, Fig. 1). According to descriptive statistics, the harvesting date is an important factor for production and yield. The Soroksar treatment results showed no significant difference between the samples, despite them belonging to different groups (F30 = a; FAP = ab; F = bc; F10 = c; F20 = c). The lowest p-value was observed between treatments F, F10, and F20 (p = 0.36). The same trend applied to the University treatment, as there were no significant differences observed according to the Test of Between-Subjects Effects (F10 = a; F = a; FAP = a; F30 = ab; F20 = b). Additionally, p = 0.154 between treatments F30 and F20. Regarding descriptive statistics and mean values, it can be noted that from the mean values of the analysis obtained in the Soroksar area, F20 had the highest lettuce fresh weight, while F30 had the lowest fresh weight. Additionally, from the University samples, F30 showed the highest value, while the lowest one was observed with the F10 measurement.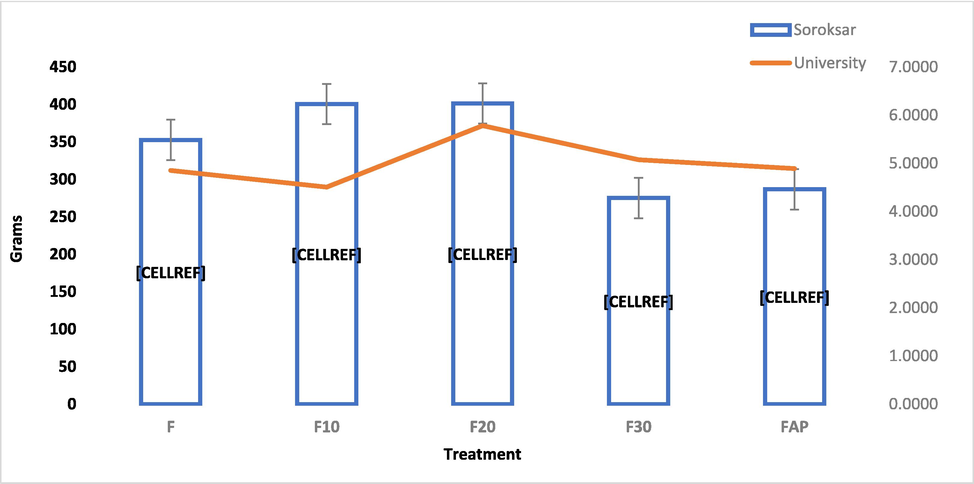
Means and Std. deviations of fresh lettuce head for Soroksar and University for each treatment. Treatment notation. F (Florasca), F10 (Florasca + 10% BRT); F20 (Florasca + 20% BRT), F30 (Florasca + 30% BRT); FAP (Florasca with Aquaperla). Unit of mean. Different letters are significantly different groups (Tuckey’s. Soroksar (p = 0.36); University (p = 0.15).
3.1 Dry matter content of lettuce
The dry matter content of lettuce grown in the university glasshouse was measured and the results were shown in (Fig. 2). For the leaves, it was observed that plants treated with F + 20% have the lowest dry matter content. The other treatments resulted in relatively similar dry matter content with F + 30% having the highest amount. Corresponding to the leaves, the dry matter content of the roots of the same lettuce plants grown in the university glasshouses was measured. Results showed that the dry matter content is generally the same for all the treatments with the presence of the substrate additives, (both BRT and Aquaperla). The highest dry matter content of the root was measured in the plants treated with F.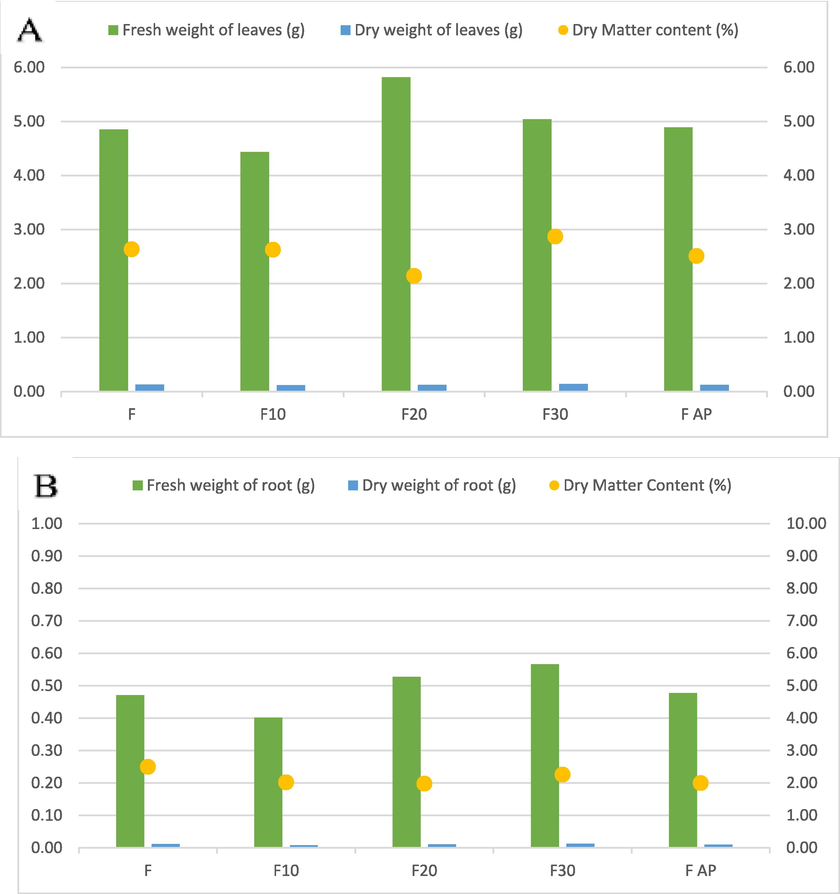
Dry matter content of A; leaves. B; roots of lettuce grown in the university glasshouse. Treatment notation: F = Florasca, F + 10%= Florasca with 10% BRT, F + 20%= Florasca with 20% BRT, F + 30%= Florasca with 30% BRT, and F + AP = Florasca with Aquaperla.
3.2 Lettuce head diameters
Results of this study showed that on the 10th of June F(4,145) = 10.33 with a p-value of p < 0.001 which means that the treatments were highly significant on this day of measurement. On the 29th of June, we recorded values of F(4,85) = 2.13, where the p-value was p = 0.08, which means that the treatments were not significant on this day.
The head diameter was measured twice time before the harvesting date in the Soroksar experiment field, the first time on the 29th of June 2018, and the second measurement was carried out on the 10th of July 2018 as shown in (Table 2, Fig. 3), Results showed that during the 29th of June 2018, which is four weeks after transplanting, the diameter of the plants was not significantly influenced by any treatment at p > 0.05. Meanwhile, on the 10th of July 2018, there was a significant difference in the diameter of lettuce where treatment F + 30% resulted in greater diameter as compared to treatments F + 10% and F + 20%. According to, descriptive statistics and mean values on both 29th of June 2018 and 10th of July 2018, it can be noted that the mean values of the analysis obtained in F20 had the highest lettuce head diameter, while the F30 and FAP had the lowest head diameter.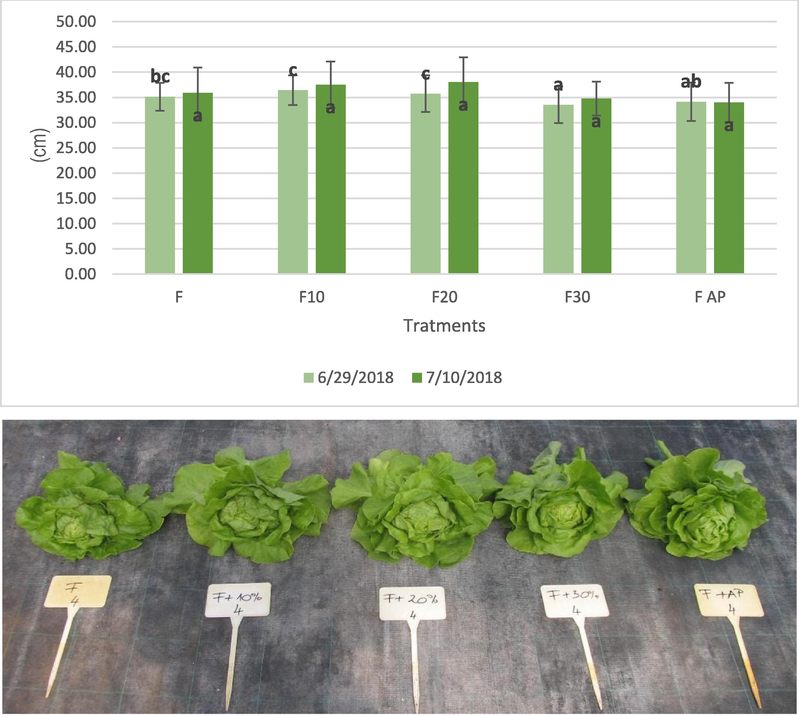
Means and Std. deviations of fresh lettuce head on 29th June and 10 th July 2018 for each treatment. Treatment notation. F (Florasca), F10 (Florasca + 10% BRT); F20 (Florasca + 20% BRT), F30 (Florasca + 30% BRT); FAP (Florasca with Aquaperla). Unit of mean. Cm/ Different letters are significantly different groups (Tuckey’s. 29th June (p = 0.36); 10 th July (p = 0.08).
3.3 Chlorophyll content and SPAD readings
One of the non-destructive methods to determine the chlorophyll content of plants is through the relative greenness measurement values from SPAD. Based on the graph, it can be observed that the trend is a decreasing SPAD value across an increasing amount of BRT. Statistically, it was found that lettuce treated with F + 30% and F + AP have significantly lower SPAD values as compared to the rest of the treatments with F treatment having the highest SPAD value at p < 0.05 (Table 4). In terms of the result of the SPAD Readings of lettuce grown in the university glasshouse, it can be observed that plants showed a similar trend with those that are grown in Soroksar where an increasing amount of BRT results in decreasing SPAD value was recorded. It can be further noted that treatment F + AP has resulted in a higher SPAD value in the university treatments as compared to those of Soroksar. Statistically, treatments F + 30% and F + 20% resulted in higher SPAD values than treatment F at p < 0.05 (Fig. 4).
Fresh lettuce head
Chlorophyll
SPAD
Soroksar
(29th June)University
Soroksar
(10th July)(Soroksar)
(Soroksar)
(University)
Treatment
Mean ± Std post hoc
Mean ± Std post hoc
Mean ± Std post hoc
Mean ± Std post hoc
Mean ± Std post hoc
Mean ± Std post hoc
F
352.57 ± 103.66 bC
4.85 ± 1.261a
35.17 ± 2.791a
551.94 ± 278.17b
27.824 ± 6.213a
60.29 ± 7.764
F10
400.50 ± 97.93C
4.51 ± 1.11a
35.72 ± 3.626a
385.93 ± 203.20 ab
25.361 ± 5.339a
58.56 ± 7.652
F20
401.30 ± 129.93C
5.78 ± 1.32b
33.56 ± 3.663a
293.14 ± 154.47 a
25.580 ± 5.557a
258.21 ± 7.629
F30
275.17 ± 84.42a
5.074 ± 1.154aB
34.17 ± 3.811a
717.02 ± 329.90c
21.765 ± 5.667a
55.79 ± 7.469
FAP
286.77 ± 92.31aB
4.89 ± 1.23a
36.44 ± 2.935a
571.14 ± 274.54bc
22.637 ± 5.135a
59.94 ± 7.742
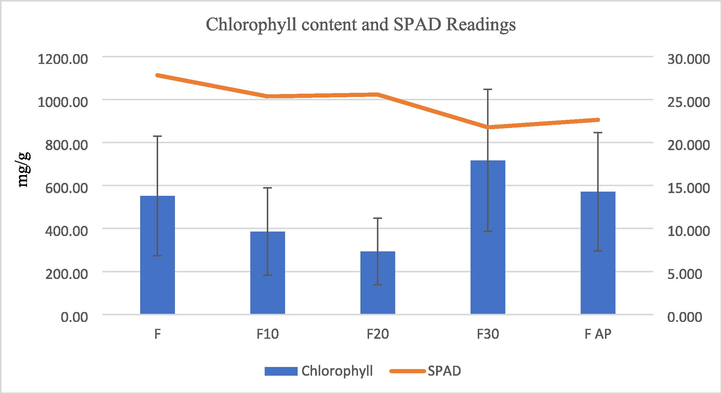
Chlorophyll content and SPAD readings (Soroskar).
This observation is contrary to the results of the experiment conducted by León et al. (2007) on lettuce where a significant correlation (R2 = 0.85–0.92) was found between SPAD values and chlorophyll content in tissues. Nevertheless, the chlorophyll b content of the lettuce leaves according to literature which ranges from 280 to 5,600 mg/100 g (Premuzic, et al., 2000) is quite comparable with the chlorophyll measurements across different treatments which ranges from 362 for F + 20% BRT treated plants as the minimum while 855 for F + 30% BRT as the maximum.
3.4 Lettuce N P K content in leaves
Fig. 5 shows the differences between NPK values of lettuce across all the treatments in the lettuce leaves content NPK in Soroksar farm, which can be considered to direct indicator for physical plant growth as it influences all the plant parts and the yield of the plant. For (N) Nitrogen content, statistical results indicated that F-treated plants have significantly higher N content than F + 30% which has a lower content with a decreasing trend across increasing BRT levels. As for (K) Potassium content, results showed that F-treated plants have significantly higher K content than plants treated with F + 30% BRT. In terms of Phosphorus content, F + AP treatments are significantly higher as compared to the rest. Meanwhile, the result of the N P K Readings of lettuce grown in the university glasshouses showed that Nitrogen content was influenced by the treatments wherein F treated plants have significantly high N content compared to F + 30% BRT treatment. As for the Potassium (K) content, it was observed that there is a significantly high amount of K in the leaves of F + 10% BRT plants as compared to F + AP treated plants. Lastly, for the Phosphorus content (P), it was found that F + AP treated plants have the highest content of this nutrient and were significantly different from F and F + 20% BRT treated plants at p < 0.05.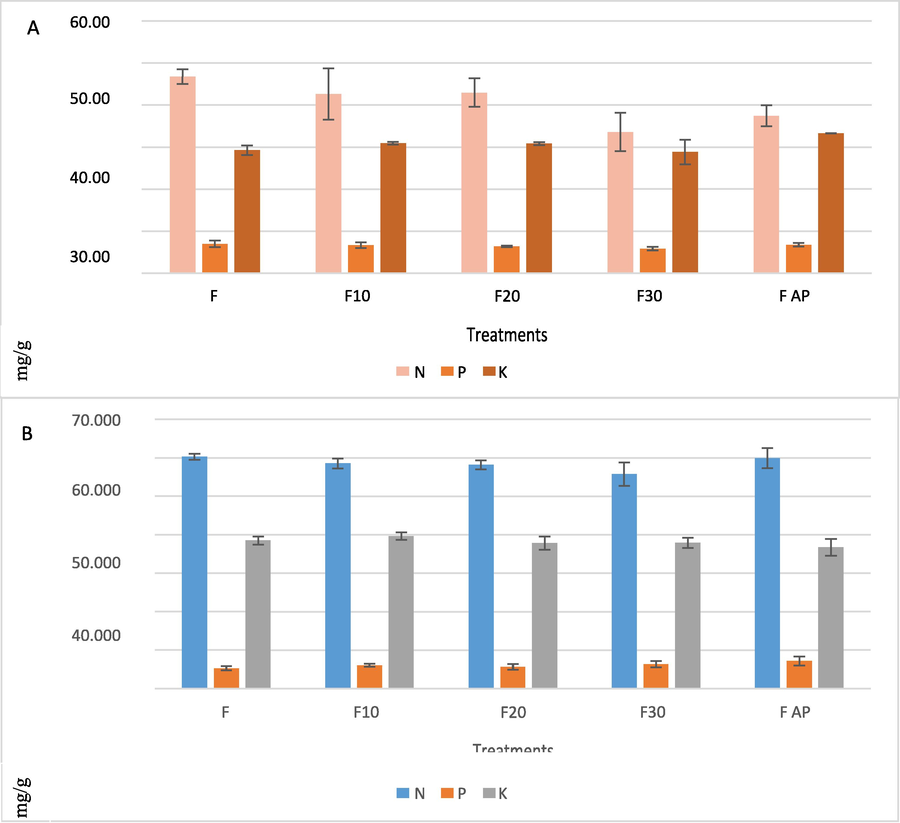
Lettuce NPK content in leaves subjected to different treatments in A; Soroksar. B; University. Treatment notation. F = Florasca, F + 10%= Florasca with 10% BRT, F + 20%= Florasca with 20% BRT, F + 30%= Florasca with 30% BRT and F + AP = Florasca with Aquaperla.
3.5 Lettuce N, P, K content in root
The NPK content of roots across all treatments was also measured in both locations of this research. It was found that in Soroksar, the Nitrogen (N) and Potassium (K) content were not 293 significantly influenced by the treatments. Meanwhile, Phosphorus (P) content was found to have been significantly influenced by the treatments wherein F + AP treated plants have significantly high P content than F and F + 20%, F + 10% treated plants at p < 0.05. As for the result of NPK content of roots of lettuce grown in the university glasshouse, it was found that F- treated plants have significantly higher N content than F + 30% BRT treated plants. For the Phosphorus content, it was significantly higher in plants treated with F + AP as compared to F and F + 20% BRT 299 treated plants (Fig. 6A).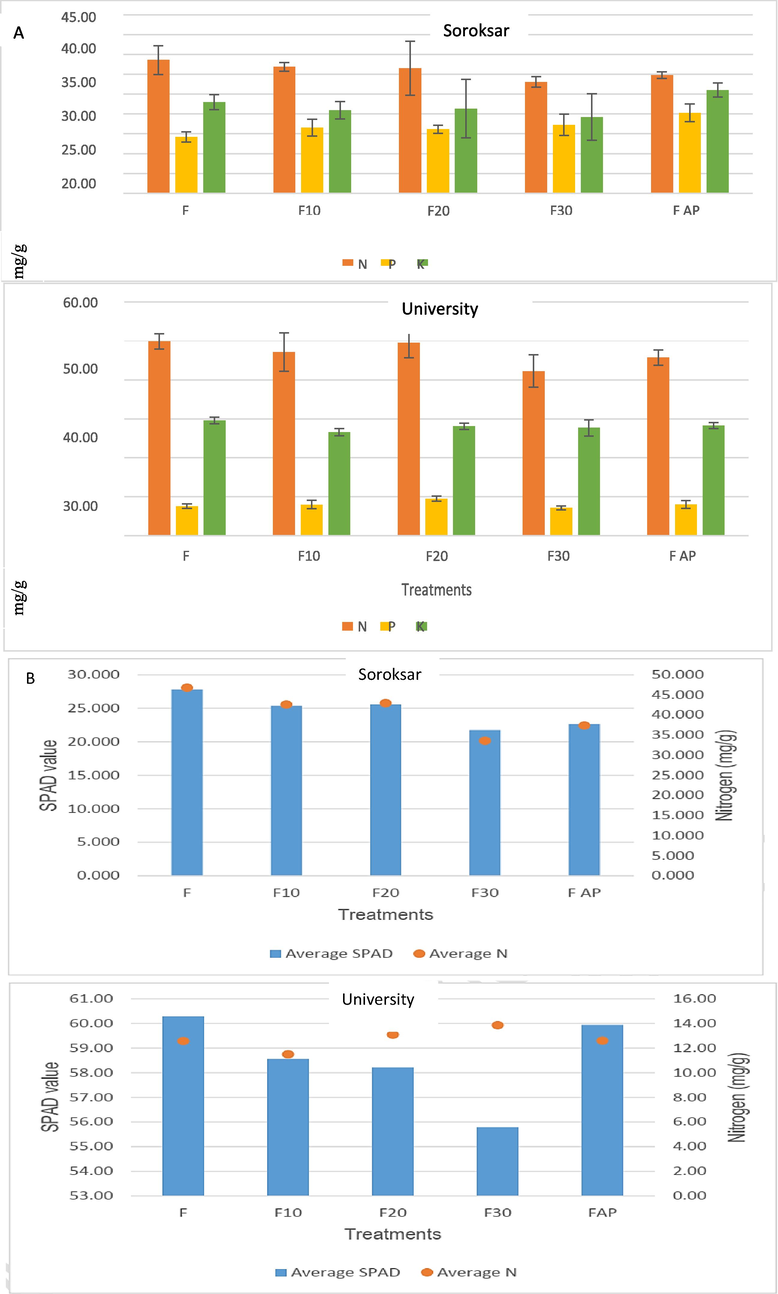
A; Lettuce NPK content in roots subjected to different treatments B; SPAD value and nitrogen content of the leaves of lettuce grown.Treatment notation. F = Florasca, F + 10%= Florasca with 10% BRT, F + 20%= Florasca with 20% BRT, F + 30%= Florasca with 30% BRT and F + AP = Florasca with Aquaperla.
3.6 Correlation of nitrogen and SPAD
Relative greenness is influenced by the amount of chlorophyll pigment which is responsible for the green color of the leaves. The greener the leaves, the higher its photosynthetic capacity and potential growth. In gauging this parameter, a non-destructive technique using a chlorophyll meter (e.g., SPAD) was adopted to measure leaf absorbance on red and near-infrared wavelength, indicating the relative amount of chlorophyll present in the leaves hence, higher SPAD values signify higher chlorophyll content. Nitrogen plays a key role in the production of chlorophyll pigment; thus, a lighter green color of leaves is reflected in low SPAD values of the plants and vice versa. As shown in Fig. 6B, it can be observed that the N content of the leaves is positively correlated with the SPAD values. It can be inferred from this that the greener leaves of plants with treatments F followed by treatments F + 10% BRT and F + 20% BRT are attributed to the higher nitrogen content. Meanwhile, it can be observed that the relationship between SPAD values and the nitrogen content of the leaves of the lettuce grown inside the university glasshouse is quite contradicting that of Soroksar. It was apparent that there is a decreasing SPAD value trend with increasing nitrogen content. This observation has also opposed the expected trend in general, where there is a positive correlation for both variables.
4 Discussion
Results showed lettuce grown in Soroksar farm exhibited a heavy weight when subjected to treatments F + 10% and F + 20% BRT as compared to plants treated with F + 30% and F + AP.
Meanwhile, in the university glasshouse, it was observed that lettuce treated with F + 20% had the greatest weight as compared to plants subjected to other treatments. Generally, for lettuce grown in two different locations and conditions, it can be inferred that F + 20% BRT treatment has resulted in the greatest growth in weight. This study also investigated the dry matter content of the lettuce plant parts, specifically leaves and roots. Beninni et al. (2021) reported that when lettuce is grown in soil, there is a direct relationship between the amount of nutrients and the amount of dry matter. In this case, the shoots build up macronutrients in the following order: K > N > Ca > P > S > Mg. This measurement is related to the fresh weight as it provides information about the total components (i.e., fibers, proteins, ash, water-soluble carbohydrates, lipids, etc.) of the plant excluding the water content. Results of this study suggest that leaves of F + 20% treated plants have the least dry matter content even though it has the greatest fresh weight. This implies that F + 20% BRT treated plants weigh higher because of their high-water content.
In terms of the chemical composition analysis of the lettuce, chlorophyll content has been gauged and has been correlated with SPAD readings. The chlorophyll content is one of the indices of photosynthetic activity, which are pigments responsible for the green color of the leaves. At the beginning of flowering, plants have the most chlorophyll, and chlorophyll is thought to be involved in the process of organogenesis (Dziwulska-Hunek et al., 2020). It is characterized to have a broad absorption band from blue to red (Costache et al., 2011). The green color of the leaves can be measured non-destructively and be used as an indicator of chlorophyll content through SPAD measurements.
Relating to the results of this study, it was found that only plants treated with F, F + 10%, and F + 20% have exhibited a direct relationship where decreasing chlorophyll content resulted in decreasing SPAD values. The plants treated with F + 30% BRT and F + AP have an inverse relationship between the SPAD values and chlorophyll content. This observation is contrary to the results of the experiment conducted by (León et al., 2007; Sharaf-Eldin et al., 2015) on lettuce where a significant correlation (R2 = 0.85–0.92) was found between SPAD values and chlorophyll content in tissues. Nevertheless, the chlorophyll b content of the lettuce leaves, according to literature which ranges from 280 to 5,600 mg/100 g (Herrmann, 2001), is comparable with the chlorophyll measurements across different treatments F + 20% BRT treated plants range from 362 as the minimum while F + 30% BRT ranges from 855 as the maximum. Zandvakili et al. (2019) found that fertilized lettuce leaves had higher SPAD levels than unfertilized lettuce leaves. Among the lettuce cultivars, there were wide variations in pigment content. For instance, among lettuce cultivars, the Great Lakes type naturally has a higher pigment content since it is greener than the others, from pale green to yellow (Yaseen, and Takacs-Hajos, 2022). The other measurement that was done for the composition of the plants is its NPK content. Generally, all the amounts of the three mentioned macronutrients were found to be significantly influenced by the treatments. For both N and K content of the leaves, it was observed to be significantly high in plants treated with F as compared to plants treated with F + 30% and grown in Soroksar. This is very important because nitrogen is a part of the process of photosynthesis, and it is an important part of plant growth (Andrews et al., 2013). Results for N content were also the same for plants grown in the university glasshouse. Regarding P content, F + AP treatment was found to result in the highest accumulation of this nutrient. Relative to the result of the analysis for this study, it was found that the Nitrogen content of the lettuce that was both grown in the university glasshouse and Soroksar was relatively lower as compared to the values from the related literature 92.4 mg. Boros et al. (2020) mentioned that according to Commission Regulation (EC) No. 1258/2011, the maximum nitrate concentration of lettuce is between 2000 and 5000 mg NO3/kg, depending on the harvest season and method used. As for the Phosphorus, the concentration for both lettuces grown in the glasshouse and Soroksar which ranges from 5.3 to 7.2 mg and 5.8–7.0 mg are quite low as compared to the reference values of nutrients that range from 18 to 28 mg. Lastly, for the Potassium (K) content, the actual findings of the study, which range from 36.8 to 39.7 mg for lettuce grown in the university and 28.9–33.3 mg for lettuce grown in Soroksar are quite low compared to the values from the literature, where the K content was found to range from 170 to 220 mg (Herrmann, 2001). As for the NPK content of the roots, results showed that N content was generally the same across treatments but significantly low for F + 30% treated plants. The same observation was found in the P and K content of the roots of lettuce grown in the university glasshouse. For the roots of the lettuce grown in Soroksar, it is most notable that the Phosphorus content was significantly low for F-treated plants. Lastly, the correlation between N content and SPAD values was also determined in this study. Nitrogen plays a key role in the production of chlorophyll pigment; thus, a lighter green color of leaves is reflected in low SPAD values of the plants and vice versa. Considering this, it can be expected that the SPAD values are increasing with an increasing N content. This trend was observed to be consistent with both lettuce plants grown in the university glasshouse and Soroksar, but it is very apparent that this relationship is more obvious for lettuce grown in Soroksar.
5 Conclusions
This research has focused on the effects of recently developed substrate additives, namely BRT®Evergreen and Aquaperla, on the growth and yield characteristics of the lettuce. The lettuce was grown and subjected to two environmental conditions, the Soroksar Experimental and Research Farm, Budapest. It was established that lettuce fresh weight is influenced using substrate additives. In addition, mineral contents were also heavily influenced by substrate addition; however, inner contents are usually not influenced by the treatments but rather by the effect of time which is credited to its normal physiology. In this perspective, where plant growth was largely not affected negatively by the treatments, it can be concluded that the use of substrate additives in/for lettuce production can be acceptable.
Acknowledgement
The authors extend their appreciation to FAO Research fund.
Declaration of Competing Interest
The authors declare that they have no known competing financial interests or personal relationships that could have appeared to influence the work reported in this paper.
References
- Postharvest changes in water status and chlorophyll content of lettuce (Lactuca sativa L.) and their relationship with overall visual quality. J. Food Sci.. 2008;73(1):S47-S55.
- [Google Scholar]
- Biological investigations on macro-morphological characteristics, polyphenolic acids, antioxidant activity of Perilla frutescens (L) Britt. grown under open field. Saudi J. Biol. Sci.. 2022;29(5):3213-3222.
- [Google Scholar]
- Potential replacements for rockwool as growing substrate for greenhouse tomato. Can. J. Soil Sci.. 2005;85(1):67-74.
- [Google Scholar]
- Do plants need nitrate? The mechanisms by which nitrogen form affects plants. Ann. Appl. Biol.. 2013;163(2):174-199.
- [Google Scholar]
- Lettuce seedlings development index in different substrates using multivariate analysis. Científica. 2015;43(1):50-57.
- [Google Scholar]
- Quantification of nitrate content with FT-NIR technique in lettuce (Lactuca sativa L.) variety types: a statistical approach. J. Food Sci. Technol.. 2020;57(11):4084-4091.
- [Google Scholar]
- Research on the methodology of extraction of chlorophyll and carotene content of tomatoes grown in the south of Romania area. Lucrări Științifice-Universitatea de Științe Agronomice și Medicină Veterinară București. Seria B, Horticultură. 2011;55:69-73.
- [Google Scholar]
- Influence of electromagnetic stimulation of seeds on the photosynthetic indicators in Medicago sativa L. leaves at various stages of development. Agronomy. 2020;10(4):594.
- [Google Scholar]
- Quality testing of new Hungarian apple cultivars in normal atmosphere storage. J. Food Process. Preserv.. 2022;46(3):e16354.
- [Google Scholar]
- Effect of soil application of humic acid and hydrogel on morpho-physiological and biochemical attributes of potato (Solanum tuberosum L.) Pakistan J. Life Social Sci.. 2014;12(2):92-96.
- [Google Scholar]
- Performance of wick irrigation system using self-compensating troughs with substrates for lettuce production. J. Plant Nutr.. 2016;39(1):147-161.
- [Google Scholar]
- High-throughput analysis of leaf physiological and chemical traits with VIS–NIR–SWIR spectroscopy: a case study with a maize diversity panel. Plant Methods. 2019;15(1):1-12.
- [Google Scholar]
- Humic substances from vermicompost enhance urban lettuce production. Agron. Sustain. Dev.. 2015;35(1):225-232.
- [Google Scholar]
- Inhaltsstoffe von Obst und Gemüse. Ulmer; 2001.
- Response of different nutrient to the plant growing. Indian J. Agric. Sci.. 2003;65(11):818-820.
- [Google Scholar]
- Kohut, I., Radó-Takács, A., Riszter, I. and Mándy, A.T., 2016. Effects of BRT® Evergreen and Aqua+ 3 application on Aquilegia flabellata var. pumila and Pelargonium peltatum'rainbow rose'. In: VII International Scientific Agriculture Symposium,“ Agrosym 2016”, 6-9 October 2016, Jahorina, Bosnia and Herzegovina. Proceedings. University of East Sarajevo, Faculty of Agriculture, pp. 859-865.
- Evolution and genetic population structure of prickly lettuce (Lactuca serriola) and its RGC2 resistance gene cluster. Genetics. 2008;178(3):1547-1558.
- [Google Scholar]
- Estimation of chlorophyll contents by correlations between SPAD-502 meter and chroma meter in butterhead lettuce. Commun. Soil Sci. Plant Anal.. 2007;38(19–20):2877-2885.
- [Google Scholar]
- Impacts sanitaires des eaux d'arrosage de l'agriculture urbaine de Dakar (Sénégal). University of Geneva; 2009. Doctoral dissertation
- Ngobeni, N.D., Buthelezi, N.M., Mataruka, D., 2007, October. Growth and yield response of cotton cultivars to Zeba superabsorbent polymer and N-application under irrigation. In: African Crop Science Conference Proceedings (Vol. 8), pp. 213-217.
- Genome-wide analysis of MADS-box family genes during flower development in lettuce. Plant Cell Environ.. 2019;42(6):1868-1881.
- [Google Scholar]
- Radó-Takács, A., 2016, September. The effect of growing mixture additives on the development of Viola x wittrockiana’Carrera’. In Scientific proceedings of the 5th International Scientific Horticulture Conference, p. 111.
- Green roofs for a drier world: Effects of hydrogel amendment on substrate and plant water status. Sci. Total Environ.. 2014;490:467-476.
- [Google Scholar]
- Assessment of the Impact of Soil Contamination with Cadmium and Mercury on Leaf Nitrogen Content and Miscanthus Yield Applying Proximal Spectroscopy. Agronomy. 2022;12(2):255.
- [Google Scholar]
- Sharaf-Eldin, M.A., Peregi, K.E., Pap, Z. Effects of different organic fertilizers on seedlings growth and photosynthesis of Chinese cabbage (Brassica rapa ssp. pekinensis). In: 50th Croatian & 10th International Symposium on Agriculture, 16-20 February 2015, Opatija, Croatia. Proceedings. University of Zagreb, Faculty of Agriculture, 2015.
- Examination of BRT Greenmoss, BRT Evergreen and Fainsoil Bioactivator (FBA) in the Production of L ‘Csemő’. Acta Horticulturae et Regiotecturae. 2016;19(s1):35-39.
- [Google Scholar]
- Viztiu, O., Calciu, I., Simota, C., Mihalache, M., 2014. Soil water conservation–a measure against desertification. In: 14th International Multidisciplinary Scientific Geoconference SGEM 2014, pp. 253-258.
- Evaluation of moringa (Moringa oleifera Lam.) leaf extract on bioactive compounds of lettuce (Lactuca sativa L.) grown under glasshouse environment. J. King Saud Univ.-Sci.. 2022;34(4):101916
- [Google Scholar]
- Comparisons of commercial organic and chemical fertilizer solutions on growth and composition of lettuce. J. Plant Nutr.. 2019;42(9):990-1000.
- [Google Scholar]
Appendix A
Supplementary material
Supplementary data to this article can be found online at https://doi.org/10.1016/j.jksus.2023.102718.
Appendix A
Supplementary material
The following are the Supplementary data to this article:


