

Translate this page into:
Effects of atorvastatin on serum lipids, cardiomyocyte apoptosis and related genes in rats
⁎Corresponding author at: Department of Internal Medicine-Cardiovascular Department, Zhangjiagang First People’s Hospital, No. 68 Jiyang West Road, Zhangjiagang, 215600 Jiangsu, China. heartqianxs@163.com (Xuesong Qian)
-
Received: ,
Accepted: ,
This article was originally published by Elsevier and was migrated to Scientific Scholar after the change of Publisher.
Peer review under responsibility of King Saud University.
Abstract
Objective
To investigate effects of different doses of atorvastatin on serum lipids, cardiomyocyte apoptosis and related genes in rats with myocardial infarction.
Methods
60 SD rats were randomized into control group (n = 12) and modeling group (n = 48). The models were established by ligation of left anterior descending (LAD) in rats. 5wk later, the rates after successful modeling were divided into modeling group (n = 12) and treatment group (n = 36), and treatment group was equally divided into low dose group (20 mg/kg atorvastatin daily), medium does group (40 mg/kg atorvastatin daily) and high does group (80 mg/kg atorvastatin daily). After administration, the ratio of heart weight (HW) to body weight (BW) was calculated (HW/BW). Contents of total cholesterol (TC), triglyceride (TG), low density lipoprotein cholesterol (LDL-C) and moderate – high density lipoprotein cholesterol (HDL-C) in serum of rats were measured. Apoptosis index of rat cardiomyocytes was detected with TUNEL method. Expression levels of Caspase-3, Bax, and Bcl-2 proteins in each group were detected by Western blot.
Results
Compared with control group, heart surface of modeling group was rough, and weight of model group was significantly higher than that of control group, low, medium and high dose groups after 9 weeks of modeling (P < 0.05). TC, TG, and LDL-C in modeling group were significantly higher than those in control group (P < 0.05), HDL-C was significantly lower than those in control group (P < 0.05). Changes in blood lipid-related indicators could be improved after administration, and the higher the dose, the better the improvement effect. Apoptosis index of cardiomyocytes in modeling group, the low, medium and high dose group was significantly higher than that in control group (P < 0.05), but apoptosis of cardiomyocytes was significantly reduced in atorvastatin group at different doses. The higher the dose, the more obvious the reduction effect. The expressions of Caspase-3, Bax, and Bcl-2 proteins in modeling group, low, medium and high dose groups were significantly higher than those in control group (P < 0.05), but administration group significantly reduced apoptosis of myocardial cells, and the higher the dose, the more significant the reduction effect.
Conclusion
Atorvastatin can reduce TC, TG and LDL-C levels and increase HDL-C level in blood lipids, inhibit expressions of Caspase-3 and Bax and raise expression of Bcl-2 protein so as to inhibit cardiac hypertrophy, reduce cardiomyocyte apoptosis, restore myocardial function and improve myocardial infarction symptoms.
Keywords
Different doses of atorvastatin
Myocardial infarction
Myocardial apoptosis
Blood lipid-related indicators
Caspase-3 protein
Bax protein
Bcl-2 protein

1 Introduction
Myocardial infarction (AMI) is also known as coronary occlusion. Coronary artery occlusion or dysfunction causes acute or persistent ischemia and hypoxia of myocardium, eventually leading to myocardial necrosis (Lu et al., 2015). Clinically, it is often accompanied by persistent precardiac pain, elevated white blood cell count, elevated serum myocardial enzyme (CK-MB), cardiomyocyte apoptosis, arrhythmia and other symptoms. It may lead to cardiac remodeling or heart failure, endangering the patient's life (Thygesen et al., 2007). Atorvastatin is a 3-hydroxy-3-methyl glutaryl coenzyme A reductase (HMG-CoA) inhibitor, which is mainly used for prevention and treatment of hypercholesterolemia, hyperlipidemia, coronary heart disease, cerebral apoplexy and so forth (Ferrante et al., 2014). Atorvastatin can reduce serum total cholesterol (TC), triglyceride (TG), low density lipoprotein cholesterol (LDL-C), and moderate ∼ high density lipoprotein cholesterol (HDL-C) (Chan et al., 2016). Some studies have shown that atorvastatin can also reduce the formed atherosclerotic plaque, inhibit platelet aggregation, reduce myocardial inflammatory reaction, improve hemodynamics and cardiac function and inhibit the effect of cardiomyocyte apoptosis (Jia et al., 2016). Previous studies have shown that apoptosis of cardiomyocytes is mainly caused by changes in expression levels of apoptotic factors such as b-cell lymphoma/leukemia-2(Bcl-2), Bcl-2 gene-related X protein (Bax) and cysteine protease 3 (caspase-3). However, Bcl-2 is a class of factors that can inhibit apoptosis, which mainly plays a role in inhibiting apoptosis by regulating the Caspase-dependent apoptosis pathway. Bax is a kind of protein that can participate in promoting cell apoptosis and is mainly expressed in the early stage of cell apoptosis. The increased expression level of Bcl-2/Bax protein indicated an increased cell survival rate (Giraldo, 2010; Harvey et al., 2015). Moreover, it has been proved that statins can down-regulate the expression of Caspase-3 by regulating the protein kinase C pathway, and ultimately inhibit cell apoptosis (Kostić et al., 2014; Tanaka et al., 2004).
Therefore, in this study, the rat model of myocardial infarction was constructed and different doses of atorvastatin were given to further investigate the effects of atorvastatin on the protein expression of serum lipidity-related indicators, myocardial cell apoptosis and apoptosis-related factors in rats, so as to further investigate the effect and protection mechanism of atorvastatin on AMI rat cardiomyocytes, and the results are reported as follows.
2 Materials and methods
2.1 Main agents and instruments
Atorvastatin calcium tablets (commodity name: Lipitor, Pfizer Inc), sodium pentobarbital (Shanghai Xinyu Biotech Co., Ltd.), Caspase-3 antibody (Thermo Fisher, China), Bax antibody (Thermo Fisher, China), Bcl-2 antibody (Thermo Fisher, China), immunohistochemical staining kit (Thermo Fisher, China), TUNEL kit (Thermo Fisher, China), and AU5800 full-automatic biochemical analyzer (Beckman Coulter Commercial Enterprise Co., Ltd., China).
2.2 Construction and grouping of animal models
60 SPF-level clean and healthy male SD rats with body weights of (200 ± 20) g were provided by Shanghai Slack Experimental Animal Co., Ltd. Experimental Animal Center and given with normal diets during the experiment. After adaptive feeding for 1w, the SD rates were randomized into a control group (n = 12) and a modeling group (n = 48). For the modeling group, the method of Maisel, et al. (1998), was adopted to establish model by ligation of the left anterior descending (LAD) (Maisel et al., 1998). The rats were completely anesthetized by intraperitoneal injection of anesthetics and connected to the ventilator. After exposing the heart, the junction of the left atrial appendage and the pulmonary conus was ligated in a direction parallel to the edge of the left atrial appendage. Postoperative chest wall was sutured, tracheal intubation was pulled out, and 800,000 U of penicillin was injected intraperitoneally. The rats were kept in separate cages after they were awake.
5wk later, the rates after successful modeling were divided into a modeling group (n = 12) and an atorvastatin treatment group (n = 36), and the treatment group was equally divided into a low dose group (20 mg/kg atorvastatin daily), a medium does group (40 mg/kg atorvastatin daily) and a high does group (80 mg/kg atorvastatin daily); the control group and the modeling group received the 0.9% NaCl 40 mg/kg, once a day for 4wk continuously.
2.3 Experimental methods and examination of biochemical indicators
At the end of the administration, the rates were anaesthetized with sodium pentobarbital (40 mg/kg) to take 5 ml blood, which was centrifuged 3000r/min for 10 min to take top serum and keep it under −20 °C for future use. (1) Morphological changes in rats: the shape of the rat was observed during the treatment period and the morphology of the heart was observed after death. (2) Cardiac index: the body weight was taken before death and the heart weight was measured after death to calculate HW/BW. (4) Blood lipid level: the TC, TG, LDL-C and HDL-C levels in blood lipids were measured with a full-automatic biochemical analyzer. (4) Cardiomyocyte apoptosis index: myocardial tissue of rat was collected and rinsed with PBS solution containing 1% double antibody and then fixed with 4% paraformaldehyde. A microtome was used to make a sample with a thickness of about 3 μm. After dewaxing, hydration, rinsing, soaking in 0.3% hydrogen peroxide and methanol solution, rinsing and digestion by pepsin K, the status of rat cardiomyocytes was detected according to the instructions of the TDT-mediated dUTP gap-end marker (TUNEL) kit and the apoptosis index of cardiomyocytes was calculated. And the apoptosis index of cardiomyocytes was calculated. (5) Caspase-3, Bax and Bcl-2 protein levels: Caspase-3, Bax and Bcl-2 protein levels of myocardial tissue of rats were tested according to the Western blot method, the gel image processing system was used to measure the integrated optical density of target gene protein bands, so as to compare the differences in protein expression levels, and Bcl-2/ Bax was calculated.
2.4 Statistical analysis
SPSS 19 software was used to analyze all data collected in this study. Measurement data were expressed by ( ± s), and the one-factor analysis of variance or rank sum test was adopted for comparison. P < 0.05 indicated that the difference was statistically significant.
3 Experimental results
3.1 Changes of general and heart morphologies
The weight changes of the rats in each group before modeling, at 5 weeks after modeling (the start of administration), 6 weeks, 7 weeks, 8 weeks and 9 weeks after modeling (the end of administration) were compared, as shown in Fig. 1. It could be observed that there was no significant difference between the weight of the rats in each group before modeling, while the weight of the rats in the modeling group was significantly higher than that in the control group at 5 weeks after modeling, and the weight of the rats in the atorvastatin treatment group at different doses was significantly lower than that in the modeling group 6 weeks later (1 week after administration). Until 9 weeks of modeling, the weight of the control group was 340.46 ± 15.41 g, while that of the modeling group was 404.57 ± 18.46 g, which was significantly higher than that of the control group (P < 0.05). The weight of the rats in the low dose treatment group was 384.21 ± 17.38 g, and that of the rats in the medium dose treatment group was 371.24 ± 15.75 g. The weight of the rats in the two groups was significantly higher than that in the control group (P < 0.05), but significantly lower than that in the modeling group (P < 0.05). The weight of the rats in the high dose treatment group was 362.74 ± 15.24 g, which was significantly higher than that in the control group (P < 0.05), but significantly lower than that in the modeling group and the low dose group (P < 0.05).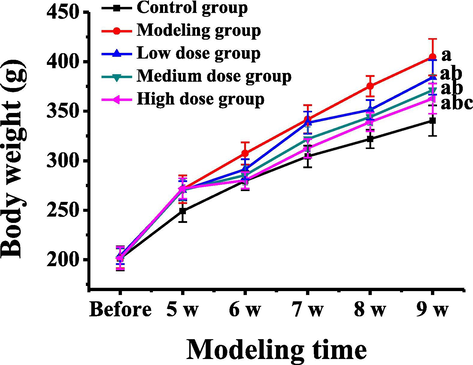
Weight changes of rats in different groups at different times of modeling. Note: a represents a significant difference compared with the control group (P < 0.05); b represents a significant difference compared with the modeling group (P < 0.05); c represents that there was a significant difference compared with the low dose group (P < 0.05).
After 9 weeks of modeling, comparing the external morphology and cardiac morphology of different groups of rats, it was found that the rats in the control group had normal activities and diet, stable breathing, and rosy lips and tongue. Rats in the model group had significantly reduced activity and diet, difficulty breathing, and purple lips and tongue. In the atorvastatin treatment group, the activity and diet were slightly recovered, the breathing was slightly rapid, the lips and tongue were slightly purple; the greater the dose was, the more obvious the improvement of the symptoms achieved. The morphologic changes of heart in each group were shown in Table 1. The cardiac morphologies were normal in the control group; the hearts of modeling group were not smooth and irregular in shape, the ventricular cavity was obviously enlarged and the wall was thickened and inelastic; the above symptoms improved gradually in the treatment group; the greater the dosage was, the more obviously the symptoms improved.
Group
Cases (ea.)
Heart surface
Cardiac morphology
Volume of ventricular cavity
Thickness of ventricular wall
Control group
12
Smooth
Regular
Normal
Uniform
Modeling group
12
Unsmooth
Enlarged and irregular
Obvious enlarged
Thickening and inelastic
Low dose group
12
Unsmooth
Enlarged and irregular
Enlarged
Thickening and slightly elastic
Medium dose group
12
Slight smooth
Slightly enlarged and irregular
Slightly enlarged
Slight thickening and elastic
High dose group
12
Relatively smooth
Unobvious thickening and relatively regular
Unobviously enlarged
Unobvious thickening and elastic
3.2 Testing results of HW/BW a
After 9 weeks of detection and modeling, the heart weight of each group was calculated and the HW/BW values were compared, as shown in Table 2. It could be observed that the heart weight and HW/BW value of rats in the modeling group, low, medium and high dose groups were significantly higher than those in the control group (P < 0.05). However, the heart weight and HW/BW values in the low, medium and high dose groups were significantly lower than those in the modeling group (P < 0.05). The heart weight and HW/BW values of rats in the medium and high dose groups were significantly lower than those in the modeling group and the low dose group (P < 0.05). And the heart weight and HW/BW values of rats in the high dose group were significantly lower than those in the modeling group, the low dose group and the medium dose group (P < 0.05). Note: compared with the control group, a P < 0.05; compared with the modeling group, b P < 0.05; compared with the low dose group, c P < 0.05; compared with the medium dose group, d P < 0.05.
Group
Cases (ea.)
Heart weight (g)
HW/BW (mg/100 g)
Control group
12
0.81 ± 0.15
240.14 ± 37.49
Modeling group
12
2.27 ± 0.21a
556.37 ± 40.16a
Low dose group
12
2.05 ± 0.18ab
517.79 ± 42.38ab
Medium dose group
12
1.85 ± 0.16abc
487.56 ± 34.24ab
High dose group
12
1.42 ± 0.15abcd
441.18 ± 39.79abcd
3.3 Testing results of serum lipid levels
The changes of contents of TC, TG, LDL-C, and HDL-C in the blood of rats in each group were compared, and the results were shown in Table 3. It could be observed that TC, TG and LDL-C in the modeling group and the low dose group were significantly higher than those in the control group (P < 0.05), while HDL-C was significantly lower than those in the control group (P < 0.05). TC, TG and LDL-C in the low, medium, and high dose groups were significantly lower than those in the modeling group (P < 0.05), while HDL-C was significantly higher than those in the modeling group (P < 0.05). TG and LDL-C in the medium dose group and TC, TG and LDL-C in the high dose group were significantly lower than those in the low dose group (P < 0.05). HDL-C in the high dose group was significantly higher than that in the low dose and medium dose groups (P < 0.05). And TG in the high dose group was significantly lower than that in the medium dose group (P < 0.05). Note: compared with the control group, a P < 0.05; compared with the modeling group, b P < 0.05; compared with the low dose group, c P < 0.05; compared with the medium dose group, d P < 0.05.
Group
Cases (ea.)
TC
TG
HDL-C
LDL-C
Control group
12
2.13 ± 0.35
1.52 ± 0.32
0.62 ± 0.15
0.78 ± 0.21
Modeling group
12
2.82 ± 0.36a
2.51 ± 0.35a
0.22 ± 0.16a
1.38 ± 0.24a
Low dose group
12
2.52 ± 0.25ab
2.23 ± 0.25ab
0.35 ± 0.14ab
1.14 ± 0.18ab
Medium dose group
12
2.36 ± 0.23b
1.88 ± 0.24abc
0.44 ± 0.12ab
0.95 ± 0.16bc
High dose group
12
2.17 ± 0.21bc
1.59 ± 0.22bcd
0.57 ± 0.13bcd
0.84 ± 0.15bc
F
/
11.60
27.12
16.03
19.67
3.4 Detection of apoptosis in rat cardiomyocytes
The differences of apoptosis index in rat myocardial tissue in each group were compared, as shown in Fig. 2. It could be observed that the apoptosis index of cardiomyocytes of rats in the modeling group, low, medium and high dose groups was significantly higher than that in the control group (P < 0.05). The apoptosis index of myocardial cells of rats in low, medium, and high dose groups was significantly lower than that in the modeling group (P < 0.05). The apoptosis index of myocardial cells of rats in medium and high dose groups was significantly lower than that in low dose group (P < 0.05). And the apoptosis index of cardiomyocytes of rats in the high dose group was significantly lower than that in the medium dose group (P < 0.05).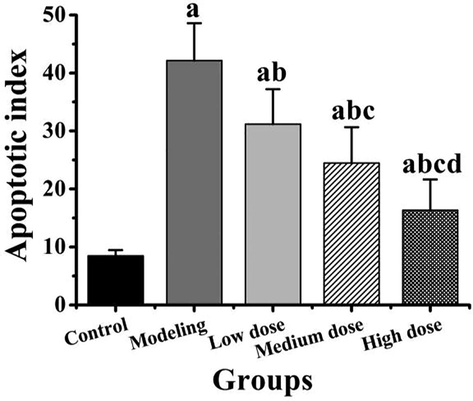
Comparison of apoptosis index of rat cardiomyocytes in different groups. Note: compared with the control group, a P < 0.05; compared with the modeling group, b P < 0.05; compared with the low dose group, c P < 0.05; compared with the medium dose group, d P < 0.05.
3.5 Testing results of Caspase-3, Bax and Bcl-2 protein expressions
The expression of Caspase-3, Bax and Bcl-2 proteins and the differences of Bcl-2/Bax in rat myocardial tissues in each group were compared, as shown in Fig. 3. As can be observed from the expression differences of Caspase-3 in Fig. 3B, the expression of Caspase-3 in modeling group, low, medium, and high dose group was significantly higher than that in control group (P < 0.05). The expression of Caspase-3 in the low, medium, and high dose groups was significantly lower than that in the modeling group (P < 0.05). And the expression of Caspase-3in medium and high dose group was significantly lower than that in low dose group (P < 0.05). As can be observed from the expression differences of Bax protein in Fig. 3C and the expression differences of Bcl-2 protein in Fig. 3D, the expression of Bax protein and Bcl-2 protein in modeling group, low, medium, and high dose group was significantly higher than that in control group (P < 0.05). The expression of Bax protein and Bcl-2 protein in the low, medium, and high dose groups was significantly lower than that in the modeling group (P < 0.05). The expression of Bax protein and Bcl-2 protein in medium and high dose group was significantly lower than that in low dose group (P < 0.05). And the expression of Bax protein and Bcl-2 protein in the high dose group was significantly lower than that in the medium dose group. As can be observed from Bcl-2/Bax in Fig. 3E, the Bcl-2 / Bax in modeling group and the low dose group were significantly lower than the control group (P < 0.05), while that of in the high dose group was significantly higher than the control group (P < 0.05). The Bcl-2 / Bax in the medium and high doses groups were significantly higher than the modeling group and the low dose group (P < 0.05), and that of in the high dose group was significantly higher than the medium dose group (P < 0.05).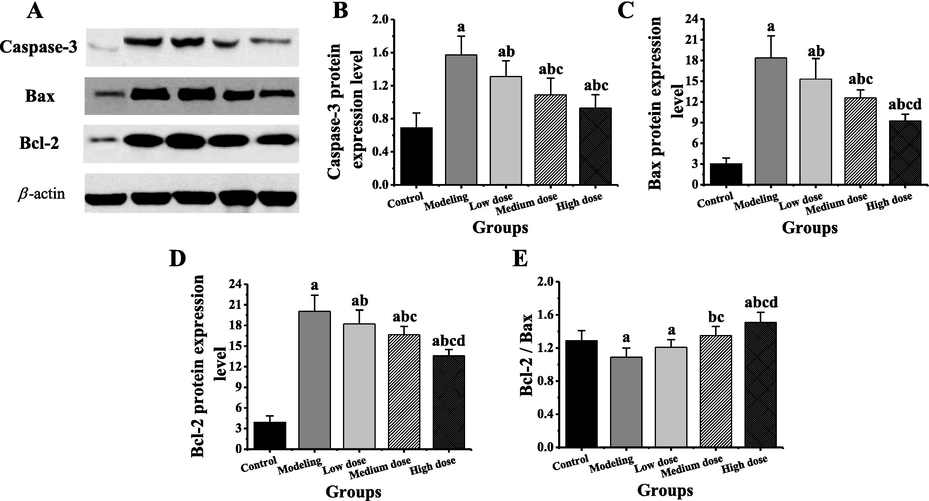
Comparison of expression of target gene protein in myocardial tissue of different groups of rats. Note: compared with the control group, a P < 0.05; compared with the modeling group, b P < 0.05; compared with the low dose group, c P < 0.05; compared with the medium dose group, d P < 0.05.
4 Discussion
This study has found that the modeling group had a rapid increase in weight, a decrease activity and diet, dyspnea, purple lips and tongues, unsmooth heart surface, expanded heart volume and cavity, thickening of ventricular wall, and poor elasticity. The symptoms improved gradually after the application of atorvastatin, and the greater the dose was, the more obvious symptoms improved. The body weight, heart weight, HW/BW and cardiomyocyte apoptosis index of the modeling group were significantly higher than those of the control group (P < 0.05). After the administration of atorvastatin, the body weight, heart weight, HW/BW, cardiomyocyte apoptosis index of the rats in each treatment group were significantly lower than those of the control group (P < 0.05). From the aspect of blood lipid, the TC, TG and LDL-C levels in the modeling group were significantly higher than those of the control group, but the HDL-C level was significantly lower than that of the control group (P < 0.05); after the treatment of atorvastatin, the TC, TG and LDL-C levels were significantly lower than those of the modeling group, and the HDL-C level was significantly higher than that of the modeling group (P < 0.05). In the early stage of cholesterol synthesis, statins can compete to inhibit related enzymes, reduce cholesterol production, increase LDL-C receptors, increase the combination of LDL-C and its receptors, accelerate LDL-C metabolism, reduce LDL-C, TC and TG, and increase HDL-C (Orlic et al., 2014; Parguiña et al., 2011). Indicating that atorvastatin could regulate the level of blood fat in rats.
Abnormal stimulation of endonuclease during apoptosis of cardiomyocytes may lead to abnormal gene regulation, blocked expression and protein synthesis (Kunapuli et al., 2006; Dorn, 2009). In the event of cardiomyocyte apoptosis, the insufficiency of myocardial contractile function eventually leads to heart failure. In this process, the cysteinyl aspartate specific proteinase (Caspase) family and the B-cell lymphoma-2 (Bcl-2) family play an important role in cardiomyocyte apoptosis (Liu et al., 2016; Sheng et al., 2014). A large number of studies have shown that, when cardiomyocyte apoptosis occurs, Caspase-3 is activated (Zhou et al., 2018). Bcl-2 and Bax are homologous proteins, and Bcl-2 genes can inhibit apoptosis and promote cell survival (Chen et al., 2013; Tu et al., 2012). Bax is an apoptosis-promoting gene and its overexpression can antagonize the protective effect of Bcl-2 on cells and promote apoptosis (Guo and Li, 2018). This study found the Caspase-3 and Bax levels in the modeling group was significantly higher than those of the control group, and the Bcl-2 and Bcl-2/Bax levels were significantly lower than those of the control group (P < 0.05), which were similar to those of most literatures (Lv et al., 2012; Yang et al., 2006). In combination with relevant literature, it indicates (Wang et al., 2016) that atorvastatin can inhibit the expression of Caspase-3 protein, which is realized by activating phosphatidylinositol-3-kinase (PI3K). After PI3K is activated, the downstream protein kinase B (PKB, also known as Akt) is activated as well. The Akt signal channel can lower the expression of Bax protein and raise the expression of Bcl-2 protein, thus inhibiting the release of cytochrome C (Cyt C), eventually achieving the goal of slowing down the cardiomyocyte apoptosis and improving the myocardial infarction symptoms.
5 Conclusion
In this study, the therapeutic effects of different doses of atorvastatin on the rat model of myocardial infarction were investigated, but only the effects of three doses of atorvastatin on the rat model of myocardial infarction were tested, and it was concluded that the treatment effect of high dose atorvastatin was the best. The optimal concentration range of atorvastatin has not been found, so further studies on the side effects of excess atorvastatin can be conducted.
In conclusion, atorvastatin can inhibit excessive growth of body weight and heart weight of AMI rats, and reduce the TC, TG and LDL-C levels in blood fat, increase the HDL-C level to regulate blood fat, inhibit the expressions of Caspase-3 and Bax gene, raise the expression of Bcl-2 gene and finally inhibit the apoptosis of cardiomyocyte. It is believed that atorvastatin will be more widely applied as atorvastatin treatment of AMI will be understood increasingly deeply. Therefore, the results of this study can provide theoretical basis for the subsequent treatment of myocardial infarction with atorvastatin.
Declaration of Competing Interest
The authors declare that they have no known competing financial interests or personal relationships that could have appeared to influence the work reported in this paper.
References
- Safety of atorvastatin in Asian patients within clinical trials. Cardiovasc. Ther.. 2016;34(6):431-440.
- [Google Scholar]
- Effect of stellate ganglion block on cardiomyocyte apoptosis and expression of Bcl-2/Bax protein in spontaneously hypertensive rats. Zhong Nan Da Xue Xue Bao Yi Xue Ban. 2013;38(9):896-901.
- [Google Scholar]
- Apoptotic and non-apoptotic programmed cardiomyocyte death in ventricular remodelling. Cardiovasc. Res.. 2009;81(3):465-473.
- [Google Scholar]
- Distance from the nearest hospital and mortality for acute miocardial infarction (AMI) in Sicily Region (Southern Italy) Epidemiol. Prev.. 2014;38(6):373-378.
- [Google Scholar]
- Three-pronged innovation to improve care for acute myocardial infarction patients in Cuba. MEDICC Rev.. 2010;12(3):11-16.
- [Google Scholar]
- Tanshinone modulates the expression of Bcl-2 and Bax in cardiomyocytes and has a protective effect in a rat model of myocardial ischemia-reperfusion. Hellenic J. Cardiol.. 2018;59(6):323-328.
- [Google Scholar]
- Current evidence of the efficacy of cell-based therapies in heart failure. Circ. J.. 2015;79(2):229-236.
- [Google Scholar]
- Atorvastatin attenuates atherosclerotic plaque destabilization by inhibiting endoplasmic reticulum stress in hyperhomocysteinemic mice. Mol. Med. Rep.. 2016;13(4):3574-3580.
- [Google Scholar]
- Coronary thrombi neovascularization in patients with ST-elevation myocardial infarction - clinical and angiographic implications. Thromb. Res.. 2014;134(5):1038-1045.
- [Google Scholar]
- “How do cardiomyocytes die?” apoptosis and autophagic cell death in cardiac myocytes. J. Card Fail.. 2006;12(5):381-391.
- [Google Scholar]
- Coronary microembolization induces cardiomyocyte apoptosis in swine by activating the LOX-1-dependent mitochondrial pathway and caspase-8-dependent pathway. J. Cardiovasc. Pharmacol. Ther.. 2016;21(2):209-218.
- [Google Scholar]
- Myocardial infarction: symptoms and treatments. Cell. Biochem. Biophys.. 2015;72(3):865-867.
- [Google Scholar]
- Berberine inhibits doxorubicin-triggered cardiomyocyte apoptosis via attenuating mitochondrial dysfunction and increasing Bcl-2 expression. PLoS One. 2012;7(10):e47351
- [Google Scholar]
- Experimental autoimmune myocarditis produced by adoptive transfer of splenocytes after myocardial infarction. Circ. Res.. 1998;82(4):458-463.
- [Google Scholar]
- The randomized physiologic assessment of thrombus aspiration in patients with acute ST-segment elevation myocardial infarction trial (PATA STEMI): study rationale and design. J. Interv. Cardiol.. 2014;27(4):341-347.
- [Google Scholar]
- Variations in platelet proteins associated with ST-elevation myocardial infarction: novel clues on pathways underlying platelet activation in acute coronary syndromes. Arterioscler. Thromb. Vasc. Biol.. 2011;31(12):2957-2964.
- [Google Scholar]
- Multisite phosphorylation of Bcl-2 via protein kinase Cδ facilitates apoptosis of hypertrophic cardiomyocytes. Clin. Exp. Pharmacol. Physiol.. 2014;41(11):891-901.
- [Google Scholar]
- Anti-apoptotic effect of atorvastatin, a 3-hydroxy-3-methylglutaryl coenzyme areductase inhibitor, on cardiac myocytes through protein kinase C activation. Clin. Exp. Pharmacol. Physiol.. 2004;31(5–6):360-364.
- [Google Scholar]
- The effect of mitochondrial oxidative stress and the expression of Bcl-2 and Baxproteins on cardiomyocyte apoptosis during hypoxia postconditioning. Zhonghua Xin Xue Guan Bing Za Zhi. 2012;40(6):516-521.
- [Google Scholar]
- Universal definition of myocardial infarction. J. Am. Coll. Cardiol.. 2007;50(22):2173-2195.
- [Google Scholar]
- Atorvastatin inhibits myocardial apoptosis in a swine model of coronary microembolization by regulating PTEN/PI3K/Akt signaling pathway. Cell Physiol. Biochem.. 2016;38(1):207-219.
- [Google Scholar]
- Beneficial effects of carvedilol on cardiomyocyte apoptosis and bcl-2/baxexpression after acute myocardial infarction an experiment with rats. Zhonghua Yi Xue Za Zhi. 2006;86(13):919-922.
- [Google Scholar]
- MicroRNA-21 abrogates palmitate-induced cardiomyocyte apoptosis through caspase-3/NF-κB signal pathways. Anatol. J. Cardiol.. 2018;20(6):336-346.
- [Google Scholar]


