

Translate this page into:
Effect of production parameters and inhibitory activity of antimicrobial compounds produced by co-cultured strains of Streptomyces xinghaiensis-OY62 and S. rimosus-OG95
⁎Corresponding author. faithfulmuyiwa@yahoo.co.uk (O.M. Adeyemo)
-
Received: ,
Accepted: ,
This article was originally published by Elsevier and was migrated to Scientific Scholar after the change of Publisher.
Peer review under responsibility of King Saud University.
Abstract
Due to emergence and re-emergence of resistant pathogenic microorganisms, there is need to develop more potent antimicrobial metabolites with broad spectrum antimicrobial activity. Hence, the strains of Streptomyces xinghaiensis-OY62 (KU934248) and Streptomyces rimosus-OG95 (KU934251) were co-cultured for the production of antimicrobial metabolites using starch casein broth by submerged fermentation. Effect of production parameters on antimicrobial activity was studied using standard methods. Purification of the antimicrobial extract was carried out using column and thin layer chromatography. The Minimum Inhibitory Concentration was done by macro broth dilution method. Bioactive compounds were characterized using thin layer chromatography; Fourier transformed infraRed spectrophotometer and gas chromatography-mass spectrophotometer. The best antimicrobial activity was observed at pH 8.0, temperature of 45 °C, in starch casein broth supplemented with sodium chloride concentration of 0.6% (w/v), casein + KNO3 as nitrogen source, in the presence or absence of carbon source and a period of fifteen days of incubation. The retention factor of the partially purified antimicrobial extract was 0.97. Functional groups such as hydroxyl, aromatic rings, carboxylic acid, amides and carbonyls were detected. Eight different antimicrobial metabolites were identified and characterized. Higher quantity (41.4%) of dibutyl phthalate was produced by the co-cultured strains of the Streptomyces. The antimicrobial metabolites produced by co-cultured strains of Streptomyces xinghaiensis-OY62 and Streptomyces rimosus-OG95 exhibited broad spectrum antimicrobial activity against indicator strains. The MIC and MBC ranged between 3.12 mg/L to 6.25 mg/L and 12.5 mg/L to 25.0 mg/L respectively.
Keywords
Effect of production parameters
Broad spectrum antimicrobial activity
Chemical characterization
Minimum Inhibitory Concentration (MIC)

1 Introduction
Actinomycete is made up of a large complex group of bacteria containing many genera. They are Gram positive and structurally filamentous like fungi. They are aerobic and are predominantly isolated from soil. They are known to produce a wide range of secondary metabolites (Berdy, 1984). Actinomycetes, especially those of the genus Streptomyces have been reported to produce antimicrobial metabolites such as phenol 2,4-bis (1,1-dimethylethyl) and dibutyl phthalate and which has been reported to possess antimicrobial property (Maheshwari et al., 2016, Mangamuri et al., 2016). Unsaturated alkyl antimicrobial compounds such as Nonadecene and Tetradecene have been identified in the solvent extract of different strains of Streptomyces (Jalaluldeen et al., 2015, Kalaivani et al., 2013). Previous report by Silber et al. (2016) showed that bis (2-ethylhexyl) phthalate possessed inhibitory property against Micrococcus luteus, Vibrio harveyi and Pseudoaltermones piscida. Therefore, it is very important to scientifically approach the treatment of microbial infections due to re-emerging pathogenic organisms (Wright and Sutherland, 2007). This scientific approach include the discovery of antibiotic producing bacteria as well as mining of yet to uncovered natural products (Wright and Sutherland, 2007). Hence, this study was carried out to study the effect of production parameters on antimicrobial activity against indicator strains, to enhance production of antimicrobial metabolites by co-culturing the two strains, characterize antimicrobial metabolites produced by co-cultured strains of Streptomyces xinghaiensis OY-62 and Streptomyces rimosus-OG95 and to determine their antimicrobial activity against indicator strains.
2 Material and methods
2.1 Actinomycetes strains used for the present study
Two strains of Streptomyces used for the study, Streptomyces xinghaiensis-OY62 (KU934248) and Streptomyces rimosus-OG95 (KU934251) were obtained from the stock cultures at Microbial Physiology and Biochemistry laboratory, Department of Microbiology, University of Ibadan.
2.2 Indicator strains
Four indicator strains: Bacillus subtilis ATCC 6633, Enterococcus faecalis ATCC 29212, Campylobacter jejuni ATCC 33291 and Pseudomonas aeruginosa ATCC 9077 were used for agar well diffusion assay while seven indicator strains that included Bacillus cereus ATCC 10876, Escherichia coli ATCC 35218, Klebsiella pneumoniae ATCC 8309, Staphylococcus aureus ATCC 25923, Salmonella typhimurium ATCC 11311, Pseudomonas aeruginosa ATCC 9077 and Candida albicans ATCC 10231 were used for the determination of Minimum Inhibitory and Minimum Bactericidal Concentrations.
2.3 Effect of production parameters on the antimicrobial activity of co-cultured strains of Streptomyces xinghaiensis-OY62 and Streptomyces rimosus-OG95 on indicator strains
The basal medium used for the assessment of the effect of production parameters of co-cultured strains of Streptomyces on the indicator strains was starch casein broth (g/L): Soluble starch 15.0, potassium phosphate dibasic 2.0, Potassium nitrate 2.0, Sodium chloride 2.0, Casein 0.30, Magnesium sulphate heptahydrate 0.05, Calcium carbonate 0.02, Iron II sulphate heptahydrate 0.01 at pH 7.2 (Sharon et al., 2014).
The effect of pH (4.0, 5.0, 6.0, 7.0, 8.0 and 9.0), sodium chloride concentration (0.0, 0.2, 0.4, 0.6, 0.8 and 1.0), temperature (4 °C, 28 °C, 35 °C, 45 °C, 55 °C and 60 °C), carbon source (glucose, galactose, maltose, sucrose, glycerol, starch and control), Nitrogen source (ammonium sulphate, peptone, yeast extract, malt extract, casein, potassium nitrate, casein + potassium nitrate and control) and incubation period in days (3, 5, 7, 10 and 15) on antimicrobial activity of co-cultured strains of Streptomyces xinghainesis-OY62 and S. rimosus-OG95 was studied by inoculating 500 mL of the basal medium with 2.5% (v/v) each of 24 h old culture of Streptomyces xinghainesis-OY62 and S. rimosus-OG95. However, the best result of a previously determined parameter was kept constant in the next parameter under study.
The inoculated flasks were incubated at 28–30 °C on an Orbital Shaker (Platform Shaker MSZ-100A) at 150 rpm for seven days, after which the incubation was terminated. The fermented broth was filtered using Whatman No. 1 and treated with 50% (w/v) ammonium sulphate, so as to remove interfering metabolites from the antimicrobial extract. The mixture was centrifuged at 5000 rpm for 20 min (Wincom 80-2). Furthermore, equal volume (1:1) of the supernatant and ethyl acetate were vigorously shaken together for 30 min in separating funnel to effect the extraction of the antimicrobial metabolites. The separating funnel with the mixture was further allowed to stand for another 30 min. The supernatant was collected and concentrated at 60 °C using Rotary Evaporator (Rotatory Evaporator, RE-52A). The crude antimicrobial extract was used for agar well diffusion assay.
2.4 Agar well diffusion assay
Agar well diffusion method was used to determine the antimicrobial activity of the co-cultured strains of Streptomyces used in this study against indicator strains (Kumari et al., 2013). A well of 6.0 mm was made at the center of petri dishes containing Mueller Hinton agar. These plates had been earlier swabbed with a 24 h culture of Bacillus subtilis ATCC 6633, Enterococcus faecalis ATCC 29212, Campylobacter jejuni ATCC 33291 and Pseudomonas aeruginosa ATCC 9077 that have their turbidity adjusted to 0.5 McFarland standards (1.5 × 10⁸ CFU/mL). Each well was filled with crude extract (50.0 μL) and the plates were incubated at 37 °C (Memmert 854, Schnabach, Germany). The zones of inhibition were measured in triplicate using ruler. The 6.0 mm of the well was subtracted from the readings.
2.5 Partial purification and characterization of the antimicrobial compounds produced by co-cultured Streptomyces xinghaiensis-OY62 and Streptomyces rimosus-OG95
Eight liters of starch casein broth was inoculated with 2.5% (v/v) 24 h seed inoculum of each Streptomyces xinghaiensis-OY62 and S. rimosus-OY95 and incubated at 45 °C. After the incubation period, the fermented broth was separated from the mycelial debris by filtration using Whatman No. 1 filter paper. The filtrate was treated with 50% (w/v) ammonium sulphate (Kandula and Terli, 2013). The treated filtrate was centrifuged at 5000 rpm for 20 min. The supernatant was mixed with equal volume (1:1) of ethyl acetate and shaken vigorously in a separating funnel for 30 min for extraction of the antimicrobial metabolites, after which it was allowed to stand for 30 min. The supernatant containing the antimicrobial metabolites was collected and concentrated at 60 °C using a Rotary evaporator (Rotary evaporator, RE-52A) (El-Naggar et al., 2001). The crude concentrate was then transferred to a water bath at 50 °C to dry off the remaining solvent.
One gram of the crude antimicrobial extract was dissolved in 3.0 mL ethyl acetate. The dissolved crude antimicrobial compound was loaded into a silica gel (100–200 mesh) column chromatography, column dimension 2.0 cm inner diameter × 25 cm length. The column was eluted with n-hexane and ethyl acetate (1:4 v/v) and thirty fractions, 3.0 mL each was collected. All fractions were screened for the presence of antimicrobial compounds and fractions within the range showing antimicrobial activity were pooled together and subjected to the second round of purification using column chromatography. The partially purified antimicrobial compounds was loaded into the silica gel column of 2.0 cm inner diameter and 25.0 cm column length and eluted with hexane:ethyl acetate (1:4 v/v). Fractions were collected and spotted on silica gel coated plates. Fractions that possessed activity and similar retention factor were pooled together concentrated at 60 °C using Rotary evaporator (Rotary evaporator, RE-52A). Spots complex were identified when plate were exposed to iodine crystals. The partially purified antimicrobial extract was used for Minimum Inhibitory Concentration (MIC) assay against indicator strains and chemical characterization.
2.6 Chemical characterization of the antimicrobial compounds produced by co-cultured strains of Streptomyces xinghaiensis OY62 and S. rimosus OY95
The chemical characterization of the partially purified antimicrobial compounds produced by Streptomyces xinghaiensis OY62 and Streptomyces rimosus OG95 was carried using Fourier transformed infrared (FTIR) spectrophotometer. The sample was homogenized with potassium bromide (KBr). The spectrum of the partially purified antimicrobial compound was recorded on Shimadzu AUX220 spectrophotometer that was in the range of 4000 cm−1–400 cm−1 (Sanghvi et al., 2014). The chemical structures, formulae and identification were determined using gas chromatography–mass spectrophotometer (GC–MS) Shimadzu QP 2010 (Anupriya et al., 2016).
2.7 Determination of Minimum Inhibitory Concentrations (MICs) and Minimum Bactericidal Concentrations of the partially purified antimicrobial compounds
The Minimum Inhibitory Concentrations (MICs) of the partially purified antimicrobial extract was determined using macro broth dilution method as described by Andrews (2001). The tubes without turbidity (no growth) after MIC were read and streaked on nutrient agar for bacterial indicator strains and the test tube of Candida albicans was streaked on potato dextrose agar. The streaked plates were incubated at 37 °C. The plates were observed for growth after 24 h and the plates without growth inoculated with the lowest concentrations of the antimicrobial extract was recorded as the minimum bactericidal concentrations (MBCs).
3 Results
Effect of pH: The pH 8.0 gave the highest zones of inhibition against indicator strains ranging between 24.0 mm and 38.7 mm (Table 1). Low antimicrobial activity (8.7 mm and 13.3 mm) was recorded against indicator strains at extreme pH 4.0 and pH 9.0.
Indicator strains
pH/Zone of inhibition (mm)
4.0
5.0
6.0
7.0
8.0
9.0
Enterococcus faecalis ATCC 29212
*18.3 ± 0.5b
20.7 ± 0.3b
25.3 ± 0.4a
26.7 ± 0.5c
31.3 ± 0.7c
26.3 ± 0.6a
Campylobacter jejuni ATCC 33291
23.3 ± 0.4a
25.3 ± 0.2a
26.3 ± 0.7a
33.7 ± 0.4a
35.3 ± 0.1b
25.7 ± 0.5a
Bacillus subtilis ATCC 6633
11.3 ± 0.7c
15.7 ± 0.3c
21.0 ± 0.2b
29.7 ± 0.6b
38.7 ± 0.6a
13.3 ± 0.4c
Pseudomonas aeruginosa ATCC 9077
8.7 ± 0.5d
16.3 ± 0.5c
15.3 ± 0.7c
19.0 ± 0.5d
24.0 ± 0.3d
20.3 ± 0.5a
Effect of sodium chloride: The inhibition zones of indicator microorganisms by the antimicrobial metabolites of co-cultured strains of Streptomyces xinghaiensis-OY62 and S. rimosus-OG95 varied with different concentrations of sodium chloride. However, the highest zone of inhibition was observed against indicator strains at 0.6% (w/v) (Table 2).
Indicator strains
Sodium chloride concentration (% w/v)/Zone of inhibition (mm)
0
0.2
0.4
0.6
0.8
1.0
Enterococcus faecalis ATCC 29212
*13.6 ± 0.7c
15.3 ± 0.4c
18.4 ± 0.5b
20.7 ± 0.2c
11.3 ± 0.4c
18.7 ± 0.3b
Campylobacter jejuni ATCC 33291
27.3 ± 0.6a
19.7 ± 0.5a
22.7 ± 0.3a
27.7 ± 0.7a
22.7 ± 0.5a
22.3 ± 0.4a
Bacillus subtilis ATCC 6633
14.7 ± 0.7c
18.0 ± 0.1b
22.30.4a
23.7 ± 0.1b
12.7 ± 0.3c
11.7 ± 0.8c
Pseudomonas aeruginosa ATCC 9077
18.3 ± 0.4b
20.3 ± 0.7a
17.7 ± 0.9b
24.3 ± 0.5b
19.3 ± 0.4b
16.3 ± 0.5b
Effect of temperature: Table 3 showed the effect of temperature on the antimicrobial activity of the co-cultured stains of Streptomyces. Highest zone of inhibition of 32.7 mm was read at 45 °C against indicator strain while extreme temperatures of 4 °C and 60 °C gave low antimicrobial activity of 17.3 mm and 8.7 mm respectively.
Indicator strains
4
28
35
45
55
60
Enterococcus faecalis ATCC 29212
*21.7 ± 0.5a
27.7 ± 0.3a
28.0 ± 0.2a
32.7 ± 0.5a
24.3 ± 0.4c
14.3 ± 0.5c
Campylobacter jejuni ATCC33291
21.3 ± 0.2a
21.7 ± 0.6b
27.7 ± 0.7a
32.3 ± 0.3a
32.3 ± 0.1a
20.3 ± 0.3a
Bacillus subtilis ATCC 6633
17.3 ± 0.5b
19.3 ± 0.5c
21.7 ± 0.7b
27.7 ± 0.4b
27.7 ± 0.5b
8.7 ± 0.5d
Pseudomonas aeruginosa ATCC 9077
21.3 ± 0.7a
21.3 ± 0.2b
22.7 ± 0.1b
32.7 ± 0.5a
32.7 ± 0.6a
17.7 ± 0.4b
Effect of carbon source: All the carbon sources used for the study supported antimicrobial production and activity (Table 4, Plates 2–4). However, the fermented broth without any carbon source (the negative control) gave the highest zone of inhibition against the indicator strains. The zones of inhibition ranged between 27.7 mm and 43.3 mm (Table 4, Plate 1).
Test pathogens
Carbon sources/Zone of inhibition (mm)
Control
Glucose
Galactose
Maltose
Sucrose
Glycerol
Starch
Enterococcus faecalis ATCC 29212
*41.3 ± 0.7b
38.8 ± 0.5a
32.3 ± 0.7a
33.3 ± 0.5a
36.3 ± 0.7a
29.3 ± 0.6b
32.7 ± 0.7a
Campylobacter jejuni ATCC 33291
30.0 ± 0.9c
29.3 ± 0.8c
24.3 ± 0.4c
25.7 ± 0.9c
29.7 ± 0.6b
27.3 ± 0.5c
31.3 ± 0.5a
Bacillus subtilis ATCC 6633
27.7 ± 0.6d
29.7 ± 0.6c
25.3 ± 0.6c
28.7 ± 0.7b
25.7 ± 0.4c
25.7 ± 0.6d
23.7 ± 0.7c
Pseudomonas aeruginosa ATCC 9077
43.3 ± 0.7a
34.3 ± 0.7b
27.7 ± 0.5b
28.0 ± 0.9b
29.3 ± 0.6b
33.3 ± 0.6a
27.7 ± 0.7b
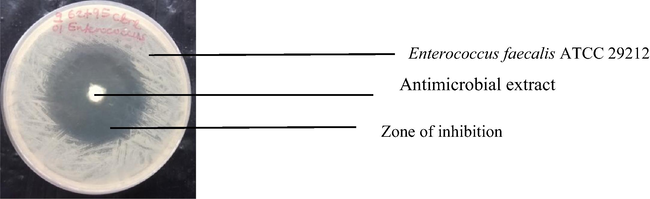
Inhibition of Enterococcus faecalis ATCC 29212 by antimicrobial extract of co-cultured strains of S. xinghaiensis-OY62 and S. rimosus-OG95.
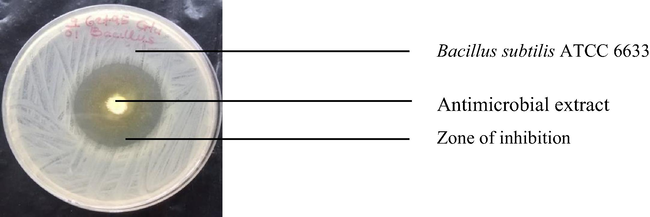
Inhibition of Bacillus subtilis ATCC 6633 by antimicrobial extract of co-cultured strains of S. xinghaiensis-OY62 and S. rimosus-OG95.
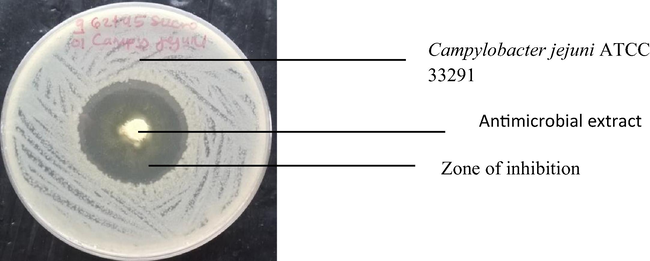
Inhibition of Campylobacter jejuni ATCC 33291 by antimicrobial extract of co-cultured strains of S. xinghaiensis-OY62 and S. rimosus-OG95.
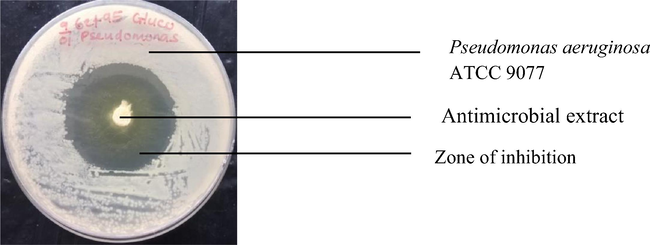
Inhibition of Pseudomonas aeruginosa ATCC 9077 by antimicrobial extract of co-cultured strains of S. xinghaiensis-OY62 and S. rimosus-OG95.
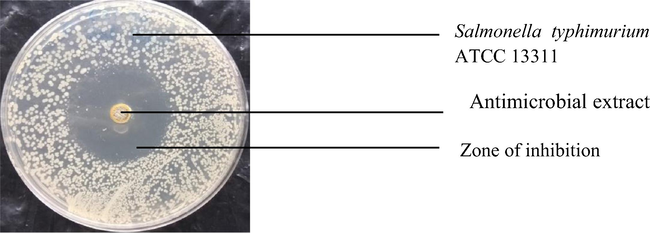
Inhibition of Salmonella typhimurium ATCC 13311 by antimicrobial extract of co-cultured strains of S. xinghaiensis-OY62 and S. rimosus-OG95.
Effect of nitrogen source: The highest antimicrobial activity of 38.3 mm was recorded against Enterococcus faecalis ATCC 29212 in the medium supplemented with both casein and potassium nitrate. However, neither casein nor potassium nitrate singly supported good antimicrobial activity by combined the Streptomyces strains (Table 5).
Indicator strains
Nitrogen sources/Zone of inhibition (mm)
Control
KNO3
NH4NO3
Yeast extract
Malt extract
Peptone
Casein
Casein + KNO3
Enterococcus faecalis ATCC 29212
*32.3 ± 0.5a
28.7 ± 0.3a
28.3 ± 0.2a
27.7 ± 0.5a
42.0 ± 0.1a
30.7 ± 0.5a
32.7 ± 0.2a
38.3 ± 0.5a
Campylobacter jejuni ATCC 33291
18.7 ± 0.3b
17.7 ± 0.1c
16.7 ± 0.6c
16.3 ± 0.4c
23.7 ± 0.7d
17.0 ± 0.4c
19.3 ± 0.6c
29.3 ± 0.3c
Bacillus subtilis ATCC 6633
16.0 ± 0.8c
18.7 ± 0.5c
13.0 ± 0.2d
16.3 ± 0.3c
26.7 ± 0.5c
16.0 ± 0.2d
18.7 ± 0.4c
29.7 ± 0.5c
Pseudomonas aeruginosa ATCC 9077
18.3 ± 0.5b
21.7 ± 0.4b
20.3 ± 0.6b
18.3 ± 0.5b
30.0 ± 0.9b
22.3 ± 0.7b
22.7 ± 0.5b
34.3 ± 0.5b
Effect of incubation period: The results presented in Table 6 indicated that the highest antimicrobial activity against indicator strains by co-cultured S. xinghaiensis-OY62 and S. rimosus-OG95 was observed by the fifteenth day of incubation (Table 6). The zones of inhibition against indicator strains varied between 23.7 mm and 32.7 mm (Table 6).
Indicator strains
Incubation period/Zone of inhibition (mm)
Day3
Day5
Day7
Day10
Day15
Enterococcus faecalis ATCC 29212
*15.3 ± 0.58a
15.7 ± 0.58a
17.7 ± 0.58a
26.7 ± 0.58a
32.7 ± 0.58a
Campylobacter jejuni ATCC 33291
12.7 ± 0.58b
12.7 ± 0.58bc
13.3 ± 0.58c
27.3 ± 0.58a
31.3 ± 0.58b
Bacillus subtilis ATCC 6633
8.7 ± 0.58d
10.7 ± 0.58c
14.7 ± 0.58b
20.7 ± 0.58c
23.7 ± 0.58d
Pseudomonas aeruginosa ATCC 9077
10.3 ± 0.58c
13.7 ± 0.58b
14.7 ± 1.15b
22.7 ± 0.58b
27.7 ± 0.58c
3.1 Partial purification and characterization of the antimicrobial compounds
The retention factor (Rf) of the partially purified antimicrobial extract produced by co-cultured S. xinghaiensis-OY62 and S. rimosus-OG95 was 0.97. The FTIR spectrum showed the presence of functional groups such as aromatic rings at wave numbers 484.15 cm−1 and 651.96 cm−1, carbonyls and amide at 1728.28 cm−1 and 3729.81 cm−1 (Fig. 1).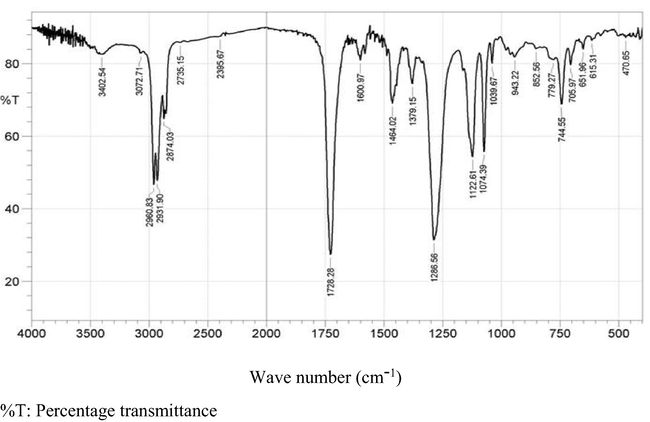
FTIR spectrum of antimicrobial compounds produced by co-cultured Streptomyces xinghaiensis-OY62 and Streptomyces rimosus-OG95.
The GC–MS spectrum (Fig. 2) of the partially purified antimicrobial compounds synthesized by co-cultured S. xinghaiensis-OY62 and S. rimosus-OG95 showed that ten antimicrobial metabolites were identified and characterized (Table 7, Fig. 3a–h). Dibutyl phthalate was mostly produced (41.4%) followed by Bis (2ethylhexyl) phthalate having 37.9%. The least produced antimicrobial metabolite was Phenol, 2,4-bis (1,1-dimethylethyl)- that had 1.65% (Table 7). R. time: Retention time.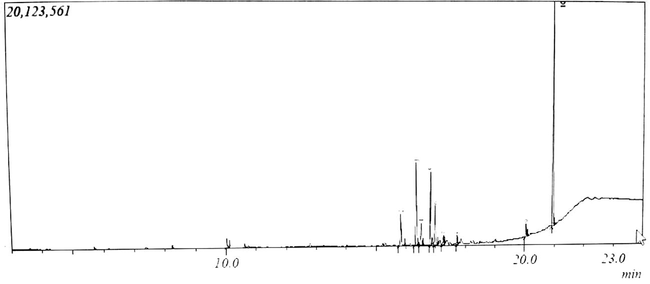
GC–MS spectrum of antimicrobial compounds produced by co-cultured strains of Streptomyces xinghaiensis-OY62 and Streptomyces rimosus-OG95.
S/No.
R. Time
Area%
Height%
Molecular weight
Chemical formula
Name
1
10.035
1.65
1.85
206
C14H22O
Phenol, 2,4-bis (1,1-dimethylethyl)-
2
15.826
7.70
6.21
278
C16H22O4
1,2-Benzenedicarboxylic acid, bis (2-methylpropyl ester
3
16.352
17.64
16.06
278
C16H22O4
Di butyl phthalate
4
16.510
4.96
4.33
292
C17H24O4
Phthalic acid, isobutyl 2-pentyl ester
5
16.832
14.93
14.31
278
C16H24O4
Di butyl phthalate
6
16.985
8.81
7.75
278
C16H24O4
Di butyl phthalate
7
17.258
2.27
1.91
296
C19H36O2
9-Octadecenoic acid, methyl ester, (E)-
8
17.722
1.84
1.86
334
C20H30O4
1,2-Benzenedicarboxylic acid, butyl octyl ester
9
20.050
2.31
2.54
281
C18H35NO
9-Octadecenamide
10
20.945
37.88
43.17
390
C24H38O4
Bis (2-ethylhexyl) phthalate
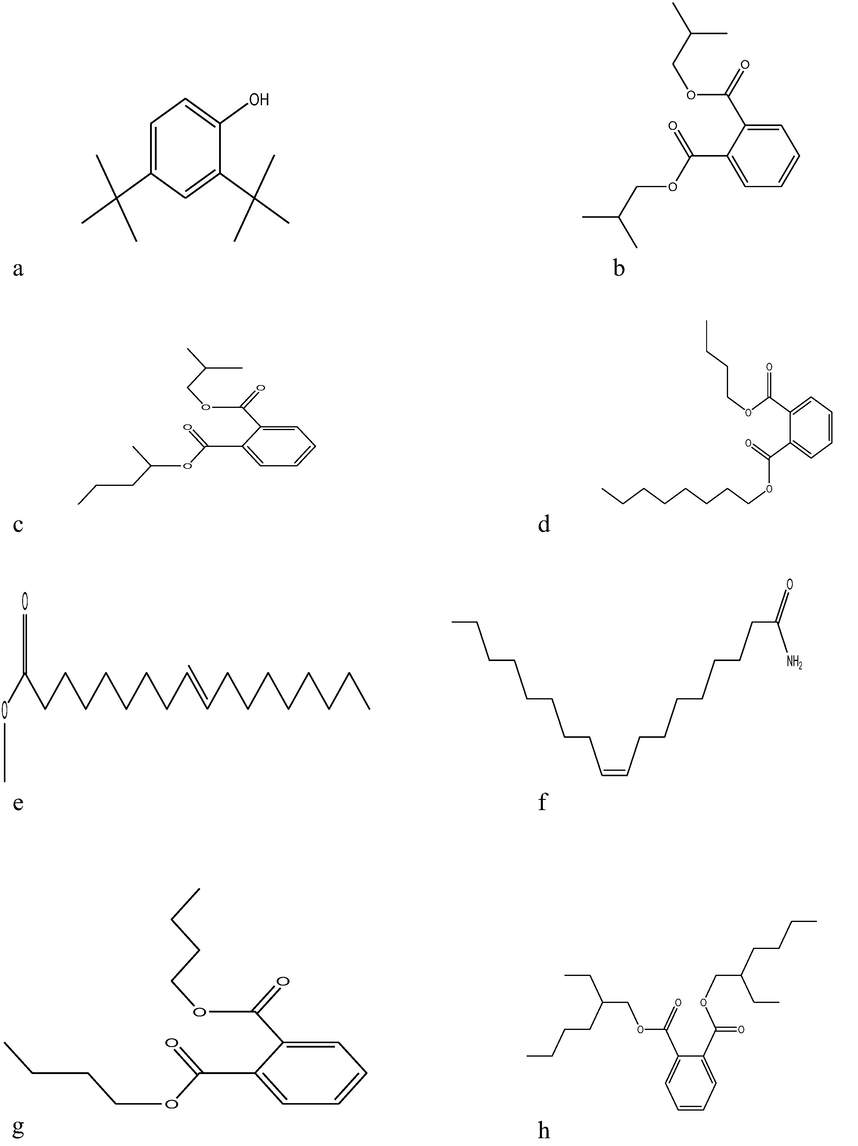
(3a–3h) Chemical structures of antimicrobial compounds produced by co-cultured strains of S. xinghaiensis-OY62 and S. rimosus-OG95 using GC–MS spectral analysis: (3a). Phenol, 2, 4-bis (1,1-dimethyl, (3b) 1,2-Benzene dicarboxylic acid bis (2-methyl propyl ester, (3c) Phthalic acid isobutyl 2-pentyl ester, (3d) 1,2-Benzene dicarboxylic acid, butyl octyl ester (3e) 9-Octadecenoic acid, methyl ester, (E), (3f) 9-Octadecenamide, (3g) Dibutyl phthalate and (3h) Bis (2-ethylhexyl) phthalate.
3.2 Minimum Inhibitory Concentration (MIC) and Minimum Bactericidal Concentration (MBC)
The Minimum Inhibitory Concentration (MIC) and Minimum Bactericidal Concentration (MBC) of partially purified antimicrobial extract produced co-cultured strains of S. xinghaiensis-OY62 and S. rimosus-OG95 ranged between 3.12 mg/L and 12.5 mg/L and 12.5 mg/L to 25.0 mg/L respectively against the indicator strains. However, gentamicin (control) had MIC that ranged between 0.78 mg/L to 3.12 mg/L and MBC of 1.56 mg/L to 6.25 mg/L against indicator strains (Table 8).
Indicator strain
Antimicrobial extract
Gentamicin
MIC (mg/L)
MBC (mg/L)
MIC (mg/L)
MBC (mg/L)
Bacillus cereus ATCC 10876
3.12
12.5
0.78
1.56
Staphylococcus aureus ATCC 700699
3.12
12.5
0.78
1.56
Escherichia coli ATCC 35218
3.12
12.5
3.12
6.25
Salmonella typhimurium ATCC 13311
6.25
12.5
0.78
1.56
Klebsiella pneumoniae ATCC 8309
6.25
12.5
0.78
1.56
Pseudomonas aeruginosa ATCC 9077
6.25
25
0.78
1.56
4 Discussion
The best antimicrobial activity by co-cultured strains of S. xinghaiensis-OY62 and S. rimosus-OG95 against indicator strains which was observed at pH 8.0 is similar to the observation of Bhosale et al. (2015). This could be as a result of the presence of active enzymes for antimicrobial metabolites synthesis at pH 8.0. Hydrogen ion concentration has been reported to play a key role in the activity of enzymes and secondary metabolites production (Guimaraes et al., 2004).
The result of sodium chloride concentration (0.6%) on the antimicrobial activity of the co-cultured strains was lower than previous report of 5% by Bhosale et al. (2015). The difference could be attributed to the different strains used and the level of tolerance to osmotic pressure.
Temperature was observed to influence antimicrobial activity of the co-cultured strains. The elevated temperature was in tandem with the previous report of 45 °C by Rehaman and Mahesh (2015). The similarity could be due to stable metabolizing enzymes, which enabled the production of the antimicrobial compounds at such temperature. This may be an advantage in industrial biotechnological application. At such high temperature, mesophilic contaminants could be eliminated while microbial metabolism could be influenced (James et al., 1991).
Furthermore, all the carbon sources used supported good antimicrobial activity against indicator strains (Table 4). However, it was also observed that significant antimicrobial activity was recorded in production medium without any carbon source. The strains might have used other organic nutrients in the medium as carbon and energy sources. The use of amino acids such as alanine and valine has been reported to supply carbon skeleton needed in antimicrobial biosynthesis by actinomycetes (Voelker and Altaba, 2001).
In addition, the co-cultured strains required combined casein and potassium nitrate to exert the highest antimicrobial activity against the indicator strains. This was a shift from previous report of Bundale et al. (2015). The differences observed could be attributed to different strains used for study and their preference for a particular nitrogen source.
The incubation period for the highest antimicrobial activity by the co-cultured strains of Streptomyces xinghaiensis-OY62 and Streptomyces rimosus-OG95 differed from earlier reports by Siddique et al. (2013), Khattab et al. (2016) who had mentioned a period between 7 and 10 days of incubation period. The difference could be attributed to varying growth rate of the strains used and media used for production.
The retention factor (rf) of the partially purified antimicrobial compounds synthesized by the co-cultured strains of Streptomyces xinghaiensis-OY62 and S. rimosus-OG95 was 0.97, which differs from previous reports of Khattab et al. (2016), Maheshwari et al. (2016). The difference in molecular weights of the antimicrobial compounds and their relative mobility in solid phase could be responsible for the differences in the retention factors observed with the partially purified antimicrobial compounds.
The FTIR absorption spectral of the antimicrobial metabolites produced by co-cultured strains of Streptomyces xinghaiensis-OY62 and S. rimosus-OG95 showed that hydroxyl, aromatic rings, amides, carboxylic acids and carbonyls were functional groups present in the antimicrobial compounds. The observations are similar to previous reports of Coates (2000), Ayari et al. (2016).
Eight different antimicrobial compounds were produced by co-cultured strains of Streptomyces xinghaiensis-OY62 and Streptomyces rimosus-OG95 (Table 7). They included dibutyl phthalate and Bis (2-ethylhexyl) phthalate that have been reported to possess broad spectrum inhibitory property against pathogens (Mangamuri et al., 2016).
The Minimum Inhibitory Concentrations were higher than previous report of Arasu et al. (2014), Al-Bari et al. (2006). However, the MIC and MBC of gentamicin (control) was lower than the observed values of MIC and MBC of the partially purified antimicrobial extract (Table 8). The difference observed could be due to different strains of indicator strains used and the level of purity of the antimicrobial compounds.
5 Conclusion
The co-cultured strains of Streptomyces xinghaiensis-OY62 and S. rimosus-OG95 had best cultural conditions for antimicrobial production and activity at pH 8.0, in a starch casein broth medium supplemented with 0.6% (w/v) of sodium chloride, in the absence of carbon source, casein + KNO3 as nitrogen sources, incubated at temperature of 45 °C for a period of fifteen days. Functional groups identified were aromatic ring, hydroxyl, carbonyls, carboxylic acid and amide. Eight different antimicrobial compounds were synthesized by the combined strains. Dibutyl phthalate was mostly produced by the combined strains while phenol, 2,4-bis (1,1-dimethylethyl)- was least produced. The antimicrobial metabolites produced by co-cultured Streptomyces xinghaiensis-OY62 and Streptomyces rimosus OG95 exhibited broad spectrum antimicrobial activities against indicator strains
Acknowledgements
The authors sincerely appreciate the support received from Modibbo Adama University of Technology, Yola Adamawa State, Nigeria, Tertiary Educational Trust Fund (TETFUND) and Chemical Science Department of Joseph Ayo Babalola University (JABU) Ikeji Arakeji, Osun State, Nigeria.
References
- Characterization and antimicrobial activities of a phthalic acid derivative produced by Streptomyces bangladeshiensis, a novel species collected in Bangladesh. Res. J. Med. Med. Sci.. 2006;1:77-81.
- [Google Scholar]
- Determination of minimum inhibitory concentrations. J. Antimicrob. Chemother.. 2001;48:5-16.
- [Google Scholar]
- Multiple screening of phytochemicals from different plant extracts of Spermacoce hispida L. by GC–MS method. Int. J. Pharm. Dev. Technol.. 2016;6:71-79.
- [Google Scholar]
- In vitro antimicrobial potential of organic solvent extract of novel actinomycetes isolated from forest soil. Afr. J. Biotechnol.. 2014;13:1891-1897.
- [Google Scholar]
- Evaluation of antifungal activity of novel marine actinomycetes, Streptomyces sp. AA13 isolated from sediments of Lake Oubeiro (Algeria) against Candida albicans. Afr. J. Microbiol. Res.. 2016;10:156-171.
- [Google Scholar]
- Optimisation of antifungal compound production by a moderately halophilic Streptomyces warraensis HB-11. Int. J. Pharm. Sci. Res.. 2015;6:190-1119.
- [Google Scholar]
- Optimisation of culture conditions for production of bioactive metabolites by Streptomyces spp. isolated from soil. Adv. Microbiol.. 2015;5:441-451.
- [Google Scholar]
- Interpretation of infrared spectra, a practical approach. In: Meyers R.A., ed. Encyclopedia of Analytical Chemistry. Chichester: John Wiley and Sons Ltd.; 2000. p. :10815-10837.
- [Google Scholar]
- Isolation and characterization of an antimicrobial substance produced by Streptomyces violatus. Egypt. J. Biol.. 2001;3:11-21.
- [Google Scholar]
- Effect of pH on the production of the antitumour antibiotic rifamycin by Streptomyces olindensis. Biotechnol. Appl. Biochem.. 2004;40:107-111.
- [Google Scholar]
- Growth characteristics and production of secondary metabolites from selected Streptomyces species isolated from the rhizosphere of chili plant. Int. J. Enhanced Res. Sci. Technol. Eng.. 2015;4:1-8.
- [Google Scholar]
- The effect of temperature, pH and growth rate on secondary metabolism in Streptomyces thermoviolaceus grown in a chemostat. J. General Microbiol.. 1991;137:1715-1720.
- [Google Scholar]
- GC-MS analysis of chloroform extract of Crotobouplan dianum. Int. J. Pharma Bio Sci.. 2013;4:613-617.
- [Google Scholar]
- Production, purification and characterization of an antimicrobial compound from marine Streptomyces coeruleorubidus BTSS-301. J. Pharm. Res.. 2013;7:397-403.
- [Google Scholar]
- Streptomyces: isolation, optimisation of culture conditions and extraction of secondary metabolites. Int. Curr. Pharm. J.. 2016;5:27-32.
- [Google Scholar]
- Identification and characterization of antibiotic-producing actinomycetes isolates American. J. Microbiol.. 2013;4:24-31.
- [Google Scholar]
- Evaluation of bioactive chemical constituents by gas chromatography–mass spectrometry (GC–MS) analysis isolated from Bacillus species. Int. J. Curr. Microbiol. Appl. Sci.. 2016;5:488-497.
- [Google Scholar]
- Bioactive metabolites produced by Streptomyces cheonanensis VUK-A from coring mangrove. Isolation, structure, elucidation and bioactivity. Biotechnology. 2016;6:63-71.
- [Google Scholar]
- Production and purification of novel antibiotics from marine actinomycetes. Int. J. Publ. Mental Health Neurosci.. 2015;2:29-36.
- [Google Scholar]
- Isolation and partial purification of erythromycin from alkaliphilic Streptomyces werraensis isolated from Rajkot, India. Biotechnol. Rep.. 2014;1–2:2-7.
- [Google Scholar]
- Optimisation of antibiotic production by marine actinomycetes Streptomyces sp. KOD10. Int. J. Pharm. Pharm. Sci.. 2014;6:506-510.
- [Google Scholar]
- Production of avermectin B4b from Streptomyces avermitilis 41445 by batch submerged fermentation, Jundishapur. J. Microbiol.. 2013;6:1-6.
- [Google Scholar]
- From discovery to production: biotechnology of marine fungi for the production of new antibiotics. Mar. Drugs. 2016;14:1-20.
- [Google Scholar]
- Nitrogen sources governs the pattern of growth and pristinamycin production in Streptomyces pristinaespiralis. Microbiology. 2001;147:2447-2459.
- [Google Scholar]
- New strategies for combating multidrug resistant bacteria. Trends Mol. Med.. 2007;13:260-267.
- [Google Scholar]


