Translate this page into:
Effect of phenol formaldehyde resin as vulcanizing agent on flow behavior of HDPE/PB blend
*Tel.: +964 7801042860; fax: +964 40417970 moayad.khalaf@uobasrah.edu.iq (Moayad N. Khalaf)
-
Received: ,
Accepted: ,
This article was originally published by Elsevier and was migrated to Scientific Scholar after the change of Publisher.
Available online 25 December 2013
Peer review under responsibility of King Saud University.

Abstract
Thermoplastic elastomer (TPE) based on High density polyethylene (HDPE)/polybutadiene (HDPE/PB = 70/30 parts) blends containing 1, 3, 5, 7 and 10 wt.% of dimethylol phenolic resin as a vulcanizing agent in the presence of SnCl2 as catalyst was prepared. The dimethylol phenolic resin was prepared in our laboratory. The blends were compounded in mixer-60 attached to a Haake rheochord meter-90. The rheological properties were measured at temperatures 140, 160, 180 and 200 °C. The linearity of the flow curve appeared for 5% of the vulcanizing agent. The shear stress and shear viscosity have increased upon increasing the shear rate over a range of loading levels of vulcanizing agent of 1%, 3%, 5%, 7% and 10%. This may be attributed to the increased vulcanization between polyethylene and the rubber blend. The flow behavior index of the system shows a pseudo plastic nature behavior (since n < 1). The consistency index (K) increased with the increase in the phenol formaldehyde resin content and the temperature. Hence, the increase in the value of the consistency index (K) of the polymer melts refers to more viscous materials prepared. The activation energy for the TPE blends fluctuated indicating that there is phase separation; where each polymer behaved separately. This study showed that HDPE/PB blends are characterized with good rheological properties, which can be recommended to be processed with the injection molding technique.
Keywords
Thermoplastic elastomer
Polyethylene
Rheological properties
1 Introduction
Polymer blending was recognized in the last few decades as the most promising way to prepare new material with tailored individual properties (Nabil, 2014). Polymer blends are defined as a mixture of two or more polymers or copolymers. Blending of existing commodity or engineering polymers often can be implemented more rapidly and it is less expensive than realization of new polymer chemistry including development of monomer synthesis and polymerization technology (Drobny, 2007; Mohamad et al., 2006). Thermoplastic elastomer (TPE) is a new family in the field of polymer blending. Currently thermoplastic vulcanized (TPVs) are the fastest growing segment of the elastomer market and occupy a vital position in the family of TPEs due to their huge potential. However, there are still some unsolved technological problems, which are associated with a lack of proper understanding of the TPVs. Both the process of TPV production and the structure-properties relationship of the TPVs are still in the devolvement stage (Babu et al., 2011). For this reason, the development of TPV-based products is generally pursued by a somewhat trial and error method. Extensive studies have been carried out in the area of polymer blend (De and Bhowmick, 1990; Mohamad, 2007). Thermoplastic elastomers from blends of poly butadiene rubber (BR) and polyethylene (PE) find applications in wire and cables, oil seals, hoses, automotive, household articles, footwear, military and other molded articles by virtue of their easy process ability, excellent oil resistance and good mechanical properties (Kear, 2003; Drobny, 2007; Saiah, 2012; Sikder, 2013). New application of polymer blend in the field of transport behavior of various organic solvents and gases through polymers is of great technological importance and it plays a vital role in a variety of barrier applications (Kumar et al., 2012; Bhattacharya et al., 2011). Hence, it is important to study the viscoelastic properties of these materials in order to understand the final processing properties of the materials. Goettler et al. (1982) were the first to study the technical importance of the TPVs in terms of rheological characteristics using a capillary rheometer. Han and White (1995) described the comparative rheological study of PP and PP/EPDM uncross-linked and dynamically cross-linked blends, using various rheological instruments to measure steady shear flow, uniaxial extension, and oscillation flow properties of the compounds. Steeman et al. (2000) reported that TPVs have a yield stress for flow and that the value increases with the increase in elastomer component in the TPV. An extensive study of rheological response of PP/EPDM blends and the TPVs with phenolic resin as crosslinking agent has been carried out by Jain et al. (2000). Tanrattanakul et al. (2009) studied the effect of phenolic resin as a vulcanizing agent on mechanical properties and morphology of TPE prepared from PP/NR. In our laboratory, different materials (peroxide, phenol formaldehyde resin and maleated polyethylene) were used to control and eliminate the discontinuity of flow curve which was related to the surface distortion of the polymer extrudate. Using these materials had improved the viscosity which is an indication of the processing of the polymers.
The preparation of HDPE/PB blends using different % of phenol formaldehyde resin as a vulcanizing agent in the presence of SnCl2 as catalyst forms the focus of this research. The prepared TPEs are evaluated by rheological, flow and activation energy properties.
2 Experimental
2.1 Materials
Highdensity polyethylene (HDPE) SCPILEX 6003 was manufactured by the State Company for Petrochemical Industries (SCPI) in Basrah-Iraq (MFI = 0.3 gm/10 min, density = 0.960 gm/cm3). Polybutadiene was obtained from Kumho Petrochemical-Korea, KUMHO KBR has 34.5% of 1,4-cis content. Stannous dichloride (SnCl2) was manufactured by Fluka Company and used as it is. Phenol formaldehyde resin was prepared in our laboratory.
2.2 Preparation of the thermoplastic elastomer
The thermoplastic elastomer has been prepared using a Haake rhecorod meter 90 according to George et al. (1999) and Nakason et al. (2006). As conducted in previous studies (Hernández et al., 2006; Nakason et al., 2006; Mousa et al., 2005), HDPE (70 parts by weight) and dimethylol phenolic resin (1, 3, 5, 7 and 10 wt.%) were mixed at 180 °C with rotor speed of 60 rpm for 3 min. Stannous dichloride (SnCl2) (2 parts) was added and mixed for 5 min. Then PB (30 parts by weight) was added and the mixing was continued for 5 min., the suggested mechanism is shown in Scheme 1. The products were later cut into small pieces. The prepared TPEs were characterized by Shimadzu FTIR model 2400S. Thin film was prepared by compression molding. The FTIR spectra (Fig. 1) show a weak absorption peak of a trace quantity of the –C⚌C– stretching at 1640 cm−1 in HDPE molecules. The presence of the trace carbon double bound confirms the availability of sites for reacting with the methylol groups in phenolic molecules (Scheme 1). In Fig. 1, the spectra of TPE with 5% phenol formaldehyde resin show a combination of HDPE absorption ranges and a number of characteristic absorption peaks relating to phenolic molecules can be seen and indicated to the –OH stretching vibration of monomeric phenol at 3600 cm−1 and hydrogen bonding of phenol at 3380 cm−1 and a peak at 1206 cm−1 contribute to –C–O. The peak at 1340 cm−1 is attributed to the stretching vibration of phenolic (C–OH). While the two peaks at 1600 and 1660 cm−1 are indicated to the stretching vibration of the –C⚌C– of aromatic rings.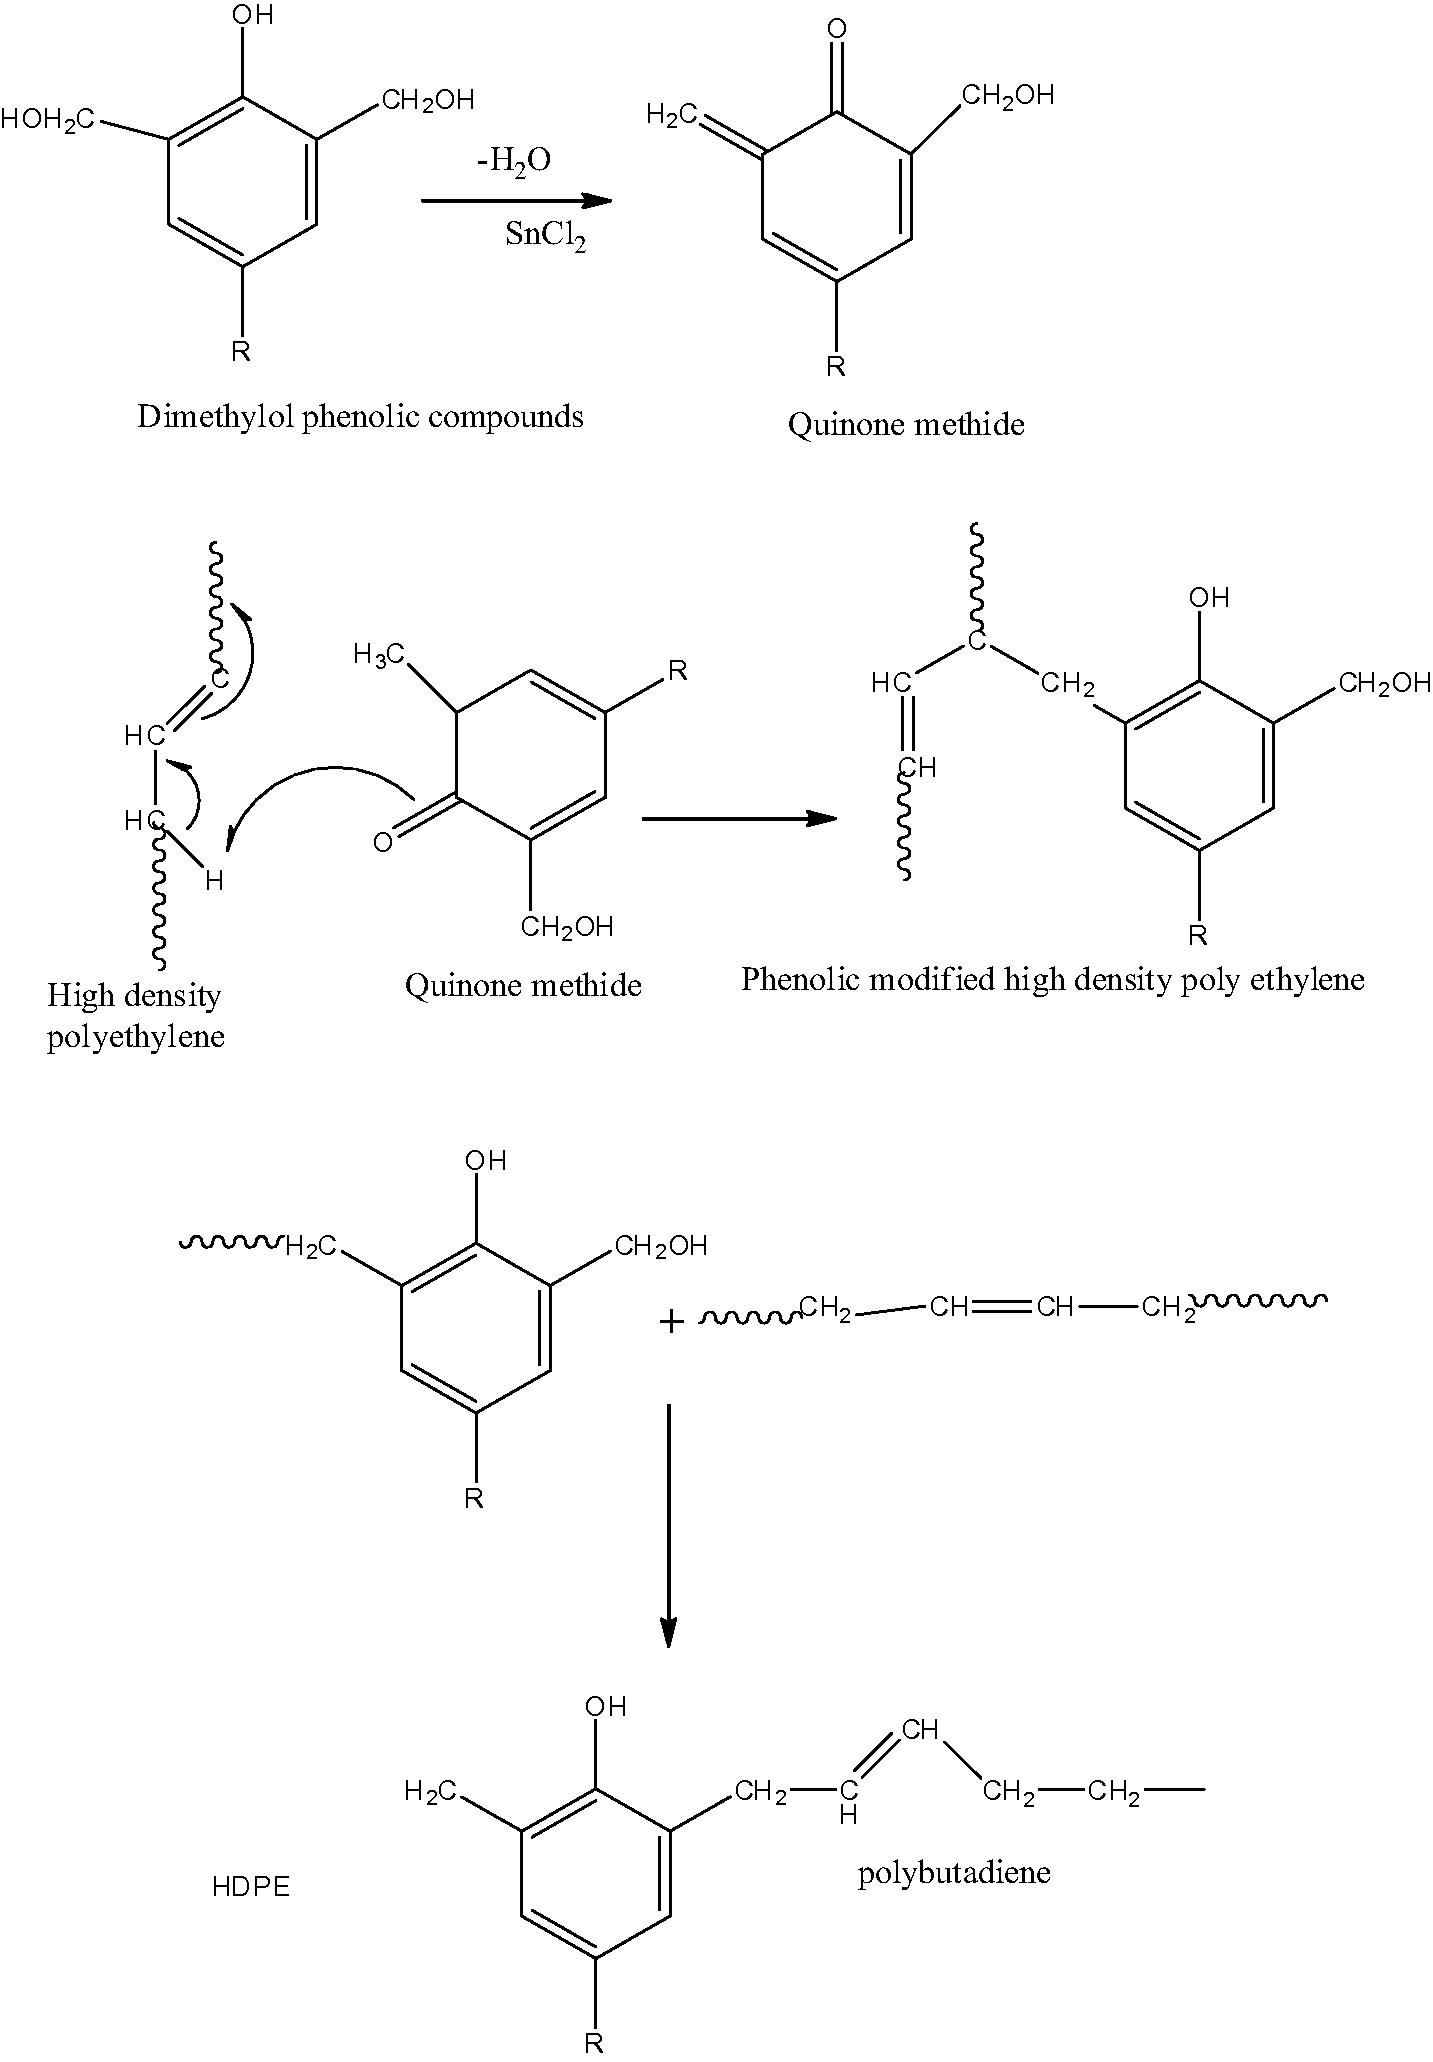
The mechanism of preparing the TPE using phenol formaldehyde resin as vulcanizing agent.
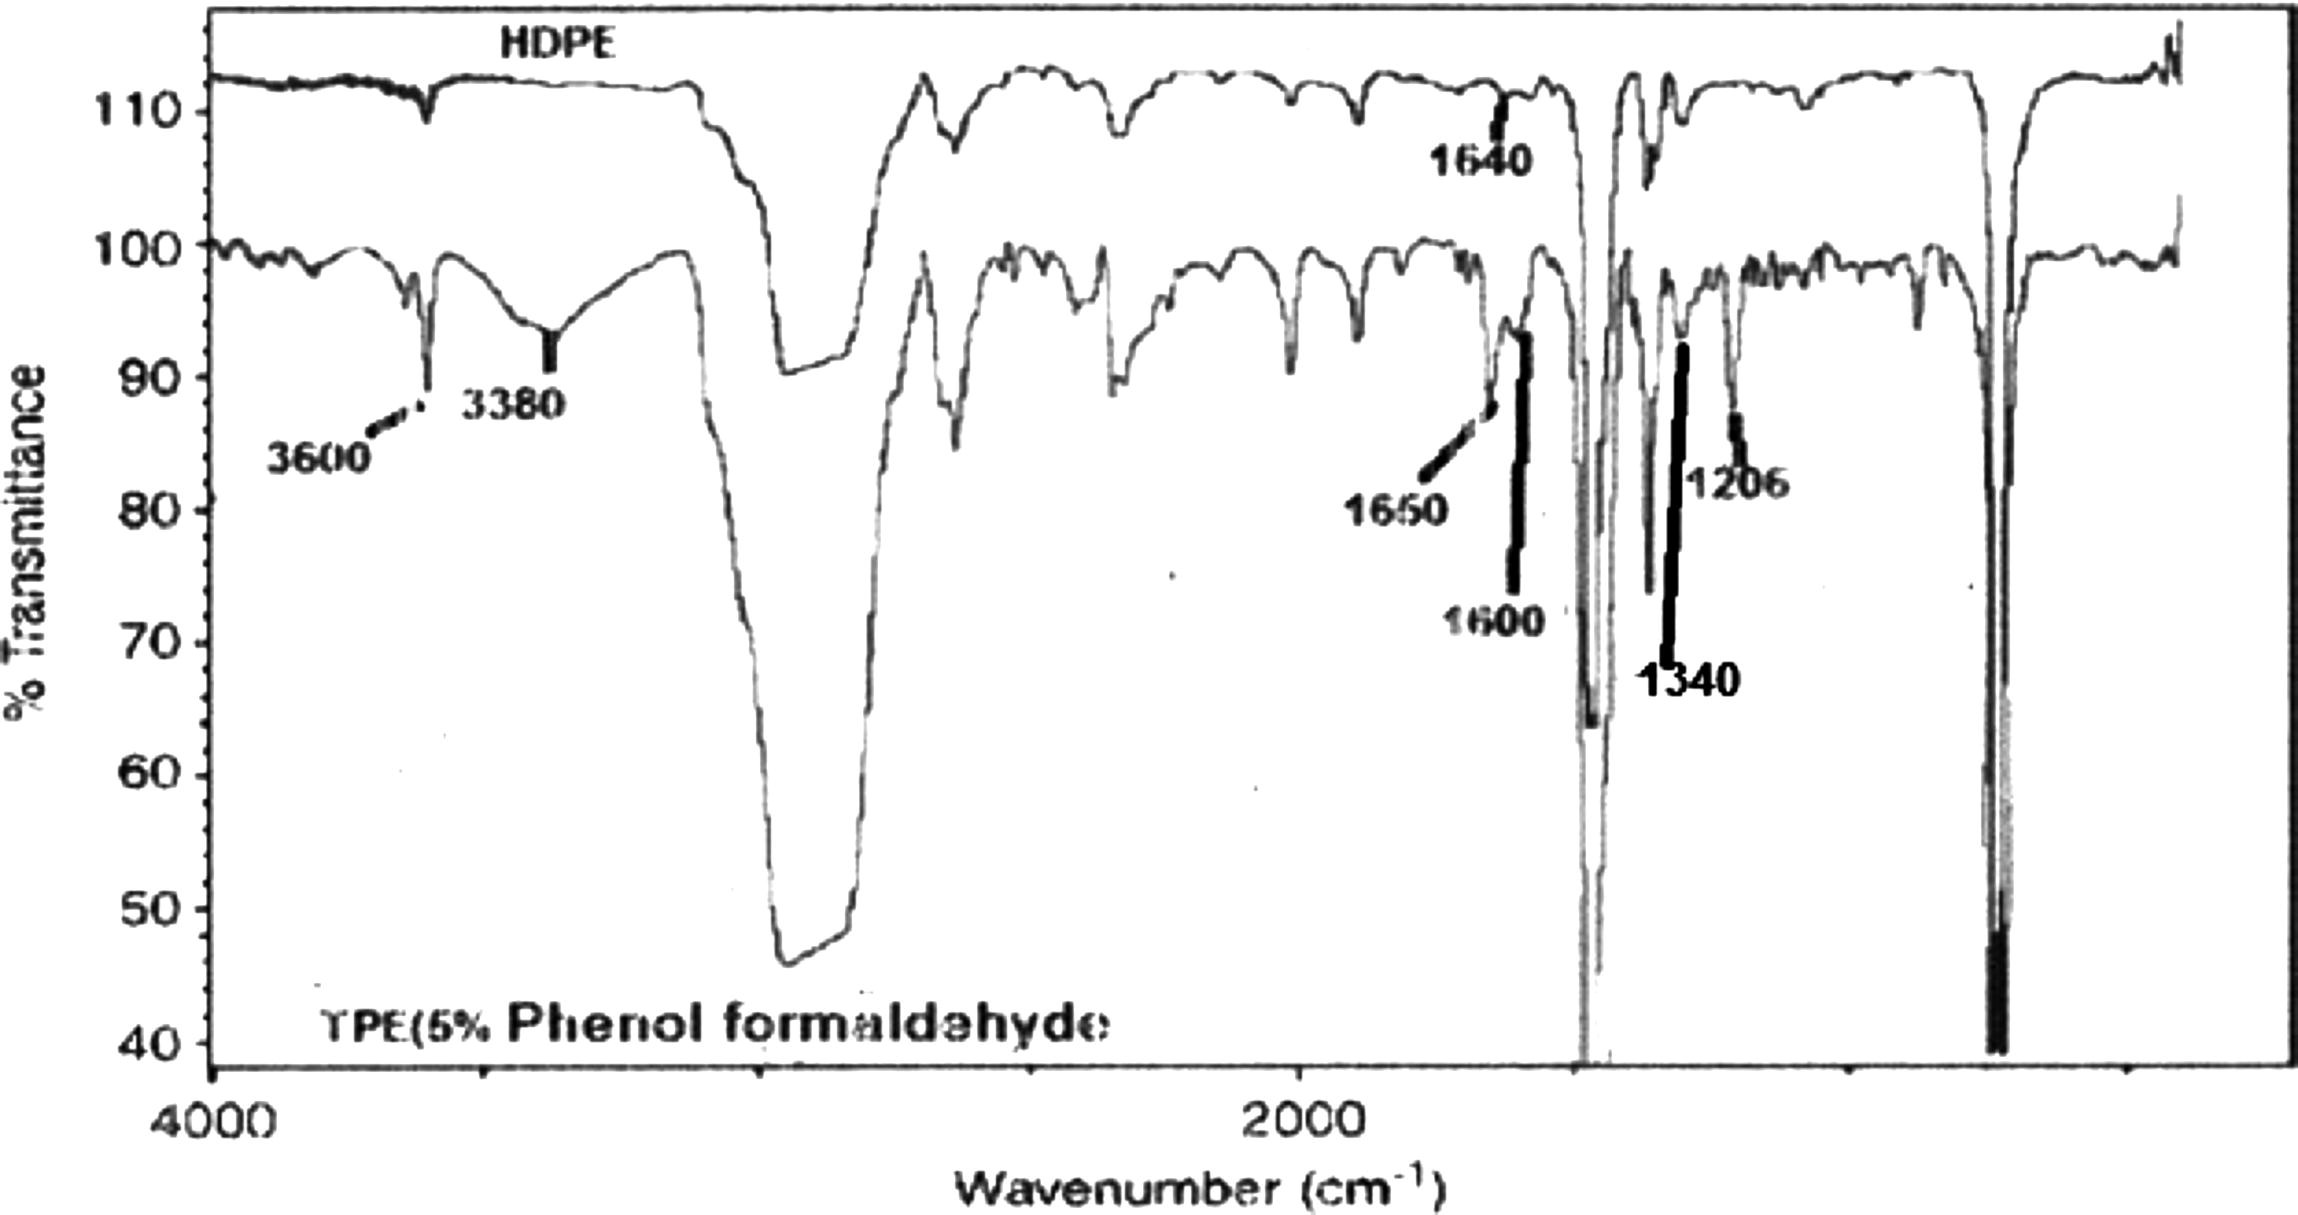
FTIR spectra of HDPE and TPE (5% phenol formaldehyde resin).
2.3 Rheological characterization
The rheological measurements were done in an Instron capillary rheometer (model 3211) at different plunger speeds. The melt was extruded through the capillary at plunger speeds varied from 0.06 to 20 cm min−1 after a warm-up period of 5 min. The measurements were done at a temperature of 200 °C. For studying the effect of temperature, the analysis of samples has been carried out at 140, 160, 180 and 200 °C. Dimensions of the capillary die used were 0.76 mm diameter, 60.8 mm length, 80/9 length to diameter (L/D) ratio and 90o entry angle. The material was first preheated in the rheometer barrel for 5 min. under a pressure to get a compact mass. The excess molten material was then automatically purged until no bubbles were observed. The apparent values of shear stress, shear rate and shear viscosity were calculated using the derivative of the Poiseuille law for capillary flow.
3 Results and discussion
The rheological properties of polymeric materials vary with their chemical structures. Therefore, it is highly desirable to be able to relate the rheological properties of polymeric materials to their chemical structures. Rheological behavior of polymeric melts is an important aspect to understand the flow behavior of the materials during processing. Capillary rheometry is the most common technique used to determine deformation of polymeric melt under shear flow (Sombatsompop et al., 2002). The addition of dimethylol–phenolic compound improves the high density polyethylene/polybutadiene properties of the blend substantially (Coran and Patel, 2004).
3.1 Effects of phenol formaldehyde resin ratio and shear stress on viscosity
The effect of shear stress on the viscosity of polybutadiene rubber, polyethylene and their binary blends (TPEs) at different temperatures is depicted in Figs. 2–4. The viscosities of polybutadiene rubber, pure polyethylene and the prepared TPEs decrease with increasing shear stress, indicating pseudo plastic flow behavior. The pseudo plastic nature of polymers arises from the randomly oriented and entangled nature of the polymer chains which, on application of high shear rates become oriented and disentangled resulting in reduction of viscosity. The obtained results are comparable to those reported in George et al. (1999) and Basuli et al. (2008).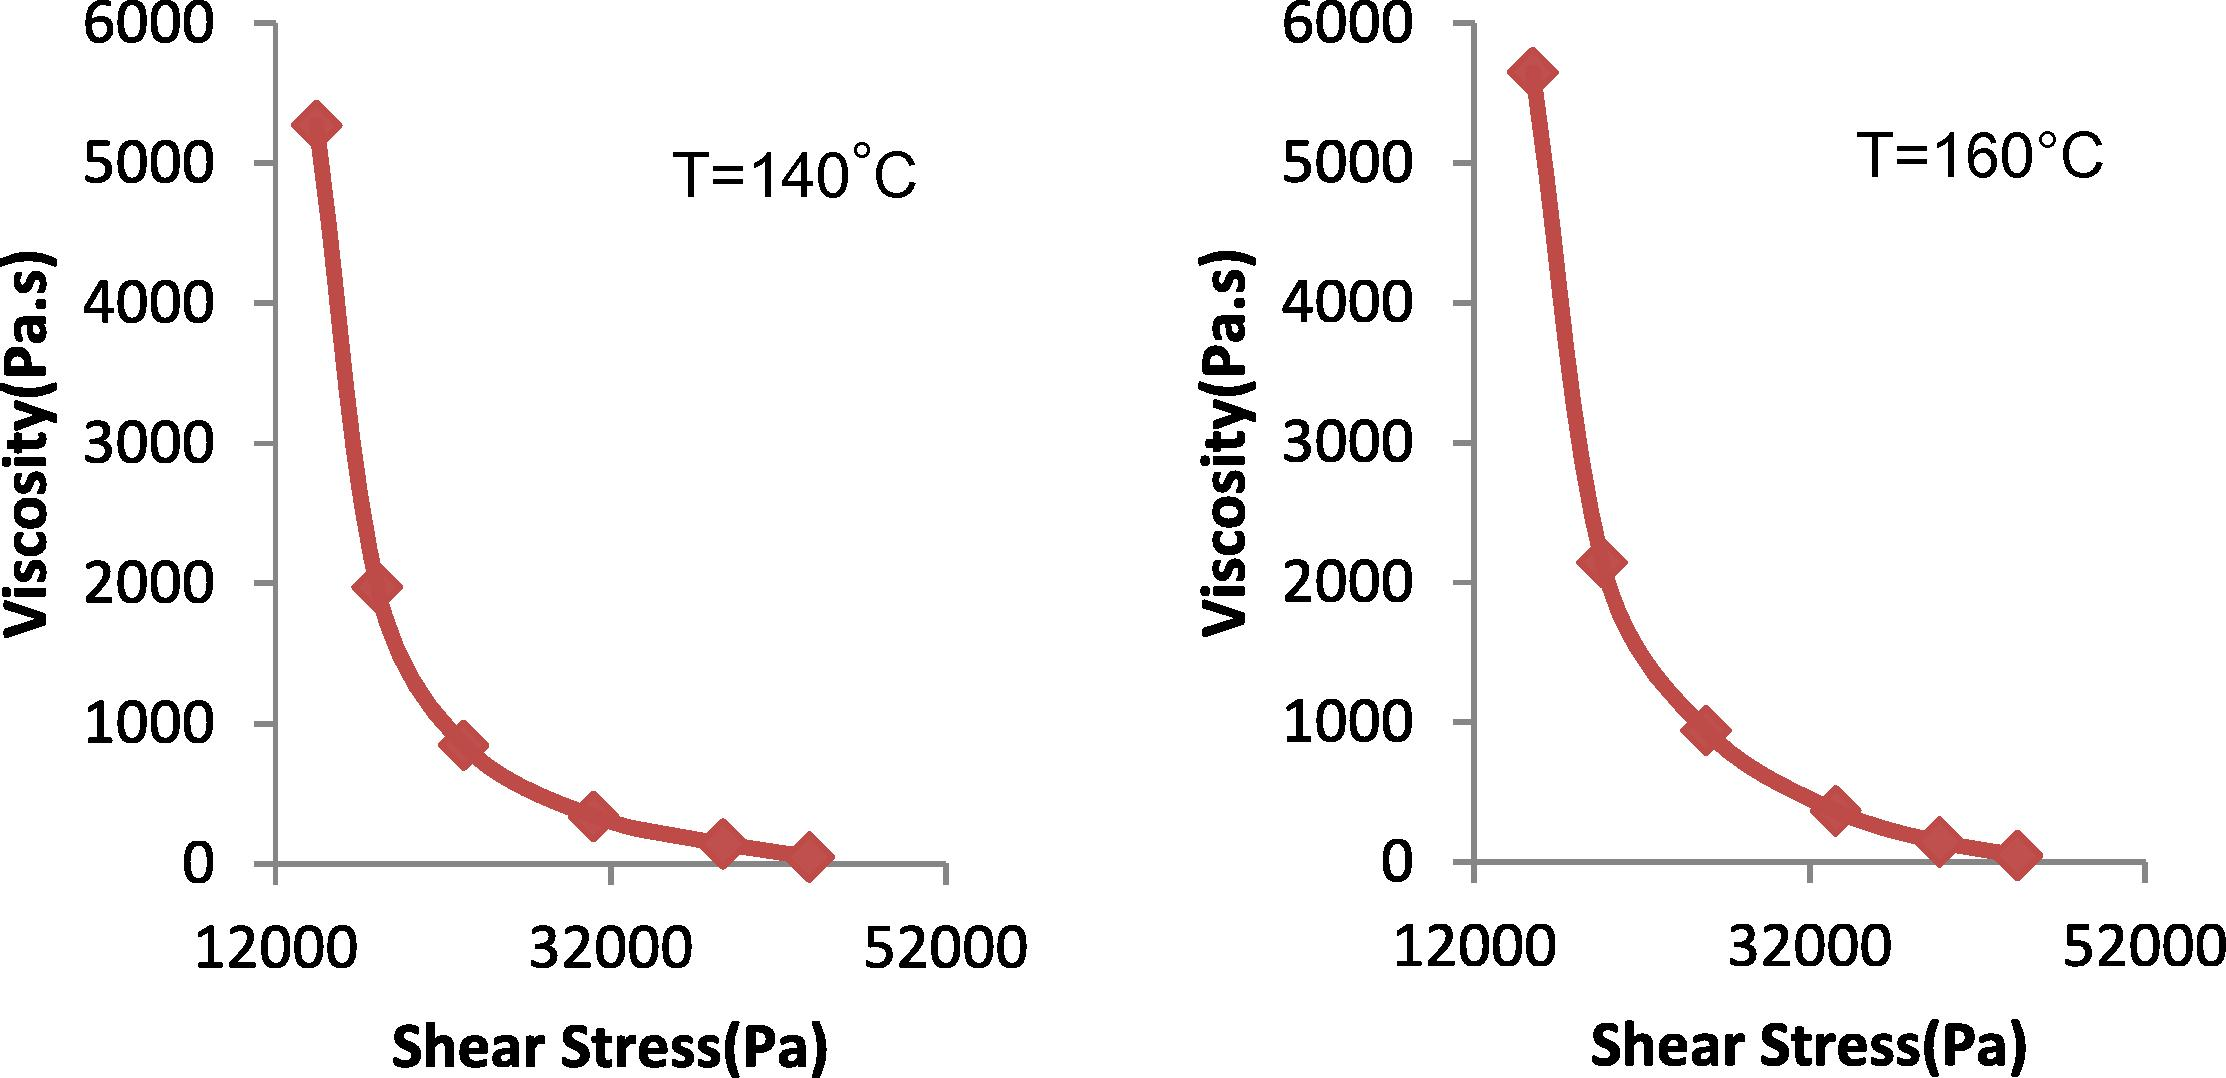
Relationship between apparent viscosity and shear stress for pure rubber (at 140 and 160 °C).
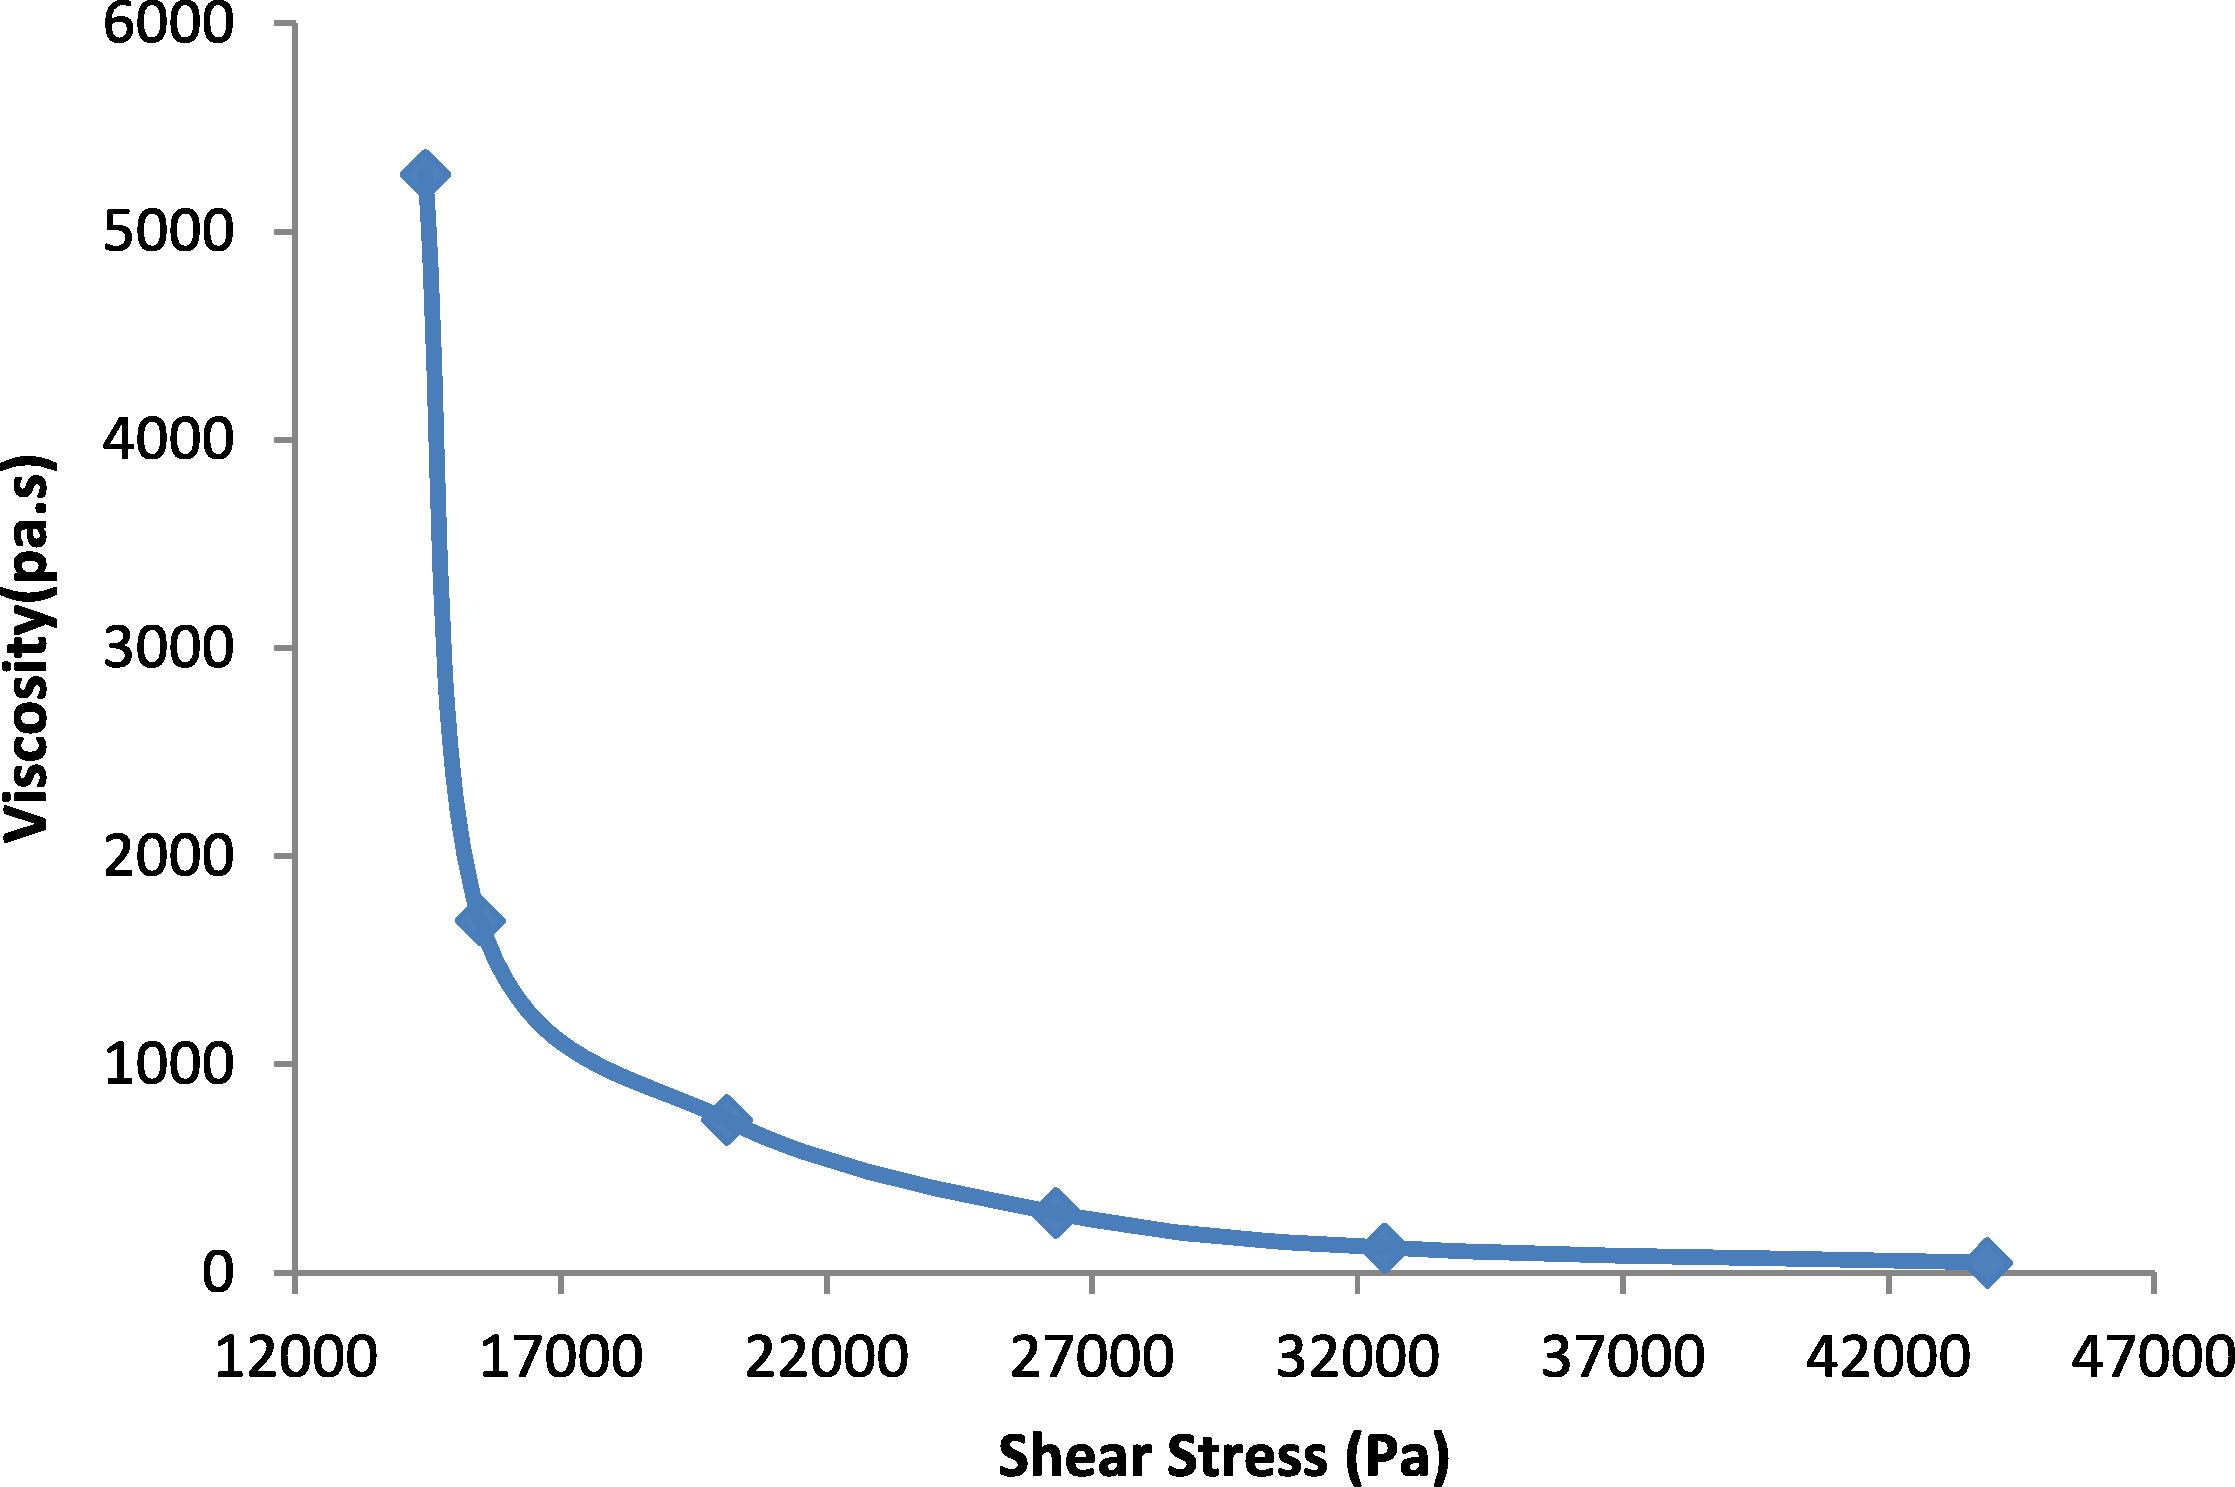
Relationship between apparent viscosity and shear stress for pure PE at 140, 160, 180 and 200 °C.
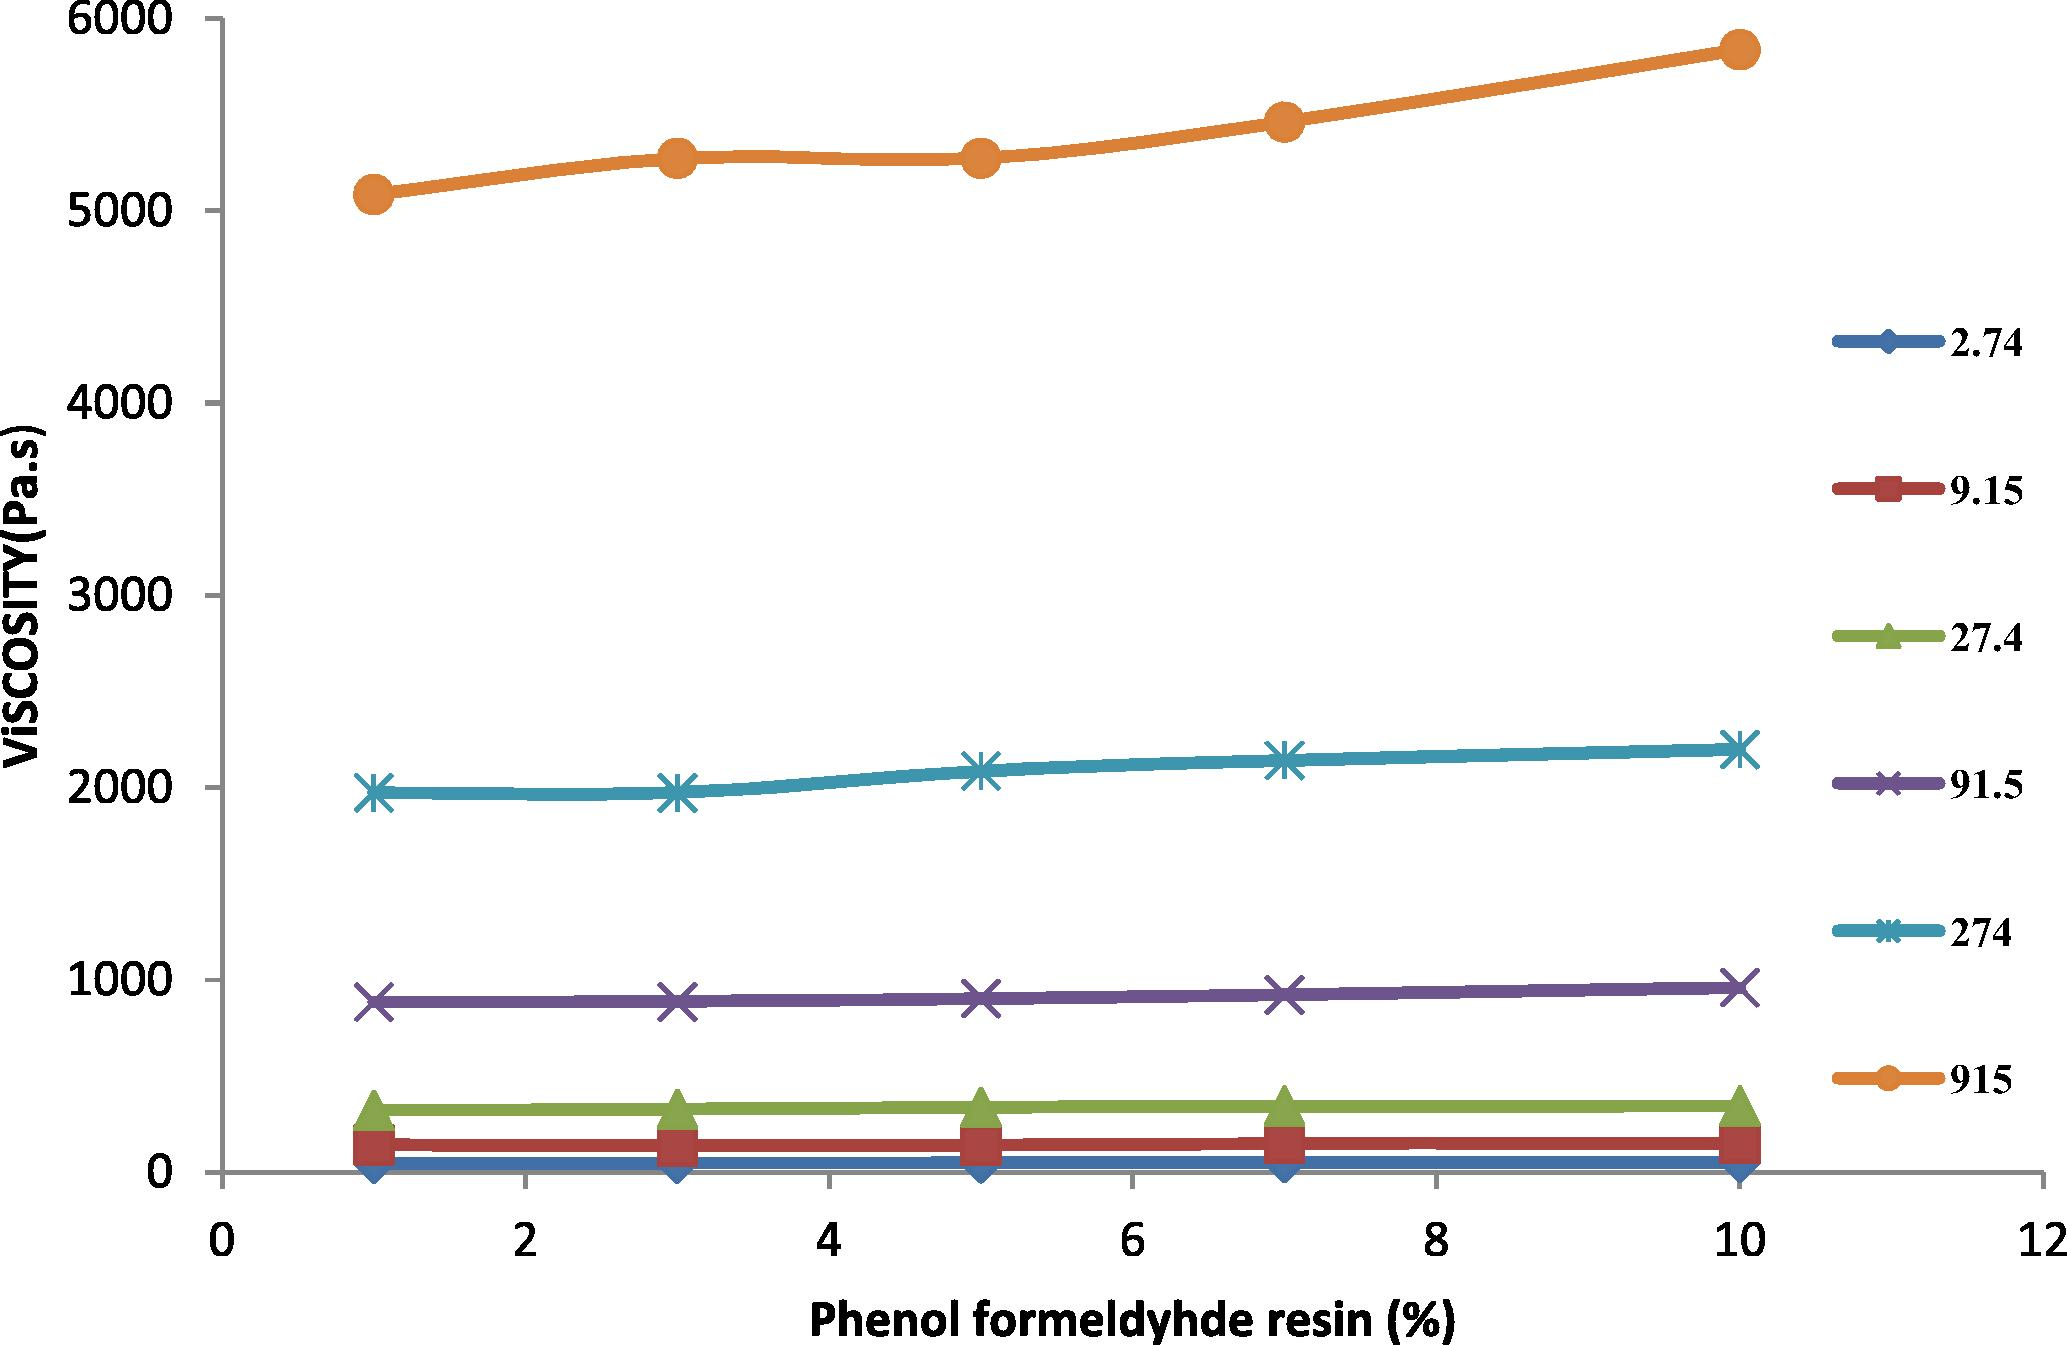
Effect of percent phenol formaldehyde resin on the apparent viscosity of TPE at different shear rate at 200 °C.
In Fig. 2, the viscosity of the rubber was measured at temperature 140 and 160 °C, where at higher temperatures 180 and 200 °C the PB rubber was oxidized and destroyed. Fig. 3 shows the viscosity of HDPE at different temperatures (140, 160, 180 and 200 °C). It is noticeable that HDPE behaved similarly for all temperatures. This similarity is due to the fact that the grade of the HDPE is rigid and linear with low melt flow index. The viscosity of HDPE and the TPEs decreased with shear rate at a higher rate than for PB rubber. At low shear rates, HDPE shows a higher viscosity than the TPEs with all percent of phenol formaldehyde resin, and at high shear rates the viscosity of the TPEs with all percent of phenol formaldehyde resin lies between those of the homo polymers. Fig. 4 shows the viscosity variation with blend composition at different shear rates.
As the phenol formaldehyde resin content in the blend increases, the blend viscosity is slightly deviated. In the prepared TPE, the viscosity depends on interfacial thickness and interface adhesion in addition to the characteristics of the HDPE and PB polymers. This is because, in the TPE, on the application of shear stress there is interlayer slip along with orientation and disentanglement. The slight deviation in the viscosity of the TPE is an indication of the complete vulcanization between the two polymers.
3.2 Flow behavior index
Power-lawis behavior is characterized by a power (n) relationship between shear stress and shear rate. The flow behavior index gives an idea about the nature of flow, i.e., whether it is Newtonian or non-Newtonian. Most polymers show pseudo plastic behavior with flow behavior index n less than 1. The power-law equation was applied to describe the rheological behavior of the system. The melt flow behavior can be described by power law, which is expressed by Ostwald and de Waele model. The equation for this model is given as follows:
Phenol formaldehyde resin (%)
Temperature (°C)
140
160
180
200
K
n
K
n
K
n
K
n
0
2.995
0.206
2.993
0.198
3.016
0.198
3.033
0.198
1
2.208
0.237
2.219
0.225
2.230
0.210
2.237
0.202
3
2.218
0.224
2.228
0.209
2.234
0.201
2.240
0.195
5
2.22
0.219
2.232
0.207
2.238
0.201
2.243
0.195
7
2.227
0.217
2.236
0.204
2.240
0.203
2.245
0.200
10
2.236
0.204
2.243
0.195
2.247
0.193
2.252
0.189
3.3 Activation energy of melt flow
Flow ability of polymer melts was important, which was controlled and regulated by the processing temperatures. The melt viscosity of the TPEs as a function of temperature at the shear rates (2.74, 9.18, 27.4, 91.8, 274 and 915 s−1) is represented in Table 2 at 140, 160, 180, and 200 °C. From Table 2, it can be observed that the flow behavior of the melts improves with the temperature increase. This behavior was attributed to the fact that when the temperature increases, the melt free volume increases, causing an enhancement of chain segment motion and a reduction of interactions between chain segments. As a result, the melt viscosity decreases with the increase in the temperature. The temperature dependence of the viscosity of the TPE was expressed by the flow activation energy calculated from the Arrhenius equation:
Phenol formaldehyde resin (%)
Shear rate
2.74 s−1
9.18 s−1
27.4 s−1
91.8 s−1
274 s−1
918 s−1
Ea (kJ/mol)
0
26.25
30.7
29.03
21.73
23.76
20.79
1
15.25
17.1
11.8
9.16
6.26
1.07
3
11.27
11.14
9.14
6.8
0.565
1.05
5
8.45
13.3
7.87
7.9
2.11
1.04
7
10.8
10.1
7.7
6.5
7.29
3.24
10
10.1
7.87
7.3
5.36
5.46
3.0
3.4 Viscosity of the blend
The viscosity was determined by dividing the apparent shear stress and apparent shear rate and the value of viscosity of TPEs vs. shear rate is shown in Tables 3–7. For all the TPEs, the pseudo plastic characteristics can be observed from the decrease of viscosity with increasing shear rate. Introduction of the vulcanizing agent into the polymer structure (TPE) increases its polarity while at the same time disrupting the inter chain bonding and crystalline nature of PE. Initially, the disruption of the inter chain interaction of PE predominates consequently; flow is enhanced and melts index increases. Further increase in the vulcanizing agent content results in the predominance of chain polarity and hence intermolecular attraction. This leads to a decrease in the flow properties. The applied force disturbed the long chain polymer from its equilibrium position and the molecules got disentangled in the direction of the force and this caused a reduction in viscosity. This result was in agreement with George et al. (1999). The increase of viscosity of TPEs upon the addition of vulcanizing content was increase (Ghosh et al., 1997). The increase in viscosity indicates that there is less slippage at the bonding resulting from the vulcanizing agent between the HDPE/PB. The decreasing of viscosity (η) with increasing shear rate (γ), commonly referred to as “shear-thinning behavior,” is believed to arise from the stretching of an “entangled” state of polymer chains to an “oriented” state when the applied shear rate is higher than a certain critical value (Han, 2007).
Shear rate (s−1)
Temperature (°C)
140
160
180
200
Viscosity (Pa.s)
2.74
4143.065693
4519.708029
4896.350365
5084.671533
9.15
1579.016393
1691.803279
1860.983607
1973.770492
27.4
753.2846715
809.7810219
847.4452555
885.1094891
91.5
281.9672131
298.8852459
310.1639344
321.442623
274
131.8248175
139.3576642
141.2408759
143.1240876
915
46.80655738
46.80655738
47.3704918
47.3704918
Shear rate (s−1)
Temperature (°C)
140
160
180
200
Viscosity (Pa.s)
2.74
4519.708029
4896.350365
5084.671533
5272.992701
9.15
1691.803279
1860.983607
1917.377049
1973.770492
27.4
790.9489051
753.2846715
828.6131387
885.1094891
91.5
298.8852459
304.5245902
315.8032787
327.0819672
274
133.7080292
133.7080292
131.8248175
135.5912409
915
47.3704918
47.3704918
47.93442623
47.93442623
Shear rate (s−1)
Temperature (°C)
140
160
180
200
Viscosity (Pa.s)
2.74
4708.029197
4896.350365
5084.671533
5272.992701
9.15
1748.196721
1917.377049
2030.163934
2086.557377
27.4
809.7810219
847.4452555
866.2773723
903.9416058
91.5
304.5245902
321.442623
332.7213115
338.3606557
274
135.5912409
135.5912409
137.4744526
139.3576642
915
47.93442623
47.93442623
48.49836066
48.49836066
Shear rate (s−1)
Temperature (°C)
140
160
180
200
Viscosity (Pa.s)
2.74
4708.029197
5084.671533
5272.992701
5461.313869
9.15
1860.983607
1973.770492
2030.163934
2142.95082
27.4
828.6131387
866.2773723
885.1094891
922.7737226
91.5
315.8032787
327.0819672
338.3606557
344
274
137.4744526
139.3576642
146.8905109
150.6569343
915
48.49836066
48.49836066
49.06229508
50.75409836
Shear rate (s−1)
Temperature (°C)
140
160
180
200
Viscosity (Pa.s)
2.74
5084.671533
5461.313869
5649.635036
5837.956204
9.15
1973.770492
2030.163934
2086.557377
2199.344262
27.4
866.2773723
885.1094891
903.9416058
960.4379562
91.5
321.442623
332.7213115
344
344
274
141.2408759
141.2408759
148.7737226
150.6569343
915
48.49836066
49.06229508
49.06229508
50.75409836
3.5 Shear stress of the TPEs
The shear stress represented the resistance of materials to deformation. It is known that properties of the prepared TPEs will change from nonpolar to polar due to the incorporation of polar vulcanizing agent (phenol formaldehyde resin) (Oh et al., 2001). The increasing of polarity of the polymer will be highly effective in the flow curve and also will control the discontinuity of the flow curve and eliminate the surface deformation like sharkskin (Majeed, 2002; Khalaf et al., 2008). Figs. 5–9 show the shear stress vs. shear rate of TPEs with different percent of phenol formaldehyde resin. It can be seen that the shear stress increases with an increase in the shear rate and nonlinearity appears because of the pressure oscillation in the flow curve at the first critical shear rate (τ) between 70 and 150 s−1, which means shark skin surface distortion of the polymer extrudate appeared (Doney, 2002). The disappearance of pressure oscillations resulted in a smooth extrudate surface and the curve will be linear. The nonpolar characteristics of the polymer lead to poor interfacial adhesion properties with other materials such as dies surfaces. As the percent of vulcanizing agent on the TPEs increases the pressure oscillation was eliminated and the flow curve was linear it means that the surface distortion was disappearing, and this situation was reached with the 5% (Fig. 7) of the vulcanizing agent.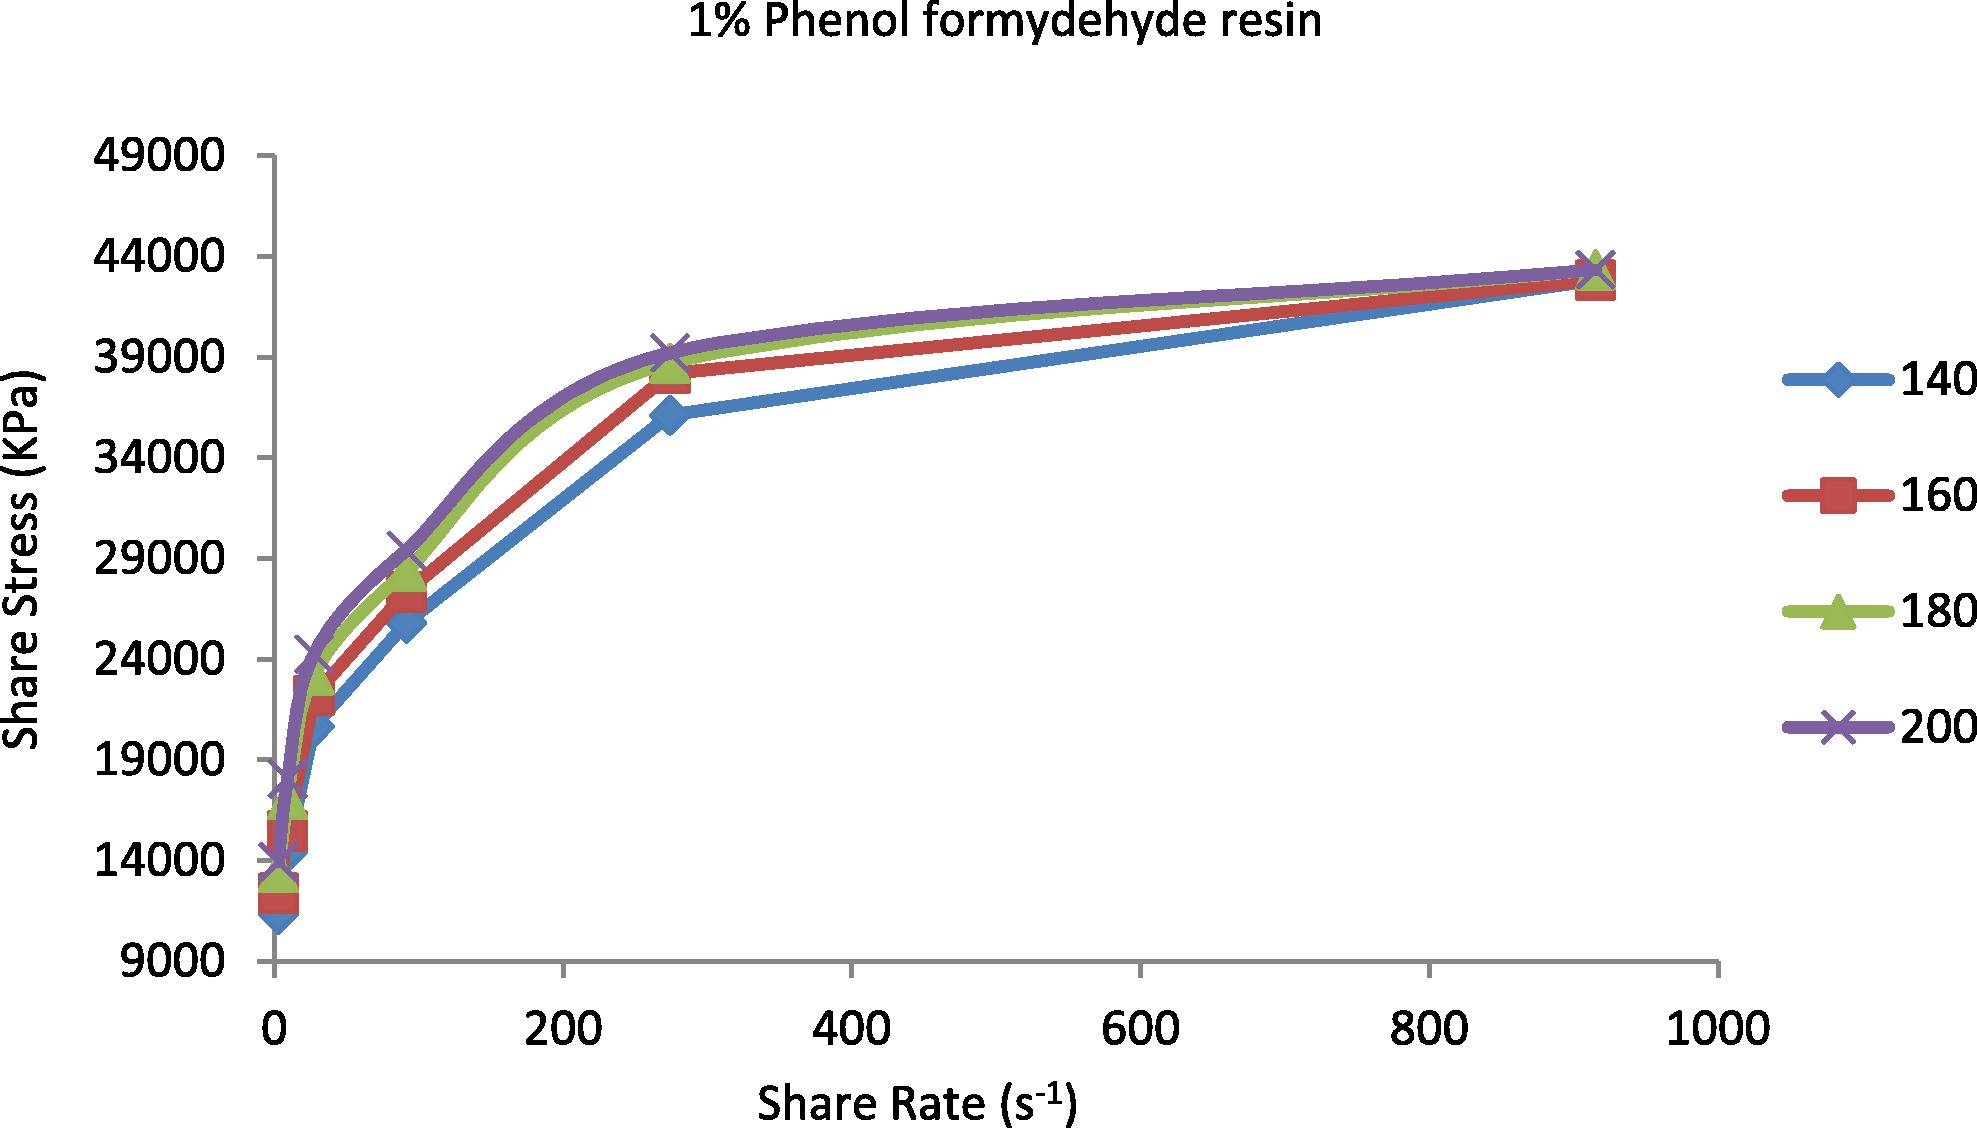
Shear stress vs. shear rate for TPE contains (1 wt.%) phenol formaldehyde resin at temperatures 140, 160, 180 and 200 °C.
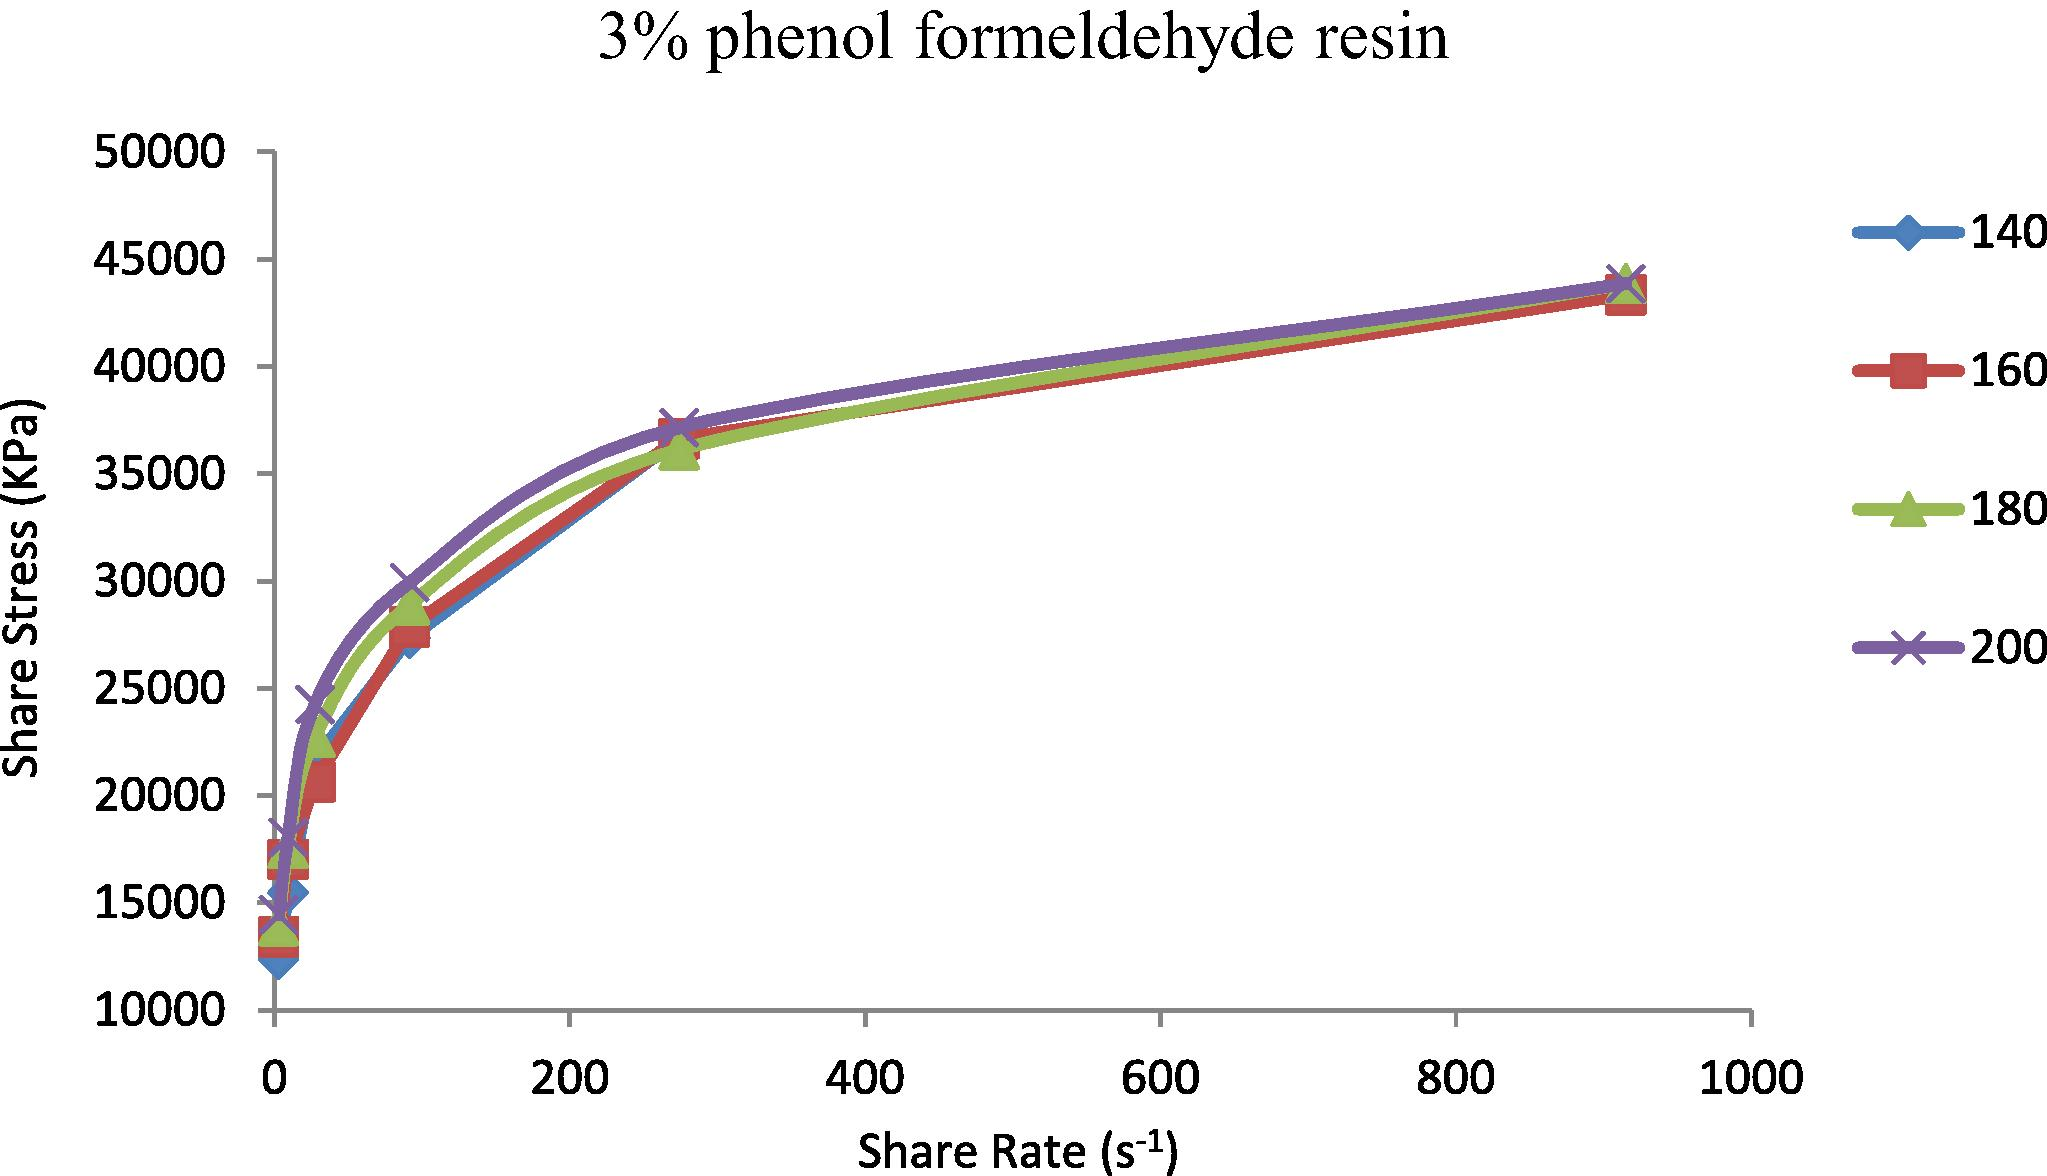
Shear stress vs. shear rate for TPE contains (3 wt.%) phenol formaldehyde resin at temperatures 140, 160, 180 and 200 °C.
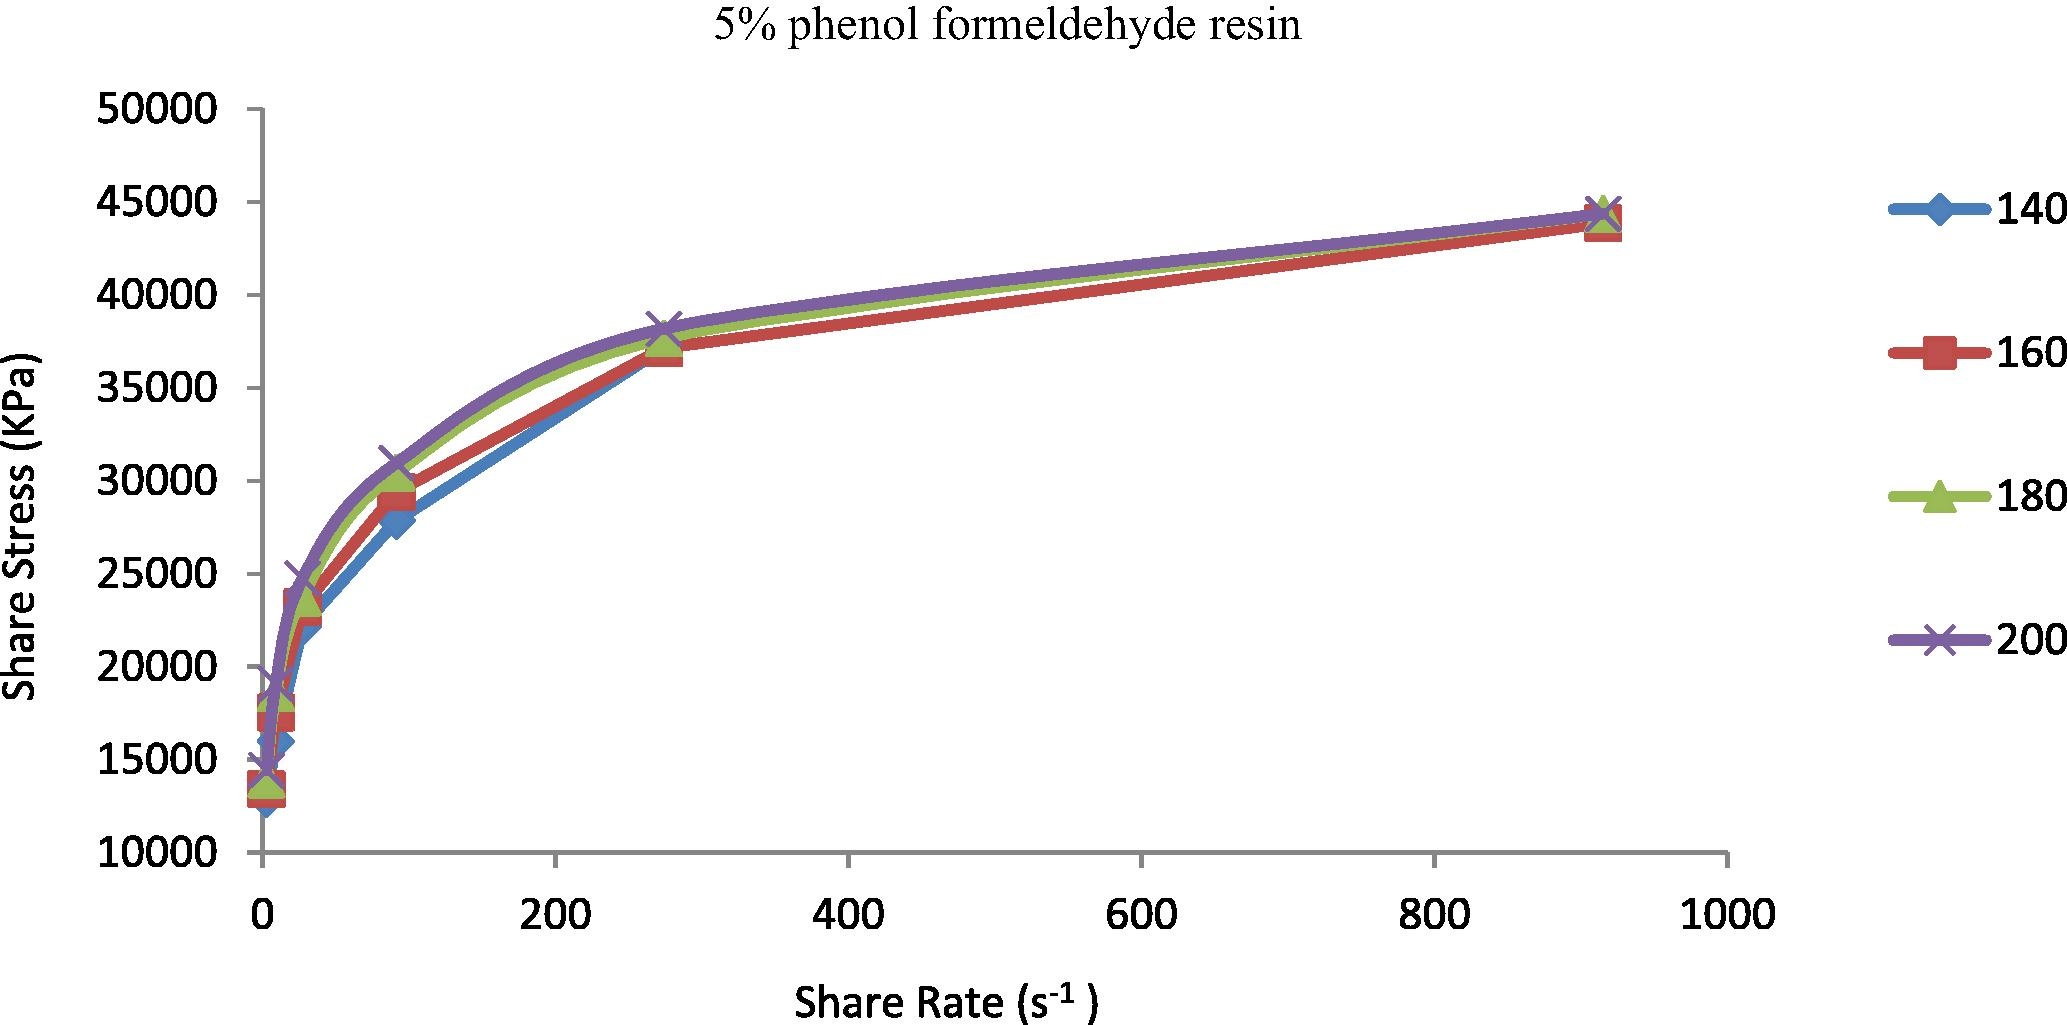
Shear stress vs. shear rate for TPE contains (5 wt.%) phenol formaldehyde resin at temperatures 140, 160, 180 and 200 °C.
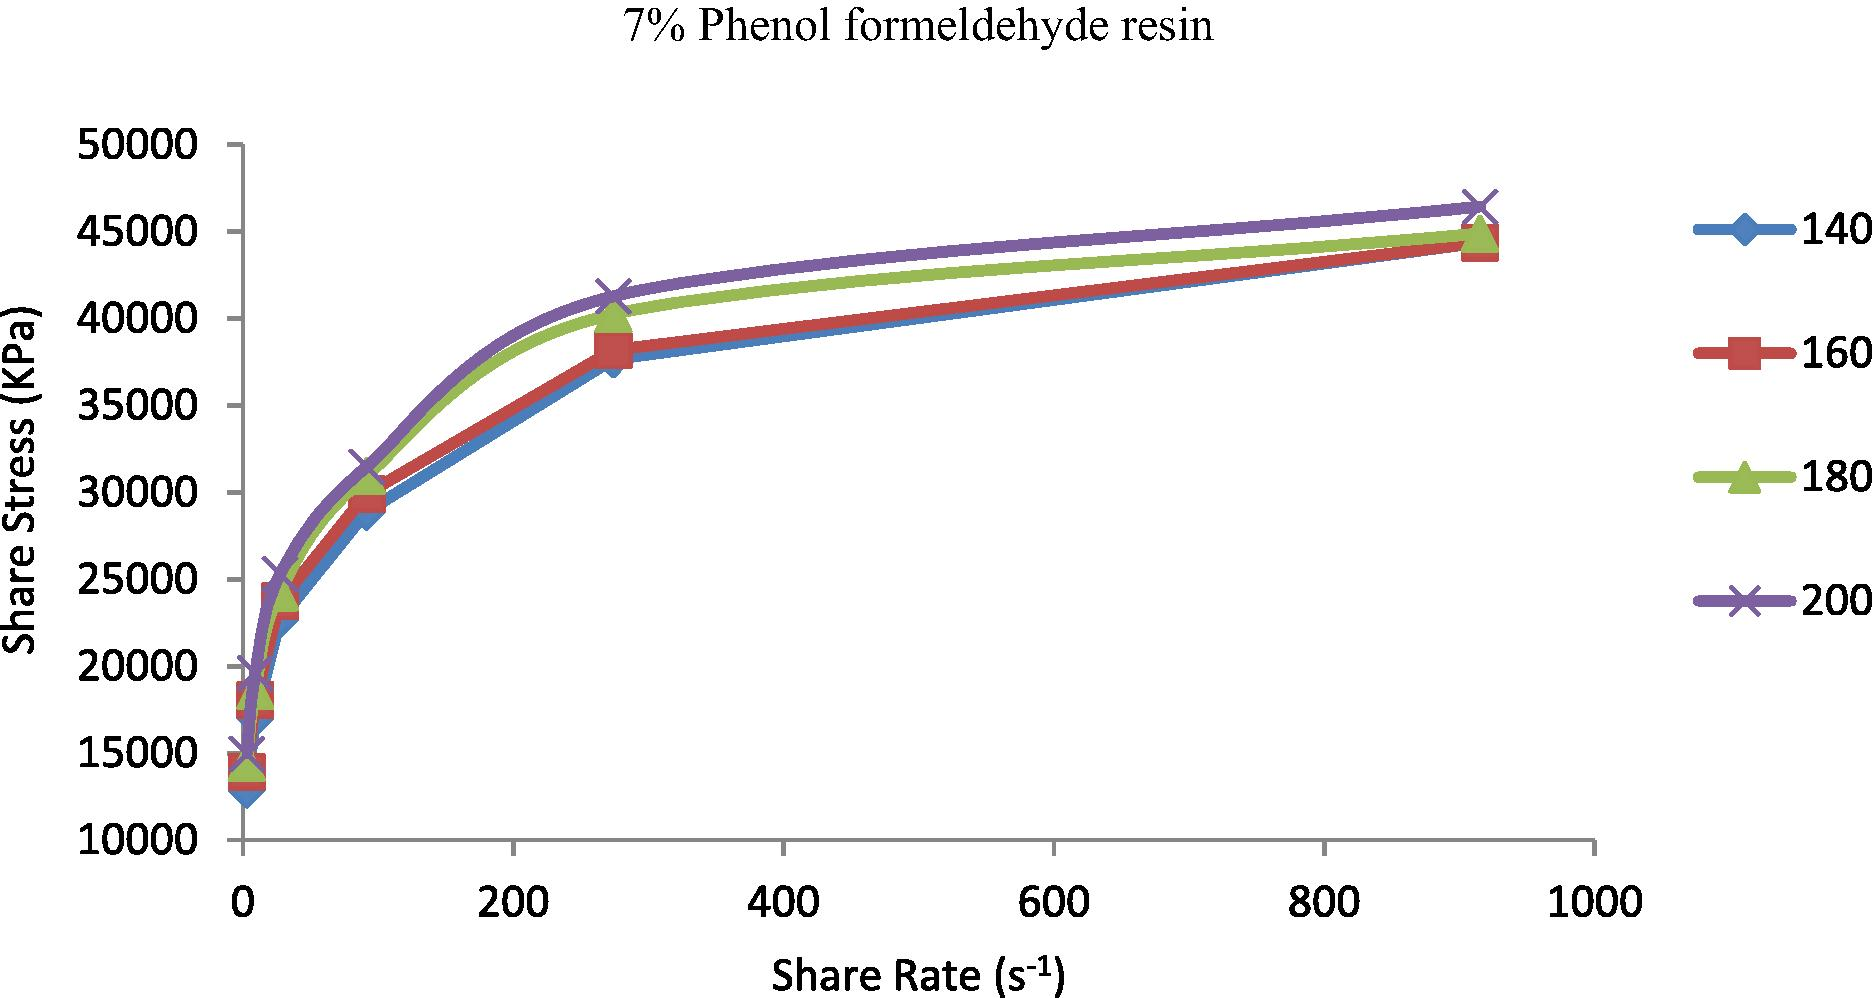
Shear stress vs. shear rate for TPE contains (7 wt.%) phenol formaldehyde resin at temperatures 140, 160, 180 and 200 °C.
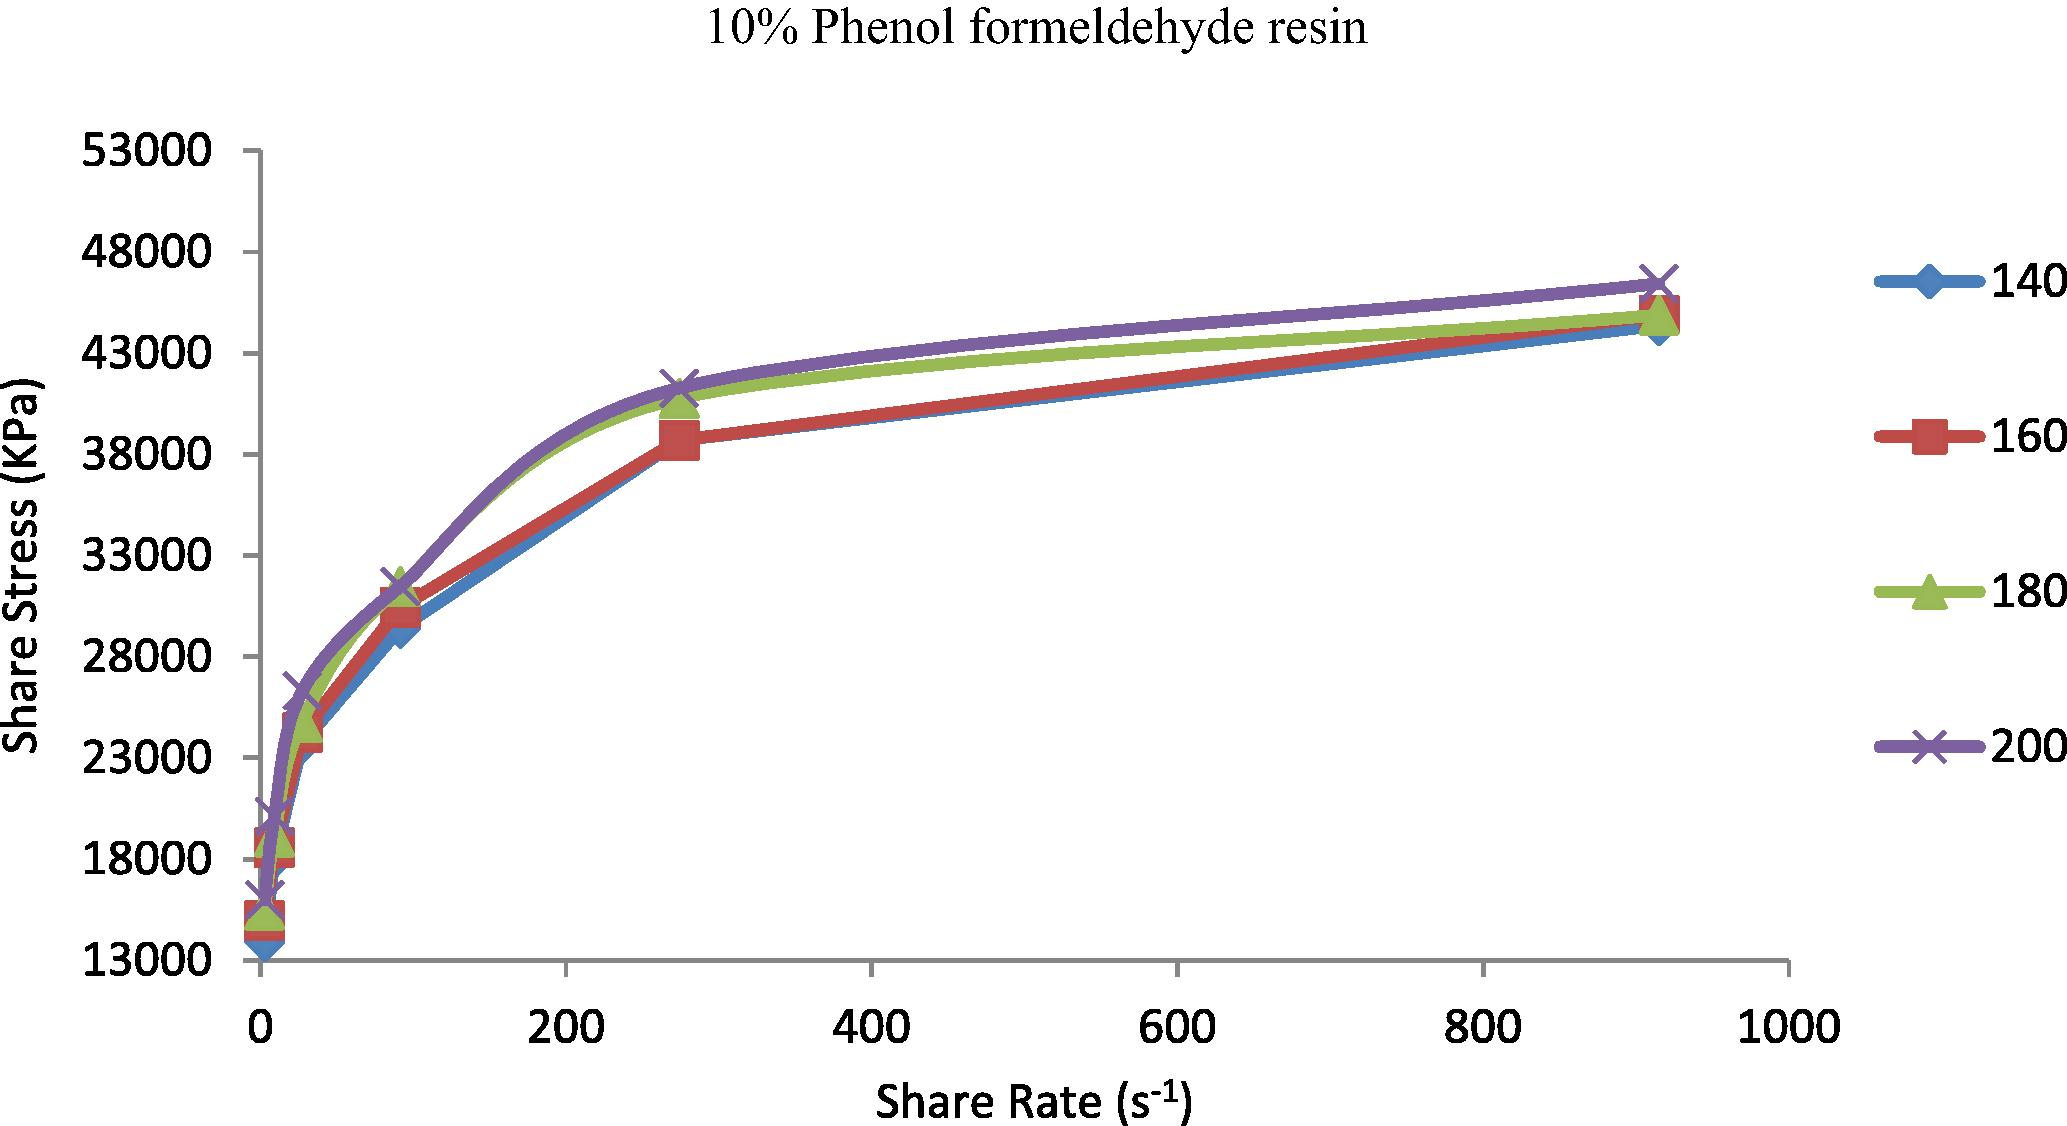
Shear stress vs. shear rate for TPE contains (10 wt.%) phenol formaldehyde resin at temperatures 140, 160, 180 and 200 °C.
4 Conclusion
The TPEs have been prepared from High density polyethylene (HDPE)/Polybutadiene (PB) (HDPE/PB = 70/30 parts) blends containing 1, 3, 5, 7 and 10 phr (parts per hundred) of dimethylol phenolic resin as a vulcanizing agent in the presence of SnCl2 as catalyst. Complete vulcanization between the two blended polymers was reached with the 5% of phenol formaldehyde resin (vulcanizing agent). The optimum temperature for processing can be in the range 160–200 °C. The activation energy for viscous flow of TPEs decreased with an increase in shear rate. This behavior is evidence that the vulcanizing ability of the phenol formaldehyde resin has acted between the two polymers. The discontinuity of the flow curve (shear stress vs. shear rate curve) of the TPE was eliminated with 5% of the vulcanizing agent. It has been found that the shear stress and shear viscosity increase with increased shear rate over a range of loading levels of vulcanizing agent of 1%, 3%, 5&, 7% and 10%. This may be attributed to the increased vulcanization between polyethylene and the rubber blend. The flow behavior index of the system indicates a pseudo plastic nature behavior, since n < 1. The increase in the phenol formaldehyde resin content and the temperature yielded in an increase in the consistency index (K) of the polymer melts which means more viscose materials prepared.
References
- Effects of mixing sequence on peroxide cured polypropylene (PP)/ethylene octene copolymer (EOC) thermoplastic vulcanizates (TPVs). Part. II. Viscoelastic characteristics. J. Poly. Res.. 2011;18:31-39.
- [Google Scholar]
- Influence of Engage® copolymer type on the properties of Engage®/Silicone rubber–based thermoplastic dynamic vulcanizatese. Express Polym. Lett.. 2008;2:846-854.
- [Google Scholar]
- Permeation characteristics and modeling of barrier properties of multifunctional rubber nanocomposites. Polymer. 2011;52:1562-1576.
- [Google Scholar]
- Thermoplastic elastomers based on dynamicly vulcanized elastomer-thermoplastic blends. In: Holden G., Kricheldorf H.R., Quirk R.P., eds. Thermoplastic Elastomers. Munich: Carl Hanser Verlag; 2004. pp. 143–182
- [Google Scholar]
- Thermoplastic Elastomers from Rubber-Plastic Blend. New York: Ellis Harwood; 1990.
- Doney, W.G., 2002. US Patent 2002002880.
- Handbook of Thermoplastic Elastomers. New York: William Andrew Publishing; 2007.
- Rheological behaviour of thermoplastic elastomers from polypropylene/acrylonitrile–butadiene rubber blends: effect of blend ratio, reactive compatibilization and dynamic vulcanization. Polymer. 1999;40:4325-4344.
- [Google Scholar]
- Reactive melt processing of polyethylene: effect of peroxide action on polymer structure, melt rheology and relaxation behaviour. Polymer. 1997;38:6175-6180.
- [Google Scholar]
- The rheology and processing of olefin-based thermoplastic vulcanizates. Rubb. Chem. Technol.. 1982;55:1448-1463.
- [Google Scholar]
- Rheology and Processing of Polymeric Materials. Oxford: Oxford University Press; 2007.
- Rheological studies of dynamically vulcanized and mechanical blends of polypropylene and ethylene-propylene rubber. Rubb. Chem. Technol.. 1995;68:728-738.
- [Google Scholar]
- Influence of type of vulcanization on rheological and thermal properties of PP/NR blends. Polym. Bull.. 2006;56(2–3):285-291.
- [Google Scholar]
- Effect of dynamic cross-linking on melt rheological properties of polypropylene/ethylene-propylene-diene rubber blends. J. Appl. Polym. Sci.. 2000;77:1488-1505.
- [Google Scholar]
- Rheological behavior of low-density polyethylene (LDPE)-polydimethylsiloxane rubber (PDMS) blends. J. Elast. Plast.. 2005;37:149-168.
- [Google Scholar]
- Kear, K.E., 2003. Developments in thermoplastic elastomers. Rapra Technology Limited, Shawbury.
- Rheological studies of modified maleated polyethylene/medium density polyethylene blends. Malay. Polym. J.. 2008;3:54-64.
- [Google Scholar]
- Effect of rubber–filler interaction on transport of aromatic liquids through high density polyethylene/ethylene propylene diene terpolymer rubber blends. Ind. Eng. Chem. Res.. 2012;2012(51):6697-6704.
- [Google Scholar]
- Majeed, M.H., 2002. MSc. Thesis, University of Basrah, Basrah.
- Mohamad, Z.B., 2007. Ph.D. Thesis, University Sains Malaysia, Pulau Penang.
- Characterization of epoxidized natural rubber/ethylene vinyl acetate (ENR-50/EVA) blend: effect of blend ratio. J. Appl. Polym. Sci.. 2006;99:1504-1515.
- [Google Scholar]
- Oil resistance of dynamically vulcanized poly (vinyl chloride)/nitrile butadiene rubber thermoplastic elastomers. Polym. Bull.. 2005;53:203-212.
- [Google Scholar]
- Optimisation of accelerators and vulcanising systems on thermal stability of natural rubber/recycled ethylene–propylene–diene-monomer blends. Mat. Design. 2014;53:651-661.
- [Google Scholar]
- Rheological properties of maleated natural rubber/polypropylene blends with phenolic modified polypropylene and polypropylene-g-maleic anhydride compatibilizers. Poly. Test. 2006;25:413-423.
- [Google Scholar]
- Synthesis and surface property variations of polypropylene-graft-poly(ethylene glycol) J. Colloid Interf. Sci.. 2001;238:43-47.
- [Google Scholar]
- Properties and biodegradation nature of thermoplastic starch. In: El-Sonbati A.Z., ed. Thermoplastic Elastomers. Rijeka: InTech; 2012. pp. 57–78
- [Google Scholar]
- Thermoplastic Melt Rheology and Processing. New York: Marcel Dekker; 1996.
- Review on energetic thermoplastic elastomers (ETPEs) for military science. Propellants Explos. Pyrotech.. 2013;38:14-28.
- [Google Scholar]
- Effects of the actual diameters and diameter ratios of barrels and dies on the elastic swell and entrance pressure drop of natural rubber in capillary die flow. J. Appl. Polym. Sci.. 2002;86:1762-1772.
- [Google Scholar]
- Steeman, P., Zoetelief, W., 2000. Rheology of TPV’s. In Proc. SPE/ANTEC 2000, Orlando, FL, 3, pp 3297–3301.
- Polypropylene/natural rubber thermoplastic elastomer: Effect of phenolic resin as a vulcanizing agent on mechanical properties and morphology. J. Appl. Polym. Sci.. 2009;112:3267-3275.
- [Google Scholar]


