

Translate this page into:
Effect of extraction solvents on fatty acid composition and physicochemical properties of Tecoma stans seed oils
⁎Corresponding author. hmsbihi@ksu.edu.sa (Hassen Mohamed Sbihi)
-
Received: ,
Accepted: ,
This article was originally published by Elsevier and was migrated to Scientific Scholar after the change of Publisher.
Peer review under responsibility of King Saud University.
Abstract
Abstract
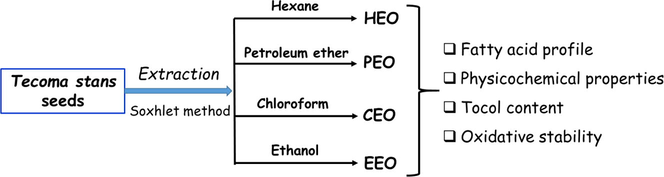
Recently, there has been renewed interest in researching valuable seed oils because of their economic importance. The aim of this study was to evaluate the effects of different extraction solvents on the quality of extract oils. Tecoma stans var. velutina seed oil (TSSO) was extracted using hexane, petroleum ether, chloroform, and ethanol as solvents. The results showed that TSSO contained a high content of monounsaturated fatty acids (MUFAs), including palmitoleic and petroselinic acids. The content of palmitoleic and petroselinic acids were significantly affected by the solvent type. Moreover, the total tocopherol and tocotrienol content were significantly higher in oil extracted with ethanol. The oxidative stability index (OSI) values were higher in oil extracted with hexane at different temperatures. The results were compared with findings based on T. stans var. stans seed oil cultivated in Saudi Arabia to evaluate the effect the plant variety and of location and climatic conditions on TSSO composition.
Keywords
Tecoma stans seeds
Fatty acids
Physicochemical properties
Oxidative stability
Tocopherols

- CEO
chloroform extract oil
- EEO
ethanol extract oil
- FAs
fatty acids
- HEO
hexane extract oil
- MUFAs
monounsaturated fatty acids
- PUFA
polyunsaturated fatty acid
- UFA
unsaturated fatty acid
- OSI
oxidative stability index
- PEO
petroleum ether extract oil
- STSO
Saudi Tecoma stans var. stans seed oil
- TTSO
Tunisian Tecoma stans var velutina seed oil
- TSSO
Tecoma stans seed oil
Abbreviations
1 Introduction
The genius Tecoma composes of 14 species. Twelve are native to Mexico and countries in South America and two are native to central Africa and belongs to the Bignoniaceae family (Kampati et al., 2018). Tecoma species has five varieties: T. stans var. stans, T. stans var. angustata, T. stans var. alata, T. stans var. sambucifolia, and T. stans var. velutina (Palmer, 2018). It has different common names such as yellow bells and yellow trumpet. T. stans is a small, evergreen tree, reaching a height of 2–3 m, and used as an ornamental plant in gardens and streets. The flowers are yellow with a tubular shape and bloom in autumn and spring. The fruit tray, when open, measures up to 12 cm in length. The soft, fibrous pod contains numerous seeds. T. stans shrubs are drought tolerant and can withstand different environmental conditions and climatic situations.
The various parts of T. stans, including flowers, leaves, and stem, have many pharmacological activities. The methanolic and ethanolic extracts were found to show anti-diabetic, anti-bacterial, anti-microbial, antioxidant, anti-cancer, and anti-ulcer activity (Kampati et al., 2018).
Vegetable oils are used for many food and industrial purposes, and the oil quality is associated with its FA composition. Varnham (2015) reported that oilseed FA composition and unsaponifiable substance content depends on the plant variety, degree of ripening seeds, and climatic conditions. Several studies have documented that temperature is the predominant environmental factor affecting FA composition, especially for unsaturated fatty acids (UFAs) (Hou et al., 2006).
A correlation between geographical latitude and FA composition has been recognized for many oilseed crops (Lajara et al., 1990). Previous researchers have reported that as growth temperature decreases, the proportion of UFAs (hexadecenoic and octadecenoic acids) increases (Marr and Ingraham, 1962). Moreover, Hou et al. (2006) reported that increased oleic acid (18:1) levels and decreased linoleic (18:2) and linolenic acid (18:3) levels have been reported as a result of increased temperatures during seed development.
Seed oil extraction can be carried out in several ways, including the Soxhlet method using a polar protic solvent such as ethanol, polar aprotic solvent such as chloroform, or nonpolar solvent such as hexane and petroleum ether. Various studies have been published on how the different extraction solvents impact the oil quality, especially the oil yield and bioactive compound levels (Oladipo and Betiku, 2019; Stevanato and da Silva, 2019).
Although there are many reports on T. stans, most are restricted to the photochemical properties of extracted compounds from flowers, leaves, and stems. There is little information on seed oil quality including FA profile, physicochemical properties, and bioactive compounds. Furthermore, there have been no previously published studies on the effects of location and climatic conditions on T. stans seed oil (TSSO) FA composition. Also, no previous study has assessed the effect of organic solvents on the FA composition and quality of oil extracted from T. stans seeds (TSS).
The primary aim of this paper is to assess the FA profile of TSSO cultivated in Tunis (Tunisia). The secondary aim is to study the effect of organic solvent extraction using the Soxhlet method on the FA composition, physicochemical properties, oxidative stability, and tocol content. This study provides an opportunity to advance our knowledge of TSSO.
2 Materials and methods
T. stans var. velutina fruits were collected from the northern part of Tunis (Tunisia). The seeds were isolated, cleaned, and then gently ground. Next, the ground solids were divided into 12 parts of equal mass and placed inside thimbles. Seed oil extraction was carried out for 8 h using a Soxhlet apparatus. Hexane, petroleum ether, chloroform, and ethanol were used as extraction solvents and there were three replicates (thimbles) for each solvent. After removing the solvent, the extracted oils were weighed.
Acidity, peroxide value, and saponification value were determined using ISO 660, ISO 3960, and ISO 3657, respectively. The refractive index, kinematic viscosity, and oil density were determined using an Abbe refractometer (Bellingham and Stanley Ltd, Kent, England), Ubbelohde type Viscometer size 2 (Koehler Instrument Company, Inc., Bohemia, NY), and density meter DM40 (Mettler-Toledo, Columbus, OH), respectively. The molecular weight was calculated using the FA percentage of each extracted oil. The iodine value was calculated using the UFA percentage of each extracted oil and its constant (Ham et al., 1998). The chlorophyll and carotenoid content were determined according to the method described by Allalout et al. (2009).
The ISO 9936 standard was used to determine tocopherol and tocotrienol content as described by Nehdi et al. (2013). FA composition analysis was done according to the procedure of Mokbli et al. (2018). The oxidative stability index (OSI) was measured as previously reported by Mokbli et al. (2018).
Statistical analyses (one-way ANOVA) was conducted using GraphPad Prism software, version 5 (San Diego, CA). The groups were compared using Bonferroni’s test (all pairs of columns compared). The significance level refers to an alpha of 0.05 or less (p ≤ 0.05).
3 Results and discussion
3.1 FA composition
Table 1 summarizes the results from GC-MS-FA methyl ester analysis of the different TSS extract oils (hexane extract oil: HEO, petroleum ether extract oil: PEO, chloroform extract oil: CEO, and ethanol extract oil: EEO). HEO, PEO, CEO, and EEO are C16-carbon-rich oils with total C16-carbon FA content of 69.3, 74.0, 73.7, and 71.5%, respectively. Among the C16-carbon FAs present, palmitoleic acid (C16:1Δ9c) was the dominant FA, varying between 44% in HEO and 52.6% in PEO. The palmitoleic acid content was significantly higher (p < 0.05) in PEO (52.6%), CEO (52.5%), and EEO (51%) than in HEO (44%). To date, the highest content of palmitoleic acid has been found in macadamia oil (16–20%) (Knothe, 2010) and in sea buckthorn (40%) (Gurr et al., 2016). The present results show that TSSO cultivated in Tunis has the highest level of palmitoleic acid. Further analysis showed that the extract oils contained an important level (∼1%) of hexadecadienoic acid (C16:1Δ9c,12c). No significant difference of hexadecadienoic acid (p > 0.05) was found between HEO (1.10%), CEO (1.14%), and EEO (1.15%), which were significantly higher (p < 0.05) than that in PEO (0.92%). Though hexadecadienoic acid is not found in common fats and vegetable oils, it was found in Adonsonia digitata seed oil (0.7%), Afzelia bella oil (1.4%), Daniellia ogea seed oil (1.2%), and Menhaden oil (1–2%) (Firestone, 2013). Furthermore, the results showed that palmitic acid (C16:0) was the second highest FA in the extract oils and significantly higher in proportion in HEO (23.0%) than in PEO (19.0%), CEO (18.4%), and EEO (17.7%). Oleic (C18:1Δ9c) and petroselinic (C18:1Δ6c) acids were the two most common isomers of octadecenoic acid present in the extract oils. Oleic acid was significantly affected by the solvent type. It was higher (p < 0.05) in EEO (15.6%) than in PEO (14.0%), which was significantly higher than that in HEO (12.0%). The petroselinic acid content was not affected in PEO (4.70%), CEO (4.10%), and EEO (4.20%). On the contrary, its content was significantly higher (p < 0.05) than that in HEO (6.90%). Petroselinic acid occurs widely in many seed oils including coriander seed oil (31.3–75.1%), cumin seed oil (52.2%), and parsley seed oil (69–79.6%) (Firestone, 2013). SD: standard deviation; MUFA: monounsaturated fatty acid; PUFA: polyunsaturated fatty acid; UFA: unsaturated fatty acid; SFA: saturated fatty acid. Values having different superscripts in a row are significantly different at p ≤ 0.05.
HEO
PEO
CEO
EEO
Mean
SD
Mean
SD
Mean
SD
Mean
SD
C14:0
0.08
0.01
C16:0
23.00
0.90
19.00
0.80
18.40
0.70
17.70
0.70
C17:0
0.15
0.01
C16:1Δ9c
44.00b
1.80
52.60a
2.10
52.50a
2.00
51.00a
2.00
C16:1Δ7c
1.20b
0.05
1.50a
0.06
1.60a
0.07
1.60a
0.07
C16:2Δ9c,12c
1.10a
0.05
0.92b
0.04
1.14a
0.05
1.15a
0.05
C18:0
3.10a
0.13
3.00a
0.10
2.60b
0.10
2.95ab
0.10
C18:1Δ6c
6.90a
0.30
4.70b
0.20
4.10b
0.20
4.20b
0.20
C18:1Δ9c
12.00c
0.50
14.00b
0.60
14.60bc
0.60
15.60a
0.60
C18:1Δ13c
0.16c
0.01
0.20b
0.01
0.26a
0.01
C18:2Δ9c,12c
6.50a
0.30
3.80b
0.15
3.70b
0.15
3.80b
0.15
C20:0
0.64a
0.03
0.42c
0.02
0.50b
0.02
0.65a
0.03
C18:3Δ9c,12c,15c
0.66a
0.03
0.42b
0.02
0.44b
0.02
C22:0
0.28b
0.01
0.33a
0.02
C22:1Δ13c
0.18
0.01
Epoxy-C18:0
0.09
0.01
C24:0
0.08
0.01
MUFA
64.55b
2.00
72.80a
2.90
73.10a
2.90
72.70a
2.90
PUFA
8.25a
0.30
4.70b
0.20
5.30b
0.22
5.40b
0.20
UFA
72.80a
2.90
77.50a
3.10
78.50a
3.20
78.00a
3.20
SFA
27.21a
1.10
22.49b
0.90
21.55b
0.90
21.92b
0.90
Linoleic acid (C18:2Δ9c,12c) was the main polyunsaturated fatty acid (PUFA) in the extract oils. In addition, linolenic acid (C18:3Δ9c,12c,15c) was also identified as a PUFA in the extract oils. Linoleic and linolenic acids were significantly higher (p < 0.05) in HEO (6.50% and 0.66%, respectively) than in CEO (3.70% and 0.42%, respectively) and EEO (3.80% and 0.44%, respectively). Whereas, linoleic acid was not identified in PEO. HEO contained FAs that were not identified in PEO, CEO, and EEO, such as lignoceric acid (C24:0), erucic acid (C22:1Δ13c), and 9,10-epoxysteraric acid (epoxy-C18:0). Margaric acid (C17:0) was detected only in EEO. Furthermore, behenic acid (C22:0) was detected only in HEO and EEO.
Table 1 shows that the FA composition of the extract oils comprised a high level of monosaturated fatty acid (MUFA), ranging from 64.55 to 73.10%, and a low level of PUFA, ranging from 4.70 to 8.25%. The MUFA content was significantly higher (p < 0.05) in PEO (72.80%), CEO (73.10%), and EEO (72.70%) than in HEO (64.55%). On the contrary, PUFA and saturated fatty acid (SFA) were significantly higher (p < 0.05) in HEO (8.25% and 27.21%, respectively) than in PEO (4.70% and 22.49%, respectively), CEO (5.30% and 21.55%, respectively), and EEO (5.40% and 21.92%, respectively).
Table 2 compares the FA composition of Tunisian T. stans var. velutina seed oil (TTSO) with Saudi T. stans var. stans seed oil (STSO). STSO consisted mainly of C-18 FAs (94.93%), while TTSO consisted mainly of C-16 FAs (69.30%). STSO contained a higher level of linolenic acid (45.47%), with the presence of stearidonic acid (C18:4Δ6c,9c,12c,15c; 6.65%) and γ-linolenic acid (C18:3Δ6c,9c,12c; 1.04%). On the contrary, TTSO contained a higher level of palmitoleic acid (44%) with the presence of hexadecadienoic acid (1.10%) and petroselinic acid (6.90%). In addition, STSO had a higher PUFA content (65.01%), while TTSO had a higher MUFA content (64.55%). McKeon et al. (2016) reported that plant oils higher in MUFAs and lower in PUFAs are a good resource for high-quality biodiesel production. Furthermore, high-palmitoleic acid oil has nutraceutical applications. Akoh (2017) reported that palmitoleic acid has been proven to have several biological activities. MUFA: monounsaturated fatty acid; PUFA: polyunsaturated fatty acid; UFA: unsaturated fatty acid; SFA: saturated fatty acid.
TTSO
STSOa
Fatty acid
Mean
Family
Fatty acid
Mean
Family
C14:0
0.08
C14:0
0.02
C16:0
23.00
C16:0
6.09
isoC16:0
0.01
C17:0
C17:0
0.02
C16:1Δ9c
44.00
n-7
C16:1Δ9c
0.08
n-7
C16:1Δ7c
1.20
n-9
C16:1Δ7t
0.02
n-9
C16:2Δ9c,12c
1.10
n-4
C18:3Δ6c,9c,12c
1.04
n-6
C18:0
3.10
C18:0
4.12
C18:1Δ6c
6.90
n-12
C18:4Δ6c,9c,12c,15c
6.65
n-3
C18:1Δ9c
12.00
n-9
C18:1Δ9c
23.56
n-9
C18:1Δ13c
0.16
n-5
C18:1 Δ11c
0.61
n-7
C18:2Δ9c,12c
6.50
n-6
C18:2Δ9c,12c
11.48
n-6
C20:0
0.64
C20:0
0.30
C18:3Δ9c,12c,15c
0.66
n-3
C18:3Δ9c,12c,15c
45.47
n-3
C22:0
0.28
C22:1Δ13c
0.18
n-9
C20:1Δ11c
0.12
n-9
Epoxy-C18:0
0.09
C18:1Δ8t
0.03
C24:0
0.08
SFA
27.21
SFA
10.56
UFA
72.80
UFA
89.43
MUFA
64.55
MUFA
24.42
PUFA
8.25
PUFA
65.01
UFA/SFA
2.68
UFA/SFA
8.46
PUFA/MUFA
0.34
PUFA/MUFA
2.66
This finding broadly supports the findings of other studies linking the proportion of MUFAs, including oleic and palmitoleic acids, with temperature. As growth temperature decreases, the MUFA content increases (Marr and Ingraham, 1962; Onemli, 2012). During the main growth period of T. stans, the temperature ranged from 14 to 26 °C in Tunis (Tunisia) and from 26 to 39 °C in Riyadh (Saudi Arabia), which could explain the higher MUFA content in TTSO. Furthermore, Neidleman (1987) reported that the temperature value affects the synthesis of desaturase molecules. Thus, different FAs can be produced through different biosynthetic pathways.
3.2 Physicochemical properties
Table 3 summarizes the physicochemical properties of HEO, PEO, CEO, and EEO. The oil content in CEO (25%) was significantly higher (p < 0.05) than that in EEO (22%). Furthermore, there was no significant difference (p > 0.05) between the oil content in HEO (23%) and PEO (24%). There were also no significant differences (p > 0.05) between the iodine values, saponification values, kinematic viscosities, specific gravities, and refractive indexes of HEO, PEO, CEO, and EEO. The free FA in EEO (4.90%) was significantly higher (p < 0.05) than that in CEO (3.80%) and PEO (3.50%), which were significantly higher (p < 0.05) than that in HEO (3%). This result can be explained by the fact that free FAs are more soluble in polar solvents, especially polar protic solvents such as ethanol. Free FAs are an important quality indicator during oil processing and storage. The initial peroxide values of HEO (3.80 meq O2/kg oil) and EEO (3.30 meq O2/kg oil) were significantly lower (p < 0.05) than those of PEO (8.60 meq O2/kg oil) and CEO (5.30 meq O2/kg oil). These results reveal that the peroxide values depend on the solvent type. Overall, the solvent type did not affect the quality parameters related to the carbon chain length and the number of double bonds of FAs, such as molecular weight, iodine value, saponification value, and specific gravity. Chlorophyll and carotenoid content were significantly higher (p < 0.05) in EEO (8.20 and 12.70 mg/kg, respectively) than in CEO (6.60 and 10.10 mg/kg, respectively), which were significantly higher (p < 0.05) than that in HEO (5.10 and 8.0 mg/kg, respectively) and PEO (5.08 and 7.45 mg/kg, respectively). In accordance with the present study, previous studies have demonstrated that the chlorophyll and carotenoid content are significantly affected by the solvent type and that ethanol was the best extraction solvent with respect to chlorophyll and carotenoid (Cha et al., 2010; Herch et al., 2014). SD: Standard deviation. Values having different superscripts in a row are significantly different at p ≤ 0.05. SD: Standard deviation. Values having different superscripts in a row are significantly different at p ≤ 0.05.
HEO
PEO
CEO
EEO
Mean
SD
Mean
SD
Mean
SD
Mean
SD
Molecular weight (g/mol)
829.6a
33.0
830.5a
42.3
824.8a
33.00
827.6a
33.00
Iodine value (g I2/100 g)
74.60a
3.00
75.8a
3.00
77.5a
3.10
77.2a
3.10
Saponification value (mg/KOH/g oil)
203.00a
8.00
204.00a
8.20
204.00a
8.00
203.6a
8.20
Kinematic viscosity (mm2/s)
28.00a
2.00
27.5a
2.00
27.2a
2.00
27.5a
2.00
Density (g/cm3) at 25 ⁰C
0.9189a
0.002
0.9194a
0.002
0.9196a
0.002
0.9194a
0.002
Refractive index at 25 ⁰C
1.466a
0.0003
1.466a
0.0004
1.467a
0.0004
1.467a
0.0004
Oil yield (wt.%)
23.00ab
1.00
24.00ab
0.90
25.00a
1.00
22.00b
0.90
Free fatty acid (as oleic %)
3.00c
0.20
3.50b
0.20
3.80b
0.15
4.90a
0.20
Peroxide value (meq O2/kg oil)
3.80c
0.15
8.60a
0.30
5.30b
0.20
3.30c
0.20
Chlorophylls (mg/kg)
5.10a
0.25
5.08a
0.28
6.60b
0.30
8.20c
0.30
Carotenoids (mg/kg)
8.0a
0.40
7.45a
0.35
10.10b
0.40
12.70c
0.50
HEO
PEO
CEO
EEO
Mean
SD
Mean
SD
Mean
SD
Mean
SD
OSI (h, 100 °C)
28.3a
0.5
27.5ab
0.5
26.8b
0.5
26.4b
0.5
OSI (h, 110 °C)
13.9a
0.3
13.6ab
0.3
13.2b
0.2
13.0b
0.2
OSI (h, 120 °C)
6.4a
0.2
6.2ab
0.2
6.1b
0.1
6.0b
0.1
OSI (year, 25 °C)
3.6a
0.24
3.33a
0.12
3.3a
0.1
3.25a
0.1
α-tocopherol (mg/100 g oil)
60.8c
2.5
62.4bc
2.5
68.9b
2.8
79.50a
3.20
β-tocopherol (mg/100 g oil)
0.6c
0.03
0.62c
0.03
0.98b
0.04
1.70a
0.07
γ-tocopherol (mg/100 g oil)
3.10c
0.10
3.20c
0.15
4.40b
0.20
5.20a
0.20
δ-tocopherol (mg/100 g oil)
1.00b
0.04
1.00b
0.05
1.20b
0.04
1.70a
0.07
γ-tocotrienol (mg/100 g oil)
3.00b
0.12
3.00b
0.10
3.20b
0.15
4.00a
0.20
δ-tocotrienol (mg/100 g oil)
0.74c
0.03
0.67bc
0.03
0.63b
0.03
1.10a
0.05
Total (mg/100 g oil)
69.30c
2.80
71.00c
2.90
79.20b
3.20
93.20a
3.70
Table 5 presents the physicochemical properties of STSO and TTSO. Tunisian TSS are rich in oil (23%) when compared with Saudi TSS (15%). TTSO had a high saponification value (203 mg KOH/g oil) when compared with STSO (193 mg KOH/g oil), while TTSO had a lower molecular weight (829.6 g/mol) than did STSO (873.6 g/mol). The saponification value is inversely proportional to the molecular weight of the oil. Furthermore, the iodine value of STSO (180.4 g I2/100 g oil) was much higher than that of TTSO (74.6 g I2/100 g oil). These results can be attributed to the high PUFA level in STSO. TTSO is classified as a non-drying oil, whereas STSO is classified as a drying oil. The chlorophyll and carotenoid content in STSO (1.84 mg/kg and 2.49 mg/kg, respectively) were lower than that in TTSO (5.17 mg/kg and 8 mg/kg, respectively). The color in vegetable oils is related to the carotenoid content, which imparts yellow and red colors to the oil, and the chlorophyll content, which is responsible for the greenish color.
STSOa
TTSO
Physicochemical parameters
Unit
Mean
Mean
Color
Yellow
Green-yellow
State at ambient temperature
Liquid
Liquid
Yield
% (w/w)
15
23
Refractive index (25 °C)
1.4759
1.466
Kinematic viscosity (40 °C)
mm2/s
28.26
28.00
Unsaponifiable matter
(%, w/w)
0.94
0.92
Saponification value
mg KOH/g oil
193.00
203.00
Peroxide value
meq O2/kg oil
5.48
3.80
Free fatty acid
as oleic %
0.38
3.00
Acid value
mg KOH/g
0.76
6.00
Iodine value
g I2/100 g oil
180.40
74.60
Molecular weight
g/mol
873.60
829.6
Chlorophylls
mg/kg
1.84
5.17
Carotenoids
mg/kg
2.49
8.0
α-tocopherol
mg/100 g oil
5.33
60.8
β-tocopherol
mg/100 g oil
1.33
0.6
γ-tocopherol
mg/100 g oil
210
3.10
δ-tocopherol
mg/100 g oil
0
1.00
γ-tocotrienol
mg/100 g oil
0
3.00
δ-tocotrienol
mg/100 g oil
49.59
0.74
3.3 Oxidative stability
Table 4 displays the OSI values of HEO, PEO, CEO, and EEO. These values were measured at three different temperatures (100, 110, and 120 °C). At the three temperatures, the OSI values of HEO (28.3, 13.9, and 6.4 h, respectively) were significantly higher (p < 0.05) than the OSI values of CEO (26.8, 13.2, and 6.1 h, respectively) and EEO (26.4, 13.0, and 6.0 h, respectively). In addition, no significant difference (p > 0.05) was found between the OSI values of HEO and PEO at the three different temperatures. Mokbli et al. (2018) reported that seed oils containing high SFA levels and low PUFA levels remarkably enhance the OSI values. The OSI value of TTSO extracted with hexane at 110 °C (13.9 h) was much higher than that in soybean oil (2 h), cottonseed oil (3.6 h), peanut oil (6.5 h), and corn oil (4.7 h). The OSI value of TTSO was similar to that of high-oleic sunflower oil (12 h) and high-oleic safflower oil (12 h) owing to the high MUFAs. The OSI values of HEO, PEO, CEO, and EEO at 25 °C were 3.60, 3.33, 3.30, and 3.25 year, respectively. The OSI value of HEO at 25 °C was lower than that found in Chamaerops humilis seed oil (6.60 h) (Mokbli et al., 2018). This difference can be explained by the high SFA content (36%) in Chamaerops humilis seed oil.
3.4 Tocopherol and tocotrienol composition
Table 4 shows the α-tocopherol, β-tocopherol, γ-tocopherol, δ-tocopherol, γ-tocotrienol, δ-tocotrienol content in the extract oils. The total vitamin E (tocopherol and tocotrienol) levels in HEO, PEO, CEO, and EEO were 69.3, 71.0, 79.2, and 93.2 mg/100 g oil, respectively. α-tocopherol was the major vitamin E isomer found in the extract oils (∼90% of the total vitamin E). The total vitamin E was significantly higher (p < 0.05) in EEO than in CEO, which was significantly higher (p < 0.05) than corresponding values in HEO and PEO. Stevanato and da Silva (2019) stated that the total vitamin E in radish seed oil extracted with ethanol (164.75 mg/100 g oil) was higher than that obtained with n-hexane (106.71 mg/100 g oil). Moreover, Uoonlue and Muangrat (2018) found that total vitamin E was higher using an isopropanol extractor (23.84 mg/100 g oil) than that obtained with petroleum (20.84 mg/100 g oil) and n-hexane (16.88 mg/100 g oil).
Table 5 shows that the total vitamin E content in STSO (266.25 mg/100 g oil) was much higher than that found in TTSO. Moreover, γ-tocopherol was the major vitamin E isomer found in STSO, whereas α-tocopherol was the major isomer in TTSO. In accordance with the present result, Shahidi, 2005 reported that the total tocopherol content in the seed oil can be affected by variety, planting location, and temperature of seed storage. In addition, a high tocopherol content constitutes a natural protection of PUFAs against oxidation. Ball (2006) reported that α-tocopherol has different biological activities and is used as an antioxidant to stabilize animal fats and vegetable oils. It blocks the conversion of UFAs to their corresponding hydroperoxides. Furthermore, α-tocopherol has stronger antioxidant properties than do β-, γ-, and δ-tocopherol isomers.
4 Conclusion
In summary, the present study demonstrated that the type of solvent affects the FA composition, OSI, and tocopherol and tocotrienol content of TSSO. In addition, the study showed that oil extracted from T. stans var. velutina growing in Tunisia is a rich source of MUFAs (∼70%). Palmitoleic, oleic, and peroselinic acids are the main MUFAs (∼95% of total MUFAs) present. Moreover, this study confirmed that the plant variety, location and climatic conditions affect the FA profile of TSSO. TSSO growing in Tunisia showed significant differences in FA composition and physicochemical properties when compared with TSSO growing in Saudi Arabia. High-MUFA oils show a good resistance against oxidation and have nutritional benefits, comparable to those of olive oil. The findings of this study have some important implications for future use of TSSO growing in Tunisia in both food and non-food industries.
Acknowledgments
The authors would like to extend their sincere appreciation to King Saud University (Riyadh, Saudi Arabia) for the support of this research through Researchers Supporting Project number (RSP-2019/137).
Declaration of Competing Interest
The authors declare that they have no known competing financial interests or personal relationships that could have appeared to influence the work reported in this paper.
References
- Characterization of virgin olive oil from super intensive Spanish and Greek varieties grown in northern Tunisia. Sci. Hortic.. 2009;120:77-83.
- [Google Scholar]
- Food Lipids, Chemistry, Nutrition, and Biotechnology (fourth ed.). Boca Raton, FL: Taylor & Francis Group; 2017.
- Vitamins in Foods: Analysis, Bioavailability, and Stability. Boca Raton, FL: CRC Press; 2006.
- Optimization of pressurized liquid extraction of carotenoids and chlorophylls from Chlorella vulgaris. J. Agric. Food Chem.. 2010;58(2):793-797.
- [CrossRef] [Google Scholar]
- Physical and Chemical Characteristics of Oils, Fats, and Waxes (third ed.). Urbana, IL: AOCS Press; 2013.
- Lipids: Biochemistry, Biotechnology and Health (sixth ed.). New York: Wiley-Blackwell; 2016.
- Calculating the iodine value for marine oils from fatty acid profiles. J. Am. Oil Chem. Soc.. 1998;75(10):1445-1446.
- [Google Scholar]
- Physicochemical properties and antioxidant activity of Tunisian date palm (Phoenix dactylifera L.) oil as affected by different extraction methods. Food Sci. Technol.. 2014;34(3):464-470.
- [CrossRef] [Google Scholar]
- Environmental effects on fatty acid levels in soybean seed oil. J. Am. Oil Chem. Soc.. 2006;83(9):759-763.
- [CrossRef] [Google Scholar]
- Biodiesel derived from a model oil enriched in palmitoleic acid, Macadamia Nut Oil. Energy Fuels. 2010;24(3):2098-2103.
- [CrossRef] [Google Scholar]
- Definite influence of location and climatic conditions on the fatty acid composition of sunflower seed oil. J. Am. Oil Chem. Soc.. 1990;67(10):618-623.
- [CrossRef] [Google Scholar]
- Effect of temperature on the composition of fatty acids in Escherichia coli. J. Bacteriol.. 1962;84:1260-1267.
- [Google Scholar]
- Industrial Oil Crops. Urbana, IL: AOCS Press; 2016.
- Characteristics of Chamaerops humilis L. var. humilis seed oil and study of the oxidative stability by blending with soybean oil. J. Food Sci. Technol.. 2018;55:2170-2179.
- [CrossRef] [Google Scholar]
- Evaluation and characterisation of Citrullus colocynthis (L.) Schrad seed oil: Comparison with Helianthus annuus (sunflower) seed oil. Food Chem.. 2013;136(2):348-353.
- [CrossRef] [Google Scholar]
- Effects of Temperature on Lipid Unsaturation. Biotechnol. Genet. Eng. Rev.. 1987;5(1):245-268.
- [CrossRef] [Google Scholar]
- Process optimization of solvent extraction of seed oil from Moringa oleifera: An appraisal of quantitative and qualitative process variables on oil quality using D-optimal design. Biocatal. Agric. Biotechnol.. 2019;20:101187
- [CrossRef] [Google Scholar]
- Impact of climate change on oil fatty acid composition of peanut (Arachis hypogaea L.) in three market classes. Chilean J. Agric. Res.. 2012;72(4):483-488.
- [CrossRef] [Google Scholar]
- Palmer, G.D, 2018. Varieties of the Esperanza Plant. http://homeguides.sfgate.com/varieties-esperanza-plant-47912.html (Accessed 02 March 2020).
- Physico-chemical properties of Tecoma stans Linn. Seed oil: a new crop for vegetable oil. Nat. Prod. Res.. 2015;29(13):1249-1255.
- [CrossRef] [Google Scholar]
- Bailey’s Industrial Oil and Fat Products. Hoboken, New Jersey: John Wiley & Sons, Inc.; 2005.
- Radish seed oil: ultrasound-assisted extraction using ethanol as solvent and assessment of its potential for ester production. Ind. Crops prod.. 2019;132:283-291.
- [CrossRef] [Google Scholar]
- Effect of different solvents on subcritical solvent extraction of oil from Assam tea seeds (Camellia sinensis var. assamica): Optimization of oil extraction and physicochemical analysis. J. Food Process Eng.. 2018;42(2):e12960
- [CrossRef] [Google Scholar]
- Seed Oil: Biological Properties, Health Benefits and Commercial Applications (first ed.). New York: Nova Science Publishers Inc; 2015.


