

Translate this page into:
Effect of environmental pollutants particulate matter PM2.5, PM10, nitrogen dioxide (NO2) and ozone (O3) on obesity
⁎Corresponding author. smeo@ksu.edu.sa (Sultan Ayoub Meo)
-
Received: ,
Accepted: ,
This article was originally published by Elsevier and was migrated to Scientific Scholar after the change of Publisher.
Abstract
Background
Environmental pollution is a highly challenging global health concern, affecting the natural ecosystem and human health. The obesity risk is allied to diverse factors, including genetics, behaviour, food, and socio-cultural conditions, however, literature is lacking in exploring the effect of environmental pollution on obesity and the causal pathways are not fully understood. Therefore, this study aimed to investigate the effect of environmental pollutants particulate matter PM2.5 μm, PM10 μm, Nitrogen Dioxide (NO2), and ground level Ozone (O3) on obesity.
Methods
This study recorded data on air pollutants and obesity using the electronic platforms Pub Med, Web of Science, Scopus, and Google Scholar. The keywords included for the literature search were based on a combination of two main aspects, which were used to represent exposure (air pollutants), and outcome (obesity). Initially, 324 articles and reports were identified, and after revising the abstracts and full articles, 12 studies were selected for a detailed analysis and discussion. The Odds Ratio (OR) and 95 % confidence intervals (CIs) were extracted to investigate the impact between air pollutants and obesity. The Cochrane chi-squared test (Chi2), fixed-effects design was used when I2 < 50 % and P > 0.05; otherwise, a random-effects model was adopted.
Results
Environmental pollutants, particulate matter PM2.5 (OR = 1.18; 95 % CI: 1.10–1.25p < 0.01), PM10 (OR = 1.11; 95 % CI: 1.02–1.20; p < 0.01), Nitrogen Dioxide NO2 (OR = 1.14; 95 % CI: 1.02–1.28; p = 0.03), ground-level Ozone O3 (OR = 1.01; 95 % CI: 1.00–1.01; p = 0.01) were significantly and positively associated with obesity.
Conclusions
Environmental pollution could be a risk factor for obesity. The potential mechanisms involved in the pathogenesis of this relationship are oxidative stress, inflammation, hormonal disruption, and adipose tissue function alteration. Addressing this multifaceted issue requires collaboration between public health officials, policymakers, and the public at large. Moreover, raising public awareness is a crucial step towards mitigating the impact of environmental pollution on obesity.
Keywords
Environmental pollution
PM2.5
PM10
NO2
O3
Obesity

1 Introduction
Worldwide, the escalating occurrence of obesity has reached an epidemic scale, causing a substantial burden on public healthcare systems and economies. Obesity has emerged as a critical global health challenge, affecting individuals of all ages, genders, socioeconomic backgrounds, and geographic locations. The obesity outburst is attributed to a complex relationship of genetics, behaviour, food, and socio-cultural conditions (Swinburn et al., 2011; Verde et al., 2023; Centers for Disease Control Prevention (CDC, 2023). Moreover, rapid urbanization, sedentary lifestyles, increased availability of calorie-dense foods and environmental pollution have exacerbated this issue, leading to an alarming rise in obesity-related comorbidities, including coronary artery disease, type 2 diabetes mellitus, neuropsychiatric disorders, and cancers (Swinburn et al., 2011; Verde et al., 2023; Stierman et al., 2021).
Worldwide, from 1975 to 2016, the prevalence of obesity has markedly increased. It has major public health consequences and is one of the leading risk factors for chronic debilitating diseases. The World Health Organization in 2016 reported that there were about 1.9 billion overweight adults, among them 650 million were obese, which equals 13 %, among them 10.8 % were males and 14.9 % were females (World Health Organization, 2023). In the US, the obesity prevalence was 41.9 %, ranked the state with the highest prevalence rates among the high-income nations (Stierman et al., 2021).
The most recent report published in the obesity atlas, 2023 reported that “over 4 billion people may be affected by 2035, compared with about 2.6 billion in 2020. This figure reflects an increased rate from 38 % of the world’s population in 2020 to over 50% by 2035”. Obesity causes 4.7 million premature deaths each year. The economic impact of overweight and obesity is estimated to surpass $4.32 trillion annually by 2035 if prevention measures are not implemented appropriately (World Obesity, 2023).
The prevalence and pathogenesis of obesity are complex and involve numerous factors. However, in recent years, the scientific community has highlighted the role of environmental pollution in the pathogenesis of obesity. Environmental pollution and obesity characterize significant public health concerns in this modern world. While literature highlights distinct issues, emerging research has uncovered a multifaceted relationship between air pollution and obesity. The literature is lacking in exploring the effect of environmental pollution on obesity and the causal pathways underlying mechanisms are not fully understood. Therefore, this study aimed to address the gaps in the literature by exploring the impact of environmental pollutants particulate matter PM2.5, PM10, Nitrogen Dioxide (NO2), and ground level Ozone (O3) on obesity.
2 Materials and methods
2.1 Search strategy
The present study was conducted in the “Department of Physiology, College of Medicine, King Saud University, Riyadh, Saudi Arabia.” For the selection of documents, we followed the protocol of PRISMA “Preferred Reporting Items for Systematic Reviews and Meta-Analyses.” The literature search was performed, and data were collected using electronic platforms such as PubMed, Web of Science, Scopus, and Google Scholar, to search the literature on the relationship between air pollutants and obesity from January 2000 to June 2023. The keywords included pollutants exposure (air pollutants), and outcome (obesity). We filtered the data using the key terms “environmental pollution, air pollution, particulate matter, PM2.5, PM10, Nitrogen Dioxide (NO2), Ozone (O3) and obesity”. While using both the terms “environmental pollution and obesity,” initially, 324 documents were identified; after the screening of the full documents, 18 studies were selected, out of which finally 12 studies were included in the analysis (Fig. 1).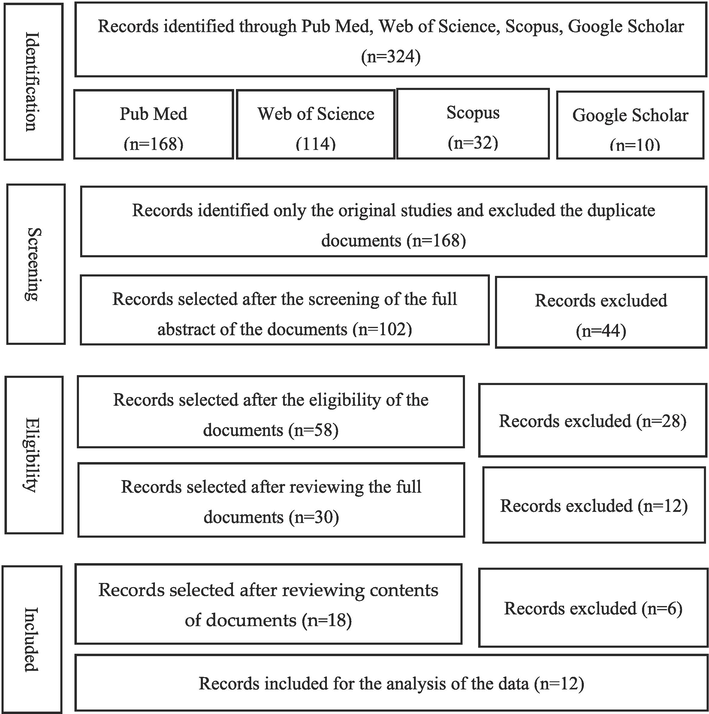
PRISMA Flow Diagram for the selection of documents.
2.2 Inclusion and exclusion criteria
The inclusion criteria were constructed on the following principles (a) air pollution exposures (PM2.5, PM10, NO2, and O3); (b) outcome: obesity status by body mass index (BMI), or waist circumference (c) article type: original research; and (d) article language, English. Moreover, articles must demonstrate the relative risks (RRs)/odd ratios (ORs)/hazard ratios (HRs) and corresponding 95 % confidence intervals (CIs). The studies were excluded from the study if they met any of the criteria below, such as studies conducted on other air pollutants like studies on the effects of smoking, studies other than original articles, such as letters, editorials, brief communications, and review articles were excluded from the study.
2.3 Statistical analysis
In this study, the literature found was from cross-sectional studies, and few were cohort design studies. Therefore, we took into consideration the methodological differences of the studies and decided to only analyze the studies with the most prevalent study design, which was cross-sectional. The odds ratio (OR) with 95 % confidence intervals (CIs) were extracted from the included studies and pooled to investigate the relationship between air pollutants and obesity using the Mantel-Haenszel method (Fidler and Nagelkerke, 2013). For studies that reported more than one value for OR (for example, one for general obesity and one for abdominal obesity), both values were used as separate data points and were labelled (A) and (B). A p-value less than p < 0.05 was considered significant. The “Cochrane chi-squared test (Chi2) was used to evaluate heterogeneity among articles, a p-value < 0.05 indicates the existence of heterogeneity. To estimate the impact of heterogeneity on the analysis, the I2 value was calculated. I2 is a measure of heterogeneity and methods for calculating the associated 95 % CI. I2 expresses the proportion of variability in the analysis. I2 values ≥ 50 % and p < 0.05 indicated a moderate to high degree of heterogeneity among pooled studies. A fixed-effects design was used when I2 < 50 % and p > 0.05; otherwise, a random-effects model was adopted” (Borenstein et al., 2010). The meta-analysis was conducted using RStudio version 2023.09.1 and package ‘meta” Egger's test was performed to evaluate publication bias and it was further assessed by the visual examination of the symmetry in funnel plots using comprehensive meta-analysis version 3, Biostat Inc, USA (Borenstein et al., 2010).
3 Results
3.1 Particulate matter PM 2.5 and obesity
Eleven cross-sectional studies reported the impact of PM2.5 on obesity and were included in the analysis. The Cochrane chi-squared test and I2 statistic revealed a significant heterogeneity (Chi2 = 555.70, p < 0.01, I2 = 97 %), so a random model was used. The forest plot analysis showed that the PM2.5 pollutant was significantly associated with obesity (OR = 1.18; 95 % CI: 1.10–1.25; p < 0.01) (Table 1, Fig. 2).
Author, study year and Country
Study type
Sample Size
Pollutants
Pollutants Associated Obesity
Chen R et al., 2022, China
Cross-sectional
47,204
PM2.5
Obesity: (OR 1.12 (95 % CI 1.09–1.14)
Zhang JS et al., 2021, China
Cross-sectional
9897
PM2.5
Abdominal Obesity OR 1.40 (95 %CI: 1.19, 1.65)
PM10
Abdominal Obesity OR 1.32 (95 %CI: 1.11, 1.55)
NO2
Abdominal Obesity OR 1.40 (95 %CI: 1.19, 1.65)
Cao S et al., 2021, China
Cross-sectional
91,052
PM2.5
A: Obesity OR 1.08 (95 % CI: 1.07, 1.10)
B: Abdominal obesity 1.10 (95 % CI: 1.09, 1.11)
De Bont et al., 2019, Spain
Cross-sectional
2660
PM2.5
Overweight/obesity- OR = 1.05; 95 % CI = 0.96, 1.15
PM10
Overweight/obese- OR = 1.10; 95 % CI = 1.00, 1.22
NO2
Overweight/obesity- OR = 1.05; 95 % CI = 0.96, 1.15
Yang Z et al., 2019a, China
Cross-sectional
13,414
PM2.5
BMI: AOR 1.009 (95 % CI-1.003, 1.016)
PM10
AOR 1.007 (95 % CI-1.003, 1.011)
NO2
BMI: AOR 1.009 (95 % CI-1.003, 1.016)
O3
BMI: 1.006 (95 % CI-1.001, 1.011)
Zhang Z et al., 2021, China
Cross-sectional
44,718
PM2.5
A: Obesity OR (95 % CI): 1.40 (1.26–1.55)
B: Central obesity (95 % CI): 1.39 (1.26, 1.54)
PM10
OR (95 % CI): A: 1.25 (1.15, 1.37) B: 1.32 (1.21, 1.45)
NO2
A: Obesity OR (95 % CI): 1.40 (1.26–1.55)
B: Central obesity (95 % CI): 1.39 (1.26, 1.54)
Yang BY et al., 2019, China
Cross-sectional
15,477
PM2.5
Obesity OR (95 % CI): 1.04 (1.01–1.06)
PM10
Obesity/overweight OR (95 % CI): 1.04 (1.01–1.06)
NO2
Obesity/overweight OR (95 % CI): 1.04 (1.01–1.06)
O3
Obesity/overweight OR (95 % CI): 1.00 (0.97–1.03)
Wu et al., 2022, China
Cross-sectional
47,990
PM2.5
Obesity OR (95 %CI): 1.29 (1.15, 1.44)
PM10
Obesity OR (95 %CI): 1.32 (1.17, 1.49)
Zheng et al., 2021, China
Cross-sectional
36,456
PM2.5
Obesity 1.185 (95 % CI: 1.054, 1.333)
PM10
OR: 1.030 (95 % CI: 0.972, 1.093)
NO2
Obesity OR 1.185 (95 % (CI): 1.054, 1.333)
O3
Obesity OR 1.041 (95 %CI: 1.001, 1.082)
Yang C et al., 2023, China
Cross-sectional
44,544
PM2.5
A: Obesity: OR 1.27 (95 % CI: 1.23, 1.31),
B: Obesity: ORs of 1.10 (95 % CI: 1.05, 1.14),
López-Gil et al., 2023, Spain
Cross-sectional
4378
PM2.5
A: Medium PM2.5 (OR = 1.23; 95 % CI, 1.02–1.49)
B: High PM2.5 (OR = 1.35; 95 % CI, 1.11–1.64)
Shin J et al., 2019, Korea
Cross-sectional
100,867
PM10
OR (95 % CI) Obesity Male: 1.07 (1.01, 1.13)
Female: 1.06 (1.00, 1.12)
NO2
OR (95 %CI) Obesity Male: 0.97 (0.91, 1.02)
Female: 1.06 (0.99, 1.13)
O3
OR (95 %CI): Obesity Male:0.98 (0.93, 1.04)
Female: 1.03 (1.00, 1.06)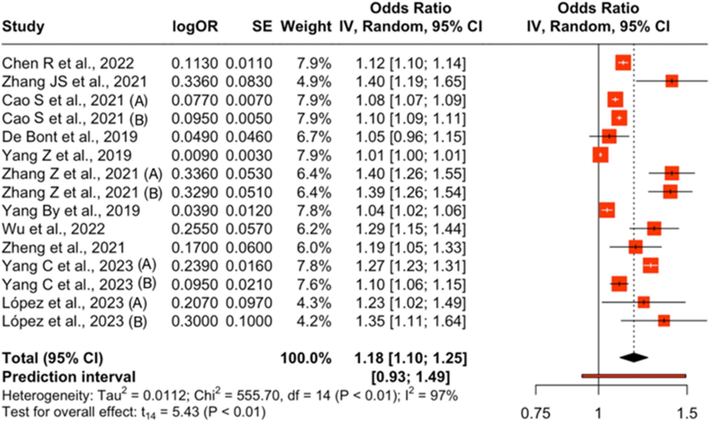
Impact of particulate matter PM 2.5 on obesity. (A) and (B) are two different ORs within the same study that were used as separate data points.
3.2 Particulate matter PM10 and obesity
For establishing the association between PM10 and obesity, eight cross-sectional studies reported the impact of PM10 on obesity and were included in the analysis. The Cochrane chi-squared test and I2 statistic revealed a significant heterogeneity (Chi2 = 68.99, p < 0.01, I2 = 88 %), so a random model was used. The forest plot analysis showed that the PM10 pollutant was significantly associated with obesity (OR = 1.11; 95 % CI: 1.02–1.20; p = 0.01) (Table 1, Fig. 3).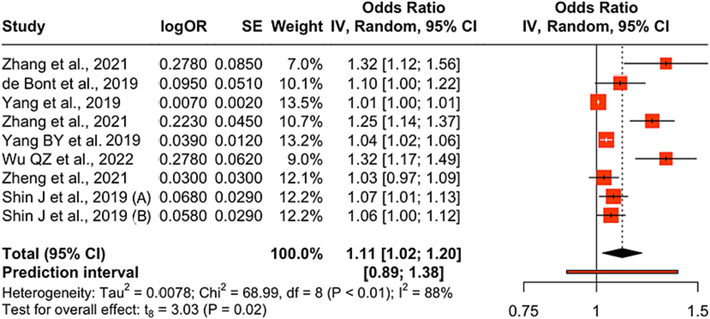
Impact of particulate matter PM10 on obesity. *(A) and (B) are two different ORs within the same study that were used as separate data points.
3.3 Nitrogen dioxide (NO2) and obesity
While searching the literature about the association between NO2 and obesity, seven cross-sectional studies reported the impact of NO2 on obesity. The Cochrane chi-squared test and I2 statistic revealed a significant heterogeneity (Chi2 = 108.25, p < 0.01, I2 = 93 %), so a random model was used. The forest plot analysis showed that the NO2 pollutant was significantly associated with obesity (OR = 1.14;95 % CI:1.02–1.28; p = 0.03) (Table 1, Fig. 4).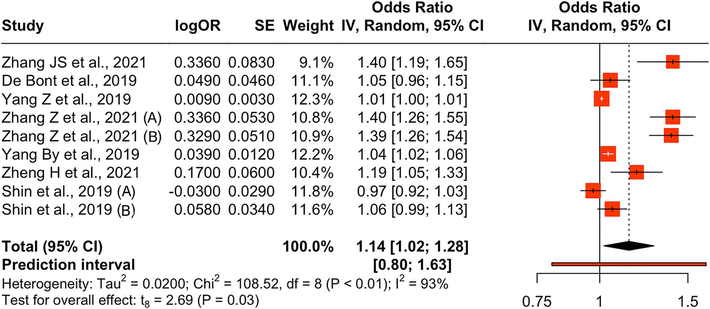
Impact of NO2 on obesity. (A) and (B) are two different ORs within the same study that were used as separate data points.
3.4 Ozone (O3) and obesity
There were 4 cross-sectional studies which were analyzed. The Cochrane chi-squared test and I2 statistic did not reveal a significant heterogeneity (Chi2 = 46.27, p = 0.18, I2 = 36 %), so a fixed model was used. The forest plot analysis showed that the O3 pollutant was significantly associated with obesity (OR = 1.01; 95 % CI: 1.00–1.01; p = 0.01) (Table 1, Fig. 5).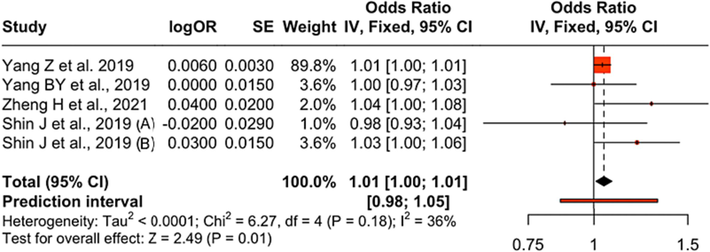
Impact of O3 on obesity. (A) and (B) are two different ORs within the same study that was used as separate data points.
4 Discussion
Environmental pollution is a global concern due to its detrimental effects on the environment, climate, and human health. The obesity risk is allied to numerous factors; however, literature is lacking in exploring the effect of environmental pollution on obesity, and the causal pathways' underlying mechanisms are not fully understood. The present study results revealed that environmental pollutants, particulate matter PM2.5, PM10, NO2, and O3 have a significant relationship with obesity. Environmental pollutants particulate matter PM2.5, PM10, NO2, and O3 are contagions of various biological, chemical, and physical elements, which adversely affect the everyday environment. Environmental pollutants directly or indirectly introduce gases, liquids, or solid substances that pollute the environment and make it hazardous to life and natural systems.
Tamayo-Ortiz et al. (2021) performed two surveys and analyzed the relationship between PM2.5 exposure and the prevalence of obesity. The results showed that 10 μg/m3 increased in PM 2.5 concentration, and the odds ratios for obesity were increased. In another study conducted in China by (Liang et al., 2022) the authors adopted a distinctive methodology and established the association between decreasing levels of PM2.5 following the implementation of environmental protection policies and the incidence of obesity among adolescents. The findings indicated a substantial decrease in BMI (β − 0.10 (95 % CI: −0.13, −0.07) as a direct outcome of reduced PM2.5 exposure (Liang et al., 2022).
Furthermore, a cohort study conducted in the United States, focusing on the elderly veteran population, showed that PM2.5 exposure was linked with increased obesity risk (Bowe et al., 2021). Surprisingly, the analyses revealed an association at PM 2.5 concentrations. These associations remained consistent in both direction and magnitude across sensitivity analyses. Similarly, (Wang et al., 2022) provided a piece of evidence that exposure to PM2.5, NO2, and O3 was adversely linked with body composition including higher fat mass.
Another study was conducted in rural areas of China to explore the link between air pollution and obesity. This study assessed this relationship by looking at six different measurements related to body size in rural Chinese regions (Yang et al., 2019). Among the four types of pollutants studied, the study showed the strongest association of PM10 with a change in BMI. However, a cross-sectional study conducted on the Korean population did not find any significant associations when the data was analyzed across various subgroups stratified by sex and age (Hwang et al., 2019).
The emerging evidence suggests that NO2 could play a role in the development and exacerbation of obesity. NO2 is generated and released during combustion processes, motor vehicle emissions, industrial activities, and power plants. A researcher (de Bont et al., 2019) conducted a study that investigated the association between air pollution and overweight and obesity in school children and identified that exposure to NO2 at schools was associated with overweight and obesity. Similarly, (Yang Z et al., 2019) investigated the impact of PM 2.5μm, PM 10μm, CO, NO2, and O3 on the BMI score. The results further revealed that the air quality index (AQI) was significantly and positively associated with the BMI score. (Zheng et al., 2021) identified that higher levels of NO2 in the environment were linked to elevated prevalence of obesity. The findings of these studies (de Bont et al., 2019; Yang Z et al., 2019; and Zheng et al., 2021) provide convincing evidence of a causal relationship between NO2 exposure and the development of obesity. Similarly, in the present study, we found that environmental pollutants, particulate matter PM2.5 (OR = 1.18; 95 % CI: 1.10–1.25p < 0.01), PM10 (OR = 1.11; 95 % CI: 1.02–1.20; p < 0.01), NO2 (OR = 1.14; 95 % CI: 1.02–1.28; p = 0.03), O3 (OR = 1.01; 95 % CI: 1.00–1.01; p = 0.01) were significantly associated with obesity.
The body of literature surrounding the link between ozone and obesity presents a diverse landscape of findings with contrasting findings. One longitudinal study conducted in schools across China aimed to discern the impact of prolonged exposure to air pollution on obesity rates among a large number of children and adolescents (Zheng et al., 2021). The results yielded a significant odds ratio of 1.041 (95 % CI: 1.001, 1.082) for obesity, corresponding to a 10 μg/m3 increase in ozone levels. Similarly, another longitudinal study targeting young adults investigated the effects of chronic ozone exposure on cardiometabolic health. After adjustments for age, ethnicity, and gender, this study also reported a significant odds ratio of 1.022 (95 % CI: 1.004.
The understanding of the mechanisms by which air pollutants, PM2.5, PM10, NO2, and ozone (O3), contribute to obesity involves several intricate pathways. Air pollution can initiate oxidative stress, disrupt the metabolism processes, enhance fat accumulation, and develop metabolic disorders and obesity (Sun et al., 2009; Xu et al., 2010). Exposure to air pollution can result in epigenetic modifications, including alterations in DNA methylation, histone modifications, and the expression of non-coding RNA. These epigenetic changes can affect the expression of genes related to inflammation, oxidative stress, cell cycle regulation, and signal transduction (Yang et al., 2019; Yang et al., 2023; Shi et al., 2022). All these facts support the hypothesis that environmental pollutants are the risk factors for developing obesity.
4.1 Study strengths and limitations
The present study’s strengths are that the analysis is based on the worldwide extensive literature with a large sample size. This study provides valuable insights for healthcare workers, policymakers, and researchers, informing them about the precise pieces of evidence on how environmental pollution causes obesity. Similar to other studies, this study has some limitations. This study analysis was based on cross-sectional studies as it was the most prevalent study design and there was a limited number of cohort studies. This study's findings are based on published studies from various regions of the world with different socioeconomic developments and air pollution. We were unable to exclude such confounding factors. While analyzing the study design, type, and homogeneity of the studies to minimize these confounding factors. Large sample-sized studies are needed to highlight more data from the various corners of the globe for a better understanding of the effect of environmental pollution on obesity.
5 Conclusions
Environmental pollutants PM2.5, PM10, NO2, and O3 were significantly associated with obesity. Environmental pollution could play a role in obesity through a complex interplay of mechanisms including lung inflammation, oxidative stress, and metabolic disorders which interact and reinforce each other, promoting obesity. Addressing this multifaceted issue requires collaboration between public health officials, policymakers, and the public at large to combat the epidemic of obesity that has become a prevalent pandemic and putting a significant burden on the world’s healthcare system and socioeconomic conditions.
Ethics approval
The data were recorded from publicly available literature and data-based sources and had no direct involvement of animals or humans; hence ethical approval is not required.
Informed consent
Not required.
Authors’ contribution
SAM, study concept, literature review, manuscript writing and editing, NB, ASM: literature review, data collection and analysis.
Acknowledgements
The authors extend their appreciation to the “Researchers Supporting Project (RSP-2024 R47), King Saud University, Riyadh, Saudi Arabia”.
Declaration of competing interest
The authors declare that they have no known competing financial interests or personal relationships that could have appeared to influence the work reported in this paper.
References
- A basic introduction to fixed-effect and random-effects models for meta-analysis. Res. Synth. Method. 2010;1:97-111.
- [Google Scholar]
- Ambient fine particulate matter air pollution and risk of weight gain and obesity in united states veterans: an observational cohort study. Environ. Health Perspect.. 2021;129(4):47003.
- [CrossRef] [Google Scholar]
- Long-term exposure to ambient PM2.5 increase obesity risk in Chinese adults: a cross-sectional study based on a nationwide survey in China. Sci. Total Environ.. 2021;778(145812)
- [CrossRef] [Google Scholar]
- Centres for Disease Control Prevention (CDCa). About adult BMI. Available at: https://www.cdc.gov/healthyweight/assessing/bmi/adult_bmi/index.html. Cited date July 2, 2023.
- Long-term exposure to ambient PM2.5, sunlight, and obesity: a nationwide study in China. Front. Endocrinol. (lausanne). 2022;12(790294)
- [Google Scholar]
- Ambient air pollution and overweight and obesity in school-aged children in Barcelona, Spain. Environ. Int.. 2019;125:58-64.
- [Google Scholar]
- The Mantel-Haenszel Procedure Revisited: Models and Generalizations. Speybroeck N, éditeur. PLoS ONE. 2013;8:e58327.
- [Google Scholar]
- Ambient air pollution exposure and obesity-related traits in Korean adults. Diabetes Metab. Syndr. Obes.. 2019;12:1365-1377.
- [Google Scholar]
- Association of decreases in PM2.5 levels due to the implementation of environmental protection policies with the incidence of obesity in adolescents: a prospective cohort study. Ecotoxicol. Environ. Saf.. 2022;247(114211)
- [Google Scholar]
- What is the role of particulate matter 2.5 (PM2.5) in excess weight? A cross-sectional study in young Spanish people aged 2–14 years. Environ. Res.. 2023;216(Pt 2):114561.
- [CrossRef] [Google Scholar]
- Exposure to outdoor and indoor air pollution and risk of overweight and obesity across different life periods: a review. Ecotoxicol. Environ. Saf.. 2022 Sep;1(242):113893
- [Google Scholar]
- Association between long-term exposure of ambient air pollutants and cardiometabolic diseases: a 2012 Korean Community Health Survey. Nutr. Metab. Cardiovasc. Dis.. 2019;29(2):144-151.
- [Google Scholar]
- Stierman, B., Afful, J., Carroll, M.D., Chen, T.C., Davy, O., Fink, S., Fryar, C.D., G Q, Hales, C.M., Hughes, J.P., Ostchega, Y., Storandt, R.J., Akinbami, L.J., 2021. National Center for Health Statistics (US). National Health and Nutrition Examination Survey 2017–March 2020 Prepandemic Data Files Development of Files and Prevalence Estimates for Selected Health Outcomes. National Health Statistics Reports, 2021; No. 158. https://stacks.cdc.gov/view/cdc/106273.
- Ambient air pollution exaggerates adipose inflammation and insulin resistance in a mouse model of diet-induced obesity. Circulation. 2009;119:538-546.
- [Google Scholar]
- The global obesity pandemic: shaped by global drivers and local environments. Lancet. 2011;378(9793):804-814.
- [Google Scholar]
- Exposure to PM2.5 and obesity prevalence in the greater Mexico City Area. Int. J. Environ. Res. Public Health. 2021;18(5):2301.
- [CrossRef] [Google Scholar]
- Editorial: Environmental factors implicated in obesity. Front. Nutr.. 2023;10:1171507.
- [CrossRef] [Google Scholar]
- Longitudinal associations of air pollution with body size and composition in midlife women: the study of women’s health across the nation. Diabetes Care. 2022;45(11):2577-2584.
- [CrossRef] [Google Scholar]
- World Health Organization (WHOa) Obesity and Overweight. Key facts. Available at: https://www.who.int/news-room/fact-sheets/detail/obesity-and-overweight. Cited date July 2, 2023.
- World Obesity. World Obesity Atlas, 2023. Available at: www.worldobesityday.org/assets/downloads/World_Obesity_Atlas_2023_Press_Release.pdf. Cited date July 2, 2023.
- Exposure to ultrafine particles and childhood obesity: a cross-sectional analysis of the Seven Northeast Cities (SNEC) Study in China. Sci. Total Environ.. 2022;846:157524
- [Google Scholar]
- Effect of early particulate air pollution exposure on obesity in mice: role of p47phox. Arterioscler. Thromb. Vasc. Biol.. 2010;30:2518-2527.
- [Google Scholar]
- Association of long-term exposure to ambient air pollutants with risk factors for cardiovascular disease in China. J. Am. Med. Assoc. Netw Open.. 2019;2(3):e190318.
- [Google Scholar]
- Air pollution as a cause of obesity: micro-level evidence from Chinese Cities. Int. J. Environ. Res. Public Health. 2019;16(21):4296.
- [CrossRef] [Google Scholar]
- Regional urbanicity levels modify the association between ambient air pollution and prevalence of obesity: a nationwide cross-sectional survey. Environ. Pollut.. 2023;320:121079
- [Google Scholar]
- Ambient air pollution and obesity in school-aged children and adolescents: a multicenter study in China. Sci. Total Environ.. 2021;771:144583
- [Google Scholar]
- Long-term exposure to ambient air pollution and metabolic syndrome in children and adolescents: a national cross-sectional study in China. Environ. Int.. 2021;148:106383
- [Google Scholar]
- Long-term exposure to ambient air pollution and obesity in school-aged children and adolescents in Jiangsu province of China. Environ. Res.. 2021;195:110804
- [Google Scholar]


