

Translate this page into:
Ecological risk assessment of heavy metals contamination in agricultural soil from Al Majma'ah, central Saudi Arabia
-
Received: ,
Accepted: ,
This article was originally published by Elsevier and was migrated to Scientific Scholar after the change of Publisher.
Peer review under responsibility of King Saud University.
Abstract
Soil acts as a tank for heavy metals through surface complexation, ion exchange and surface precipitation. The purpose of this study was to assess the contamination and ecological risk of heavy metals (HMs) in agricultural soil in the Al Majma'ah area of central Saudi Arabia. Soil samples from 34 farms were collected, and HMs were evaluated using inductively coupled plasma-atomic emission spectrometry (ICP-AES). Enrichment factor (EF), contamination factor (CF), pollution load index (PLI), and potential ecological risk index (RI) were applied. The average values of the HMs (dry weight, mg/kg) had the following order: Fe > Al > Mn > Zn > Ni > Cr > V > Cu > Pb > Co > As. Results of contamination indices revealed low contamination, low risk and no enrichment for all HMs, except some minor enrichment for Zn and Ni. The considerable positive correlations between all elemental pairings in the correlation matrix and the one extracted principal component suggested that HMs in Al Majmaah soil were formed from weathering of Jurassic to Quaternary sediments in the research area.
Keywords
Heavy metals
Risk assessment
Multivariate analysis
Agriculture soil
Saudi Arabia

1 Introduction
Agriculture soils receive metal pollutants through natural and human sources. Most natural sources belong to weathering and erosion of different parent rocks, and volcanic activities. Metal-based pesticides or herbicides, phosphate-based fertilizers, wastewater irrigation, spillage of petroleum distillates, livestock manure, river flooding that brings sewage and contaminated water to the land, and accidental spillage of toxic chemicals from vehicles during transport are the main human sources of heavy metals (HMs) in soils (El-Kady and Abdel-Wahhab, 2018; Azizullah et al., 2011; Ullah et al., 2020; Alzahrani et al., 2023). The excessive deposition of HMs in soil causes environmental degradation for living organisms and can be enriched through the food chain (Su et al., 2014; Alharbi and El-Sorogy, 2023). Many research studies have found that vegetables grown in urban and suburban areas absorb a higher amount of different chemical pollutants than those grown in rural areas (Christou et al., 2017). In the terrestrial ecosystem, soils are the most important sink for HM contaminants. (Nriagu and Pacyna, 1988; Li et al., 2013).
Cobalt (Co), copper (Cu), iron (Fe), manganese (Mn), molybdenum (Mo), nickel (Ni), and zinc (Zn) are key HMs that are required at low amounts in many biological activities. When these micronutrients or trace metals are present at ideal levels, they increase plant nutrition as well as normal development and yield. However, an excess of these micronutrients has a detrimental effect on plant growth by causing oxidative stress and suppressing enzyme activity, affecting cell structural and functional integrity (Arif et al., 2016; Ali et al., 2019a; Chahouri et al., 2023). The non-essential metals include lead (Pb), cadmium (Cd), mercury (Hg), arsenic (As), chromium (Cr), silver (Ag) and antimony (Sb). Although the biological roles of these elements in plant metabolism have yet to be determined, a number of investigations have shown that they are poisonous to both eukaryotic and prokaryotic organisms. Excess concentrations of these HMs in the environment can cause severe soil and water resource contamination, which is a major global environmental concern (Azizullah et al., 2011; Di Toppi and Gabbrielli, 1999, Nour et al., 2022).
Agriculture is one of the most significant activities because it is the primary source of food security. Al Majma'ah governorate has about 6,000 farms producing various crops (wheat, barley, corn), vegetables, and trees, the most important of which are date palm trees. In addition, Al Majma’ah governorate is characterized by animal production of sheep, goats, camels and poultry. Enrichment factor (EF), geo-accumulation index (I-geo), contamination factor (CF), and ecological risk index (RI) can all be used to assess HM contamination in soil (Cheng and Yap, 2015; Al-Kahtany et al., 2023). Furthermore, multivariate techniques such as hierarchical clustering analysis and principal component analysis can be used to identify probable HM sources (Al-Kahtany et al., 2015; El-Sorogy et al., 2016; Alhabri et al., 2023). The purpose of this study was to (i) quantify the levels of HM contamination content in agricultural soils in the Al Majma'ah governorate, (ii) compare HM levels in the research region to other soils and backgrounds, and (iii) assess the ecological concerns associated with HMs in Al Majma'ah's soil.
2 Material and methods
2.1 Study area and sampling
The Al Majma’ah city is located about 180 km northwest of Riyadh on the path of the Riyadh-Sudair Al-Qassim Highway. It is about 140 km away from Qassim, 300 km away from Hafar Al-Batin, and about 85 km away from the city of Shaqra. The study area has the geographic coordinates of 25°00′061 − 45°19′526 N and 26°03′375 − 45°20′116 E (Fig. 1). The research region is predominantly made up of marine carbonates and siliciclastics from the Oxfordian Hanifa Formation, the Kimmeridgian Jubaila and Arab formations, the Cenomanian Wasia Formation, and Quaternary gravel sheets and alluvial terraces (Powers et al., 1966; Powers, 1968; Gameil and El-Sorogy, 2015; El-Asmar et al., 2015; Youssef and El-Sorogy, 2015; El-Sorogy et al., 2016; Tawfik et al., 2016; Khalifa et al., 2021). Surface soil samples were taken at a depth of less than 10 cm with a hard-plastic hand trowel from 34 palm and citrus farms in the Al Majmaah district of central Saudi Arabia. From geological point of view, 10 samples were collected from Quaternary, 9 from Jubaila, 6 from Arab, 6 from Wasia, and 3 samples from Hanifa (Fig. 2). At each site, a representative sample was created by combining three subsamples, which were then sealed in plastic bags and stored in an ice box.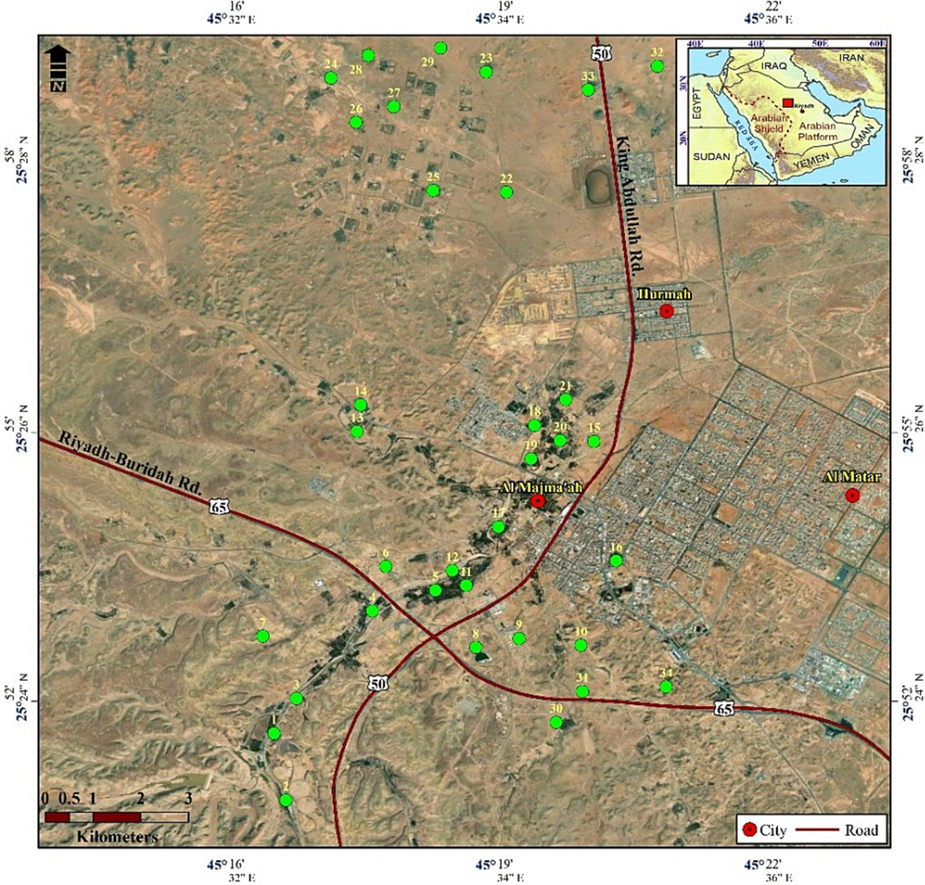
Location map of the study area and sampling sites.
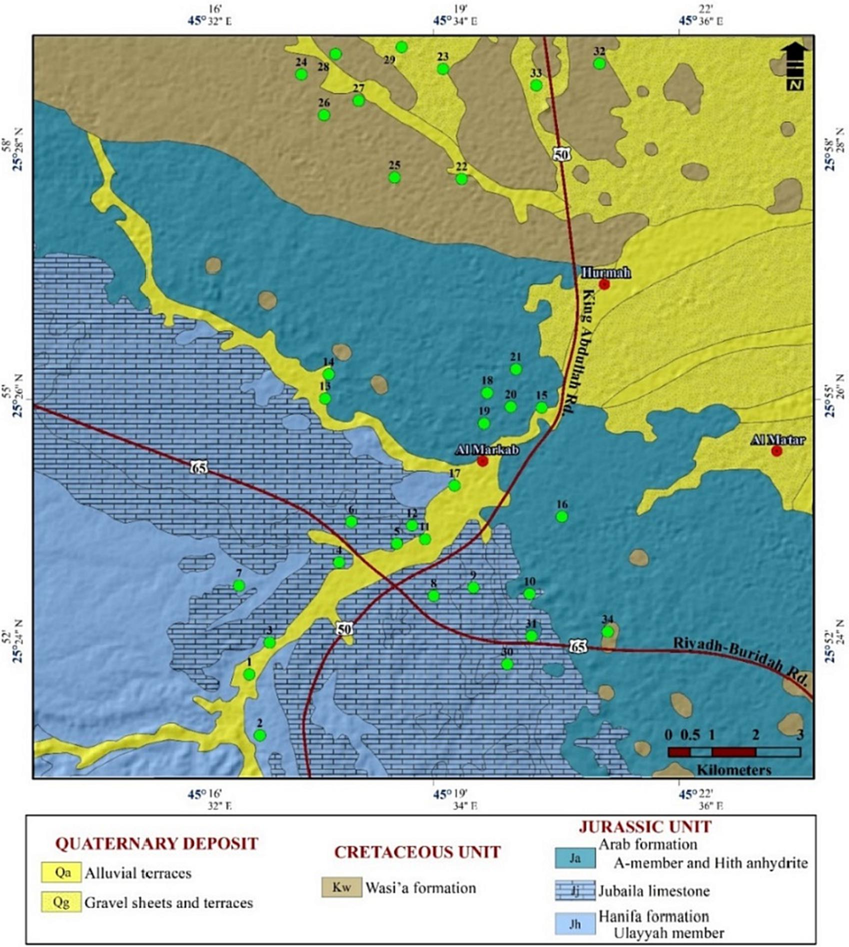
Sampling location and stratigraphic lithology of the study area (Modified after Vaslet et al., 1988).
2.2 Analytical methods
Soil samples were dried at air temperature, then cleaned from large rocks and organic particles. Physical breakdown with an agate mortar and pestle was used, followed by size separation with a nest of sieves (>500 m, 500–250 m, 250–125 m, 125–63 m, and 63 m). Fe, Al, As, Co, Mn, Ni, V, Zn, Cr, Pb, and Cu were studied using inductively coupled plasma-atomic emission spectrometry (ICP-AES) at the ALS Geochemistry Lab, Jeddah branch, Saudi Arabia. 0.50 g of the < 63 μm fraction was digested for 45 min on a hot plate with sand at temperatures ranging from 60 to 120 degrees Celsius. The selected HMs are sensitive for environmental and human health risks (Al-Kahtany et al., 2023; Alharbi et al., 2023). The limit of detection (LOD) of the ICP-AES technique was validated. The LOD value was the concentration that corresponded to three times the standard deviation of the measurements for the blank solutions divided by the slope of calibration curves for each element (Papadoyannis and Samanidou, 2004; Christodoulou and Samanidou, 2007). Several QA/QC (Quality Assurance/Quality Control) stages are conducted during the heavy metals analysis to verify the correctness and reliability of the results. Calibration of the instrument is one of these processes.The ALS Geochemistry Laboratory employed a standard analytical batch that includes a reagent blank for background assessment and certified reference material (CRM) to ensure data accuracy before release. EF, CF, RI, and PLI were used to assess the amounts of HMs contamination in soil samples (Hakanson, 1980; Birch, 2003; El-Sorogy et al., 2018). Using SPSS software, multivariate statistical approaches such as hierarchical clustering analysis (HCA), correlation matrix (CM), and principal component analysis (PCA) were used to identify likely sources of HMs in the examined soil. Table 1 categorizes the indices used herein and their classifications.

3 Results and discussion
3.1 Concentration and distribution of heavy metals
The average HM levels (dry weight, mg/kg) in the examined soil were as follows (Table 2): Fe (19108), Al (10550), Mn (2 7 0), Zn (41.25), Ni (31.11), Cr (30.47), V (29.83), Cu (13.92), Pb (6.47), Co (6.08), and As (4.07). Fig. 3 presents the distribution of HMs in the study area. In comparison with other HM values from other Saudi, background, and world soils (Table 3), our average Al, Fe, Ni, Mn, Cu, As, Pb, Cr, Co, and V were higher than those recorded from Al Majma’ah and Al-Ahsa soils, Saudi Arabia (Alarifi et al., 2022; Alharbi and El-Sorogy, 2023). Our Fe, Zn, Mn, Cu, As, V, Pb, and Cr readings, on the other hand, were lower than the Wadi Jazan and background values, as well as the global average (Al-Boghdady and Hassanein, 2019; Turekian and Wedepohl, 1961; Kabata-Pendias, 2011).
S.N.
Al
As
Co
Cr
Cu
Fe
Mn
Ni
Pb
V
Zn
PLI
RI
S 1
3900
2.00
1.00
12.00
4.00
8800
98
10.00
3.00
11.00
17.00
0.10
4.67
S 2
12,400
7.00
7.00
47.00
15.00
40,400
432
34.00
8.00
43.00
34.00
0.38
16.14
S 3
8800
4.00
5.00
28.00
10.00
14,000
192
30.00
5.00
29.00
26.00
0.23
10.29
S 4
12,000
4.00
7.00
40.00
16.00
33,300
409
33.00
6.00
33.00
42.00
0.34
12.93
S 5
4800
1.50
3.00
13.00
10.00
9600
165
14.00
3.00
10.00
52.00
0.15
5.90
S 6
4700
1.50
2.00
19.00
17.00
19,200
242
15.00
2.00
9.00
55.00
0.16
7.03
S 7
16,400
7.00
10.00
44.00
19.00
24,500
362
47.00
8.00
51.00
57.00
0.42
17.60
S 8
14,100
6.00
8.00
42.00
17.00
28,200
381
42.00
8.00
41.00
50.00
0.39
15.97
S 9
14,000
5.00
8.00
36.00
20.00
20,300
332
39.00
8.00
35.00
72.00
0.37
14.99
S 10
20,900
7.00
12.00
53.00
27.00
29,800
471
59.00
11.00
54.00
71.00
0.52
21.10
S 11
18,100
6.00
10.00
45.00
24.00
23,800
400
50.00
13.00
45.00
65.00
0.45
18.99
S 12
20,100
6.00
12.00
51.00
25.00
27,700
410
56.00
11.00
55.00
72.00
0.49
19.64
S 13
16,800
5.00
9.00
45.00
20.00
25,700
358
48.00
11.00
44.00
55.00
0.41
16.90
S 14
20,300
7.00
11.00
52.00
22.00
27,400
412
54.00
13.00
52.00
59.00
0.48
20.21
S 15
10,500
4.00
6.00
29.00
14.00
17,400
232
29.00
6.00
30.00
36.00
0.27
11.22
S 16
14,200
4.00
8.00
37.00
20.00
22,100
341
38.00
8.00
37.00
66.00
0.36
14.19
S 17
11,000
4.00
6.00
30.00
12.00
18,300
264
29.00
7.00
31.00
34.00
0.28
11.36
S 18
19,200
6.00
10.00
47.00
24.00
25,500
427
52.00
11.00
47.00
65.00
0.46
18.84
S 19
16,300
5.00
9.00
41.00
22.00
22,400
362
48.00
10.00
41.00
54.00
0.40
16.66
S 20
4500
4.00
4.00
17.00
6.00
15,500
192
14.00
4.00
18.00
16.00
0.17
7.67
S 21
10,300
5.00
6.00
31.00
13.00
20,800
289
29.00
7.00
29.00
37.00
0.29
12.38
S 22
6700
3.00
4.00
23.00
10.00
15,800
235
23.00
5.00
21.00
37.00
0.22
8.90
S 23
5500
3.00
4.00
18.00
8.00
11,600
167
18.00
4.00
18.00
23.00
0.17
7.43
S 24
7000
3.00
4.00
26.00
11.00
18,000
249
25.00
4.00
21.00
37.00
0.22
9.08
S 25
6500
4.00
4.00
21.00
9.00
12,200
186
23.00
4.00
25.00
43.00
0.21
9.20
S 26
6700
3.00
4.00
22.00
9.00
12,900
189
23.00
4.00
23.00
24.00
0.19
8.24
S 27
6800
3.00
5.00
21.00
9.00
12,400
198
23.00
4.00
21.00
26.00
0.20
8.24
S 28
7300
3.00
4.00
22.00
9.00
12,900
199
24.00
5.00
22.00
32.00
0.21
8.67
S 29
3500
2.00
2.00
12.00
4.00
7800
95
11.00
3.00
12.00
12.00
0.11
4.71
S 30
5200
2.00
3.00
18.00
7.00
12,100
169
17.00
4.00
16.00
22.00
0.16
6.41
S 31
6000
3.00
4.00
24.00
9.00
13,500
180
25.00
4.00
21.00
22.00
0.19
8.40
S 32
7200
3.00
5.00
22.00
11.00
12,400
191
24.00
5.00
22.00
35.00
0.21
8.92
S 33
5500
2.00
4.00
18.00
7.00
9900
143
18.00
4.00
19.00
26.00
0.16
6.51
S 34
8200
3.00
5.00
26.00
10.00
13,500
192
27.00
5.00
24.00
27.00
0.22
9.13
3500
1.50
1.00
12.00
4.00
7800
95
10.00
2.00
9.00
12.00
0.10
4.67
20,900
7.00
12.00
53.00
27.00
40,400
471
59.00
13.00
55.00
72.00
0.52
21.10
10,550
4.07
6.08
30.47
13.92
19,108
270
31.11
6.47
29.83
41.25
0.28
11.79
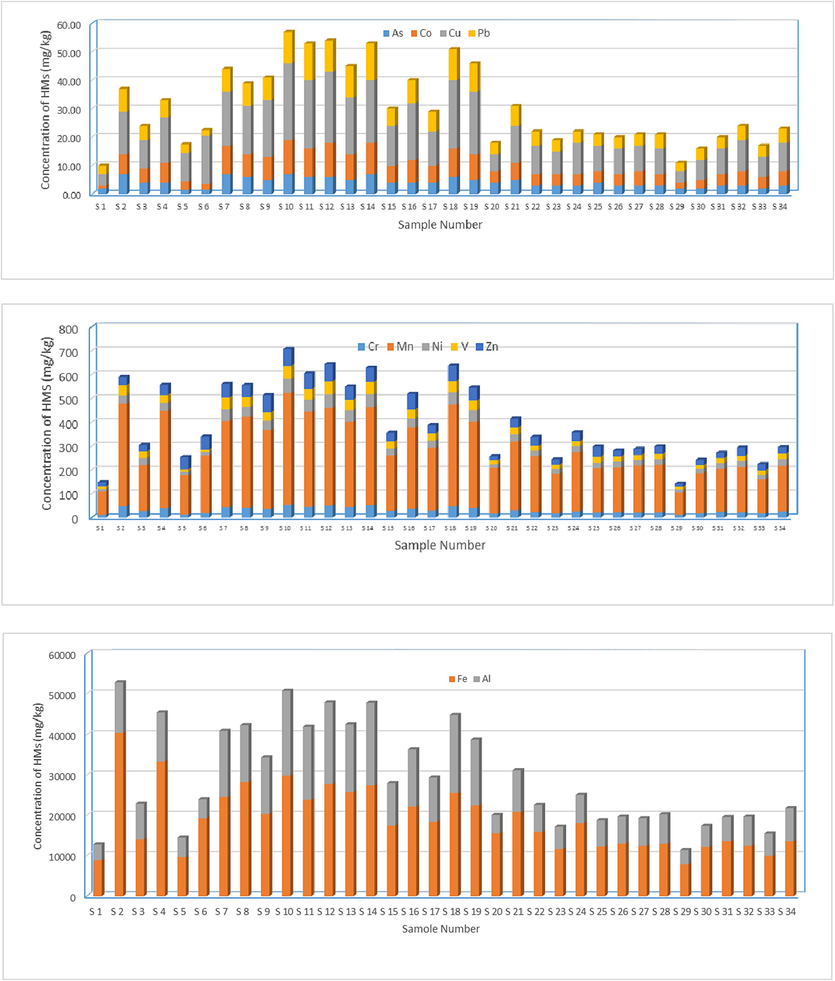
Distribution of the HMs in Al Majma’ah soil.

Q-mode HCA classified the 34 samples into two groups (Fig. 4). S2, S4, S7-S14, S16, S18, and S19 have the greatest concentrations of Al, As, Co, Cr, Cu, Fe, Mn, Ni, Pb, V, and Zn (20900, 7.00, 12.00, 53.00, 27.00, 40400, 471, 59.00, 13.00, 55.00, and 72.00 mg/kg, respectively). Samples of the firest cluster were located on Jubaila Formation, Quaternary deposits, Arab Formation, and Hanifa Formation (Fig. 2). The second group accounts S1, S3, S5, S6, S15, S17, and S20-S34, which reported the lowest values of the last mentioned HMs (3500, 1.50, 1.00, 12.00, 4.00, 7800, 95, 10.00, 2.00, 9.00, and 12.00 mg/kg, respectively). Samples of the second cluster were located mostly on Cretaceous Wasia Formation and the Quaternary deposits, while a few ones were located on Jubaila and Arab formations (Fig. 2).
Contamination and risk assessment
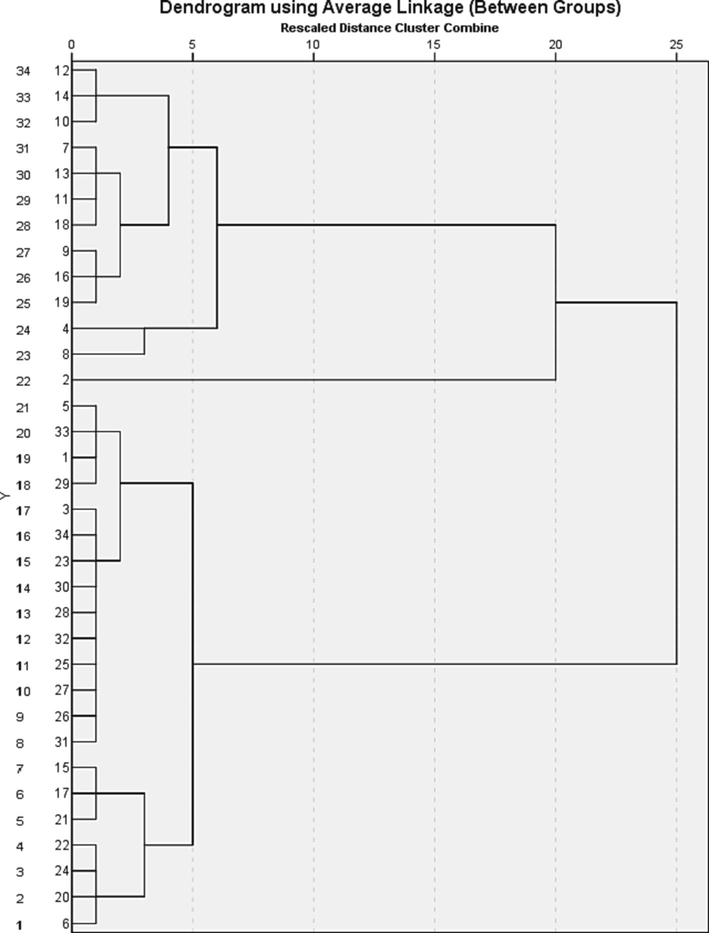
- Q-mode HCA of soil samples.
The enrichment factor is used to separate components provided by humans from those of geological origin (Reimann and de Caritat, 2005). Average values of EF herein indicated minor enrichment for Zn and Ni (Average EF = 1.15 and 1.14, respectively), while the remaining HMs showed no enrichment (EF < 1) (Table 4). However, some individual samples implying minor enrichment for Pb (S11, S13, S14, S18, and S19), Cr (S3, S14, and S34), Cu (S5, S9, S11, and S19), As (S3, S7, and S25), and Co (S7, S10, S11, S14, S19, S27, S32, and S33). Based on EF categories all HMs were of geogenic source in Al Majma’ah soil, except few anthropogenic factors which lead to minor enrichment in some samples (Duodu et al., 2016; Alharbi and El-Sorogy, 2023). Contamination factor indicated that all HMs in the investigated soil had a low contamination factor (average values of CF < 1). To assess HM contamination in a specific soil location, the pollutant load index (PLI) is utilized (Hossain et al., 2021). In the study area, PLI ranged from 0.10 to 0.52, with an average of 0.28 indicating unpolluted soil (Alzahrani et al., 2023). The risk index (RI) can be used to understand and control HM pollution at a specific site (Hossain et al., 2021). The RI results varied from 4.67 to 21.10, with an average of 11.79, indicating a minimal risk of HM presence in the current soil (Al-Hashim et al., 2021).
HMs
Indices
Min.
Max.
Aver.
Pb
EF
0.25
1.29
0.81
CF
0.10
0.65
0.32
Zn
EF
0.42
2.69
1.15
CF
0.13
0.76
0.43
Cr
EF
0.52
1.05
0.85
CF
0.13
0.59
0.34
Ni
EF
0.54
1.49
1.14
CF
0.15
0.87
0.46
Cu
EF
0.39
1.09
0.77
CF
0.09
0.60
0.31
Fe
CF
0.17
0.86
0.40
Al
EF
0.14
0.45
0.32
CF
0.04
0.26
0.13
As
EF
0.28
1.19
0.80
CF
0.12
0.54
0.31
Mn
EF
0.59
0.95
0.80
CF
0.11
0.55
0.33
Co
EF
0.26
1.08
0.79
CF
0.02
0.27
0.14
V
EF
0.17
0.76
0.57
CF
0.07
0.42
0.23
3.2 Statistical analysis
The correlation matrix (CM) presenting in Table 5 showed significant positive correlations between all elemental pairs, e.g. Zn-Al, Zn-As, Zn-Co, Zn-Cr, Zn-Cu, Zn-Fe, Zn-Mn, Zn-Ni, Zn-Pb, and Zn-V (r = 0.819, 0.625, 0.794, 0.757, 0.926, 0.618, 0.797, 0.803, 0.746, and 0.729), indicating similar source for these HMs. The contamination indices showed that there was no enrichment, low contamination, and low risk for HMs in Al Majma'ah soil additionally, the presence of Fe, Al, and Mn in such significant correlations with all investigated HMs indicated a natural source for these HMs, which was primarily derived from weathering of Jurassic to Quaternary sediments in the study area (El-Sorogy and Al-Kahtany, 2015; El-Sorogy et al., 2014, 2017; Farouk et al., 2018). Principal component analysis (PCA) extremely support the results of contamination indices and correlation analysis, where one PC accounting 89.13 of the total variance was extracted (Table 6). It showed high loading of Al, As, Co, Cr, Cu, Fe, Mn, Ni, Pb, V, and Zn (0.987, 0.918, 0.978, 0.988, 0.948, 0.856, 0.964, 0.979, 0.948, 0.975, and 0.828). HMs of the such PC might be derived from geogenic source (Reimann and de Caritat, 2000; Alharbi and El-Sorogy, 2021; Alarifi et al., 2022). **. Correlation is significant at the 0.01 level (2-tailed).
Al
As
Co
Cr
Cu
Fe
Mn
Ni
Pb
V
Zn
Al
1
As
0.888**
1
Co
0.984**
0.899**
1
Cr
0.969**
0.922**
0.957**
1
Cu
0.941**
0.776**
0.917**
0.910**
1
Fe
0.782**
0.824**
0.766**
0.894**
0.772**
1
Mn
0.921**
0.878**
0.907**
0.965**
0.920**
0.942**
1
Ni
0.988**
0.884**
0.981**
0.966**
0.930**
0.758**
0.906**
1
Pb
0.966**
0.868**
0.945**
0.928**
0.882**
0.729**
0.871**
0.949**
1
V
0.972**
0.945**
0.976**
0.975**
0.872**
0.809**
0.908**
0.973**
0.933**
1
Zn
0.819**
0.625**
0.794**
0.757**
0.926**
0.618**
0.797**
0.803**
0.746**
0.729**
1
PC1
Al
0.987
As
0.918
Co
0.978
Cr
0.988
Cu
0.948
Fe
0.856
Mn
0.964
Ni
0.979
Pb
0.948
V
0.975
Zn
0.828
% of Variance
89.13
Cumulative %
89.13
4 Conclusions
The current study used contamination indices to emphasize the HM contamination and associated ecological hazards in agricultural soil from Al Majma'ah, central Saudi Arabia. The contamination indices used in this investigation resulted in minimal contamination, low risk, and no enrichment for all HMs, with the exception of relatively slight enrichment for Zn and Ni. The single extracted PC and the significant positive correlations between all elemental pairings in the CM revealed a single, mostly natural source of HMs in Al Majmaah soil, generated from weathering of Jurassic to Quaternary strata.
Acknowledgments
The authors extend their appreciation to the Deputyship for Research & Innovation, Ministry of Education in Saudi Arabia for funding this research work through the project no (IFKSUOR3– 406-3). Also, the authors would like to thank the anonymous reviewers for their valuable suggestions and constructive comments.
Declaration of competing interest
The authors declare that they have no known competing financial interests or personal relationships that could have appeared to influence the work reported in this paper.
References
- Contamination and environmental risk assessment of potentially toxic elements in soils of palm farms in Northwest Riyadh, Saudi Arabia“. Sustainability. 2022;14(22):15402.
- [CrossRef] [Google Scholar]
- Chemical analysis and environmental impact of heavy metals in soil of wadi Jazan area, southwest of Saudi Arabia. Appl. Ecol. Environ. Res.. 2019;17:7067-7084.
- [Google Scholar]
- Contamination and health risk assessment of groundwater along the Red Sea coast, Northwest Saudi Arabia. Mar. Pollut. Bull.. 2023;192:115080
- [CrossRef] [Google Scholar]
- Spatial distribution and risk assessment of heavy metals pollution in soils of marine origin in central Saudi Arabia. Mar. Pollut. Bull.. 2021;170:112605
- [Google Scholar]
- Risk assessment of potentially toxic elements in agricultural soils of Al-Ahsa Oasis, Saudi Arabia. Sustainability. 2023;15:659.
- [CrossRef] [Google Scholar]
- Contamination and ecological risk of heavy metals in Al-Uqair coastal sediments, Saudi Arabia. Mar. Pollut. Bull.. 2021;171:112748
- [Google Scholar]
- Environmental chemistry and ecotoxicology of hazardous heavy metals environmental persistence, toxicity, and bioaccumulation. J. Chem.. 2019;2019:6730305.
- [CrossRef] [Google Scholar]
- Geochemical and foraminiferal analyses of the bottom sediments of Dammam coast, Arabian Gulf, Saudi Arabia. Arab. J. Geosci.. 2015;8:11121-11133.
- [Google Scholar]
- Ecological and health risk assessment of heavy metals contamination in mangrove sediments, Red Sea Coast. Mar. Pollut. Bull.. 2023;192:115000
- [CrossRef] [Google Scholar]
- Environmental assessment of heavy metals in soils around Al-Janabeen Dam, southwest Saudi Arabia. J. King Saud Univ. – Sci.. 2023;35:102503
- [CrossRef] [Google Scholar]
- Contamination and risk assessment of potentially toxic elements in coastal sediments of the area between Al-Jubail and Al-Khafji, Arabian Gulf, Saudi Arabia. Water. 2023;15:573.
- [CrossRef] [Google Scholar]
- Influence of high and low levels of plant-beneficial heavy metal ions on plant growth and development. Front. Environ. Sci.. 2016;4(69)
- [CrossRef] [Google Scholar]
- Water pollution in Pakistan and its impact on public health—a review. Environ. Int.. 2011;37(2):479-497.
- [Google Scholar]
- Birch, G., 2003. A scheme for assessing human impacts on coastal aquatic environments using sediments. In: Woodcoffe, C.D., Furness, R.A. (Eds.), Coastal GIS, vol. 14. Wollongong University papers in Center for Maritime Policy. Australia.
- Assessment of heavy metal contamination and ecological risk in Morocco's marine and estuarine ecosystems through a combined analysis of surface sediment and bioindicator species: Donax trunculus and Scrobicularia plana. Mar. Pollut. Bull.. 2023;192:115076
- [Google Scholar]
- Potential human health risks from toxic metals via mangrove snail consumption and their ecological risk assessments in the habitat sediment from Peninsular Malaysia. Chemosphere. 2015;135:156-165.
- [Google Scholar]
- Multiresidue HPLC analysis of ten quinolones in milk after solid phase extraction: Validation according to the European Union Decision 2002/657/EC. J. Sep. Sci.. 2007;30:2421-2429.
- [Google Scholar]
- Long-term wastewater irrigation of vegetables in real agricultural systems: Concentration of pharmaceuticals in soil, uptake and bioaccumulation in tomato fruits and human health risk assessment. Water Res.. 2017;109:24-34.
- [CrossRef] [Google Scholar]
- Comparison of pollution indices for the assessment of heavy metal in Brisbane River sediment. Environ. Pollut.. 2016;219:1077-1091.
- [Google Scholar]
- Facies analysis and depositional environments of the Upper Jurassic Jubaila Formation, Central Saudi Arabia. J. Afr. Earth Sc.. 2015;110:34-51.
- [Google Scholar]
- Occurrence of trace metals in foodstuffs and their health impact. Trends Food Sci. Technol.. 2018;75:36-45.
- [Google Scholar]
- Marine benthic invertebrates of the Upper Jurassic Tuwaiq Mountain Limestone, Khashm Al-Qaddiyah, Central Saudi Arabia. J. Afr. Earth Sc.. 2014;97:161-172.
- [Google Scholar]
- Contribution to the scleractinian corals of Hanifa Formation, Upper Jurassic, Jabal al-Abakkayn Central Saudi Arabia. Hist. Biol.. 2015;27(1):90-102.
- [Google Scholar]
- Depositional architecture and sequence stratigraphy of the Upper Jurassic Hanifa Formation, central Saudi Arabia. J. Afr. Earth Sc.. 2018;139:367-378.
- [Google Scholar]
- Microfacies and diagenesis of the reefal limestone, Callovian Tuwaiq Mountain Limestone Formation, central Saudi Arabia. J. Afr. Earth Sc.. 2016;115:63-70.
- [Google Scholar]
- Stratigraphy and macrofauna of the Lower Jurassic (Toarcian) Marrat Formation, central Saudi Arabia. J. Afr. Earth Sc.. 2017;134:476-492.
- [CrossRef] [Google Scholar]
- Integrated assessment of the Tarut Island coast, Arabian Gulf, Saudi Arabia. Environ. Earth Sci.. 2016;75:1336.
- [Google Scholar]
- High-frequency cycles and sequence stratigraphy of the lower Jurassic Marrat Formation, central Saudi Arabia. Mar. Pet. Geol.. 2018;98:369-383.
- [Google Scholar]
- Gastropods from the Campanian-Maastrichtian Aruma Formation, Central Saudi Arabia. J. Afr. Earth Sc.. 2015;103(2015):128-139.
- [Google Scholar]
- An ecological risk index for aquatic pollution control. A sediment logical approach. Water Res.. 1980;14:75-1001.
- [Google Scholar]
- Case study on metal contamination in water and sediment near a coal thermal power plant on the Eastern Coast of Bangladesh. Environments. 2021;8:108.
- [Google Scholar]
- Kabata-Pendias, A., 2011. Trace Elements of Soils and Plants, 4th ed.; CRC Press, Taylor & Francis Group, LLC.: Boca Raton, FL, USA, p. 505.
- Microfacies architecture and depositional history of the Upper Jurassic (kimmeridgian) Jubaila Formation in central Saudi Arabia. J. Afr. Earth Sc.. 2021;174:104076
- [Google Scholar]
- Heavy metal contamination of urban soil in an old industrial city (Shenyang) in Northeast China. Geoderma. 2013;192:50-58.
- [CrossRef] [Google Scholar]
- Assessment of heavy metal contamination and health risk in the coastal sediments of Suez Bay, Gulf of Suez, Egypt. J. Afr. Earth Sci.. 2022;195:104663
- [CrossRef] [Google Scholar]
- Quantitative assessment of worldwide contamination of air, water and soils by trace metals. Nature. 1988;333:134-139.
- [Google Scholar]
- Geology of the Arabian Peninsula, sedimentary geology of Saudi Arabia. U.S. Geol. Surv. Prof. Pap.. 1966;560:147.
- [Google Scholar]
- Intrinsic flaws of element enrichment factors (EFs) in environmental geochemistry. Environ. Sci. Tech.. 2000;34:5084-5091.
- [Google Scholar]
- A review on heavy metal contamination in the soil worldwide: Situation, impact and remediation techniques. Environ. Skeptics Crit.. 2014;3:24-38.
- [Google Scholar]
- Tawfik, M., Al-Dabbagh, M. E., El-Sorogy, A. S., 2016. Sequence stratigraphy of the late middle Jurassic open shelf platform of the Tuwaiq Mountain Limestone Formation, central Saudi Arabia. Proc. Geol. Assoc. Proceedings of the Geologists’ Association 127, 395–412.
- Distribution of the elements in some major units of the earth’s crust. Geol. Soc. Am.. 1961;72:175-192.
- [Google Scholar]
- Assessment of health and ecological risks of heavy metal contamination: a case study of agricultural soils in Thall, Dir-Kohistan. Environ. Monit. Assess.. 2020;192(12):1-19.
- [Google Scholar]
- Vaslet, D., Brosse, J.M., Breton, J.B., Manivit, J., Le Strat, P., Fourniguc, J., Shorbaji, H., 1988. Geologic Map of the Shaqra Quadrangle, sheet 25 H. Ministry for Mineral Resources, Kingdom of Saudi Arabia, 29 pp.
- Palaeoecology of Benthic Foraminifera in Coral Reefs Recorded in the Jurassic Tuwaiq Mountain Formation of the Khashm Al-Qaddiyah Area, Central Saudi Arabia. J. Earth Sci.. 2015;26(2):224-235.
- [Google Scholar]
Appendix A
Supplementary material
Supplementary data to this article can be found online at https://doi.org/10.1016/j.jksus.2023.102993.
Appendix A
Supplementary material
The following are the Supplementary data to this article:


