

Translate this page into:
Ecogenotoxicological studies for an early toxicity screening and monitoring in Epinephalus chlorostigma and Scamberomorus commerson
⁎Corresponding authors. mushahid@ksu.edu.sa (Shahid Mahboob)
-
Received: ,
Accepted: ,
This article was originally published by Elsevier and was migrated to Scientific Scholar after the change of Publisher.
Peer review under responsibility of King Saud University.
Abstract
The current research work was planned to investigate genotoxicity in fish to screen and monitor the aquatic ecosystem. Epinephalus chlorostigma (Hamour) was collected from the contaminated areas of “Tarut Island” (26.571°N 50.056°E) in the Arabian Gulf near Dammam, Saudi Arabia. DNA fragmentation was detected by Comet assay and Micronucleus assay. Heavy metals' water quality parameters and concentrations (Pb, Cr, Zn, Mn, Cu, Cd, Sn, and Hg) were extensively higher than the WHO permissible limits. They were more than enough to have adverse effects on fish health. The highest DNA fragmentation was observed in E. chlorostigma, indicating its most heightened sensitivity to pollution. E. chlorostigma showed comet head diameters 63.33 ± 2.2, 83.59 ± 3.38, and 66.28 ± 2.13px from S1-S3, respectively. E. chlorostigma erythrocytes showed comet tail lengths as 16.66 ± 1.65, 16.20 ± 1.63, and 19.07 ± 1.81px from S1-S3. DNA damage was found to be 19.14 ± 1.38, 16.38 ± 1.26, and 19.95 ± 1.33 % from S1-S3, respectively. The tail moment was observed as 6.46 ± 0.79, 4.72 ± 0.69, and 7.14 ± 1.08, while the olive moment was recorded as 5.31 ± 0.51, 5.14 ± 0.52, and 6.01 ± 0.49, respectively from S1-S3. The highest frequency for single micronucleus induction, double micronucleus induction, and nuclear abnormalities was observed in E. chlorostigma collected from the polluted site of the study area. This study proposes that this fish species and novel DNA damage assays could be the best tools for toxicity screening and monitoring water bodies.
Keywords
Fish
DNA damage
Biomarker
Water
Pollution

1 Introduction
The global human population is facing health issues due to the residual effects of synthetic chemicals. Coastal pollution caused by human activities is a worldwide issue despite international agreements such as the London Convention and the Law of the Sea Convention, which prohibit the release of toxic contaminants into the sea and establishes local regulations to prevent and control marine pollution. The efforts to conserve coastal and estuarine ecosystems have so far failed to restore former ecosystem structure and function, resulting in species extinction and depletion, habitat destruction, water quality degradation, and decline of these ecosystems (Lotze et al. 2006). Many scientists have performed good scientific studies regarding water pollution in the past few decades (Hussain et al. (2021). However, contamination of our ecosystems is still one of the most worrying issues (Bianchi et al., 2015). Fish is an important model organism in food to indicate the health of aquatic ecosystems. Fish can bioaccumulate toxic substances that ingest contaminated food and water directly through the gills and mouth. Various researchers used to fish as a model for a reliable evaluation of pollutants and their potential to cause genotoxicity (Cavas and Gozukara 2005). The comet and micronucleus tests are used to study the genotoxic effect of contaminants in aquatic animals (Žegura et al., 2009).
Water quality degradation is linked to eco-physiologically effects on aquatic organisms, including fish (Hued and Bistoni 2005). Aquatic organisms tend to counter the toxicity generated by xenobiotics (Udroiu 2006), applying general toxicity biomarker criteria to fish (Stegeman, 1992). Physiological and biochemical parameters have a broader role in indicating water quality and identifying sublethal impacts of water contamination. Heavy metals and polycyclic aromatic hydrocarbons could cause genotoxicity in aquatic animals, and microbial toxins have been reported by Igwilo et al. (2006) and Kaufman et al. (2011), and Smith (1996). Genotoxicants lead to single and double-strand breaks (Spencer et al. 1996) and act as pre-mutagenic lesions (Kaufman et al. 2011). Such alterations may provide a crucial indication of oxidative damage to the DNA. The present study was aimed to evaluate the genotoxic effect of heavy metals through comet assay and micronucleus assay in fish E. chlorostigma, collected from the Tarut island, the Arabian Gulf.
2 Materials and methods
2.1 Water sampling and analyses
Water samples were collected using a water sampler in water bottles from selected sites (S1-S3) of the fish harvest. All water samples were analyzed for selected water quality parameters and heavy metals. Five water samples of volume 1.5L each was collected from each site and analyzed by the protocol described by Boyd (1981). Concentrations of heavy metals were determined by metal kits (Spectroquant® Analysis System, Merck) and atomic absorption Spectrophotometer (2000 series, H-Tech. Corp. Tokyo, Japan).
2.2 Fish procurement and blood sampling
E. chlorostigma was collected from the highly contaminated area “Tarut Island” of the Arabian Gulf near Dammam, Saudi Arabia (Tarut Island 26.571°N 50.056°E). Five fish specimens were collected from the three pre-selected locations (S1, S2, and S3). Fish blood was collected from the caudal vein of each specimen with the help of a 5 cc disposable syringe. Although fresh blood was used for tests, the remaining blood was preserved in heparin-coated tubes for four days. The weight of collected fish specimens ranged from 950 to 1200 g each. Fishes upstream to this polluted area and non-polluted areas were considered a control.
2.3 Comet assay
Fresh blood was used for the comet assay. 40 μL of blood sample was diluted with phosphate buffer saline and stored in ice. This assay was performed on fish RBCs (Singh et al., 1988) with some adjustments in a protocol followed by Cavalcante et al. (2008). Erythrocytes were suspended in low melting agarose on clean microscopic slides and then immersed in lysing buffer for one hour at 4 °C. This step will help in the unwinding of DNA. Slides were subjected to electrophoresis in an electrophoresis buffer (20 min, 300 mA, ∼25 V) and then neutralized (washed thrice for 5 min in buffer). Ethidium bromide was used to stain slides. Slides were then examined under a fluorescent microscope. Genetic damage was measured in 250 random cells using Comet Score Freeware 1.6.1.13.
2.4 Micronucleus test
Blood smearing was performed on slides immediately after sampling. These slides were air-dried at room temperature, and slides were then fixed in cold Corney fixative for five minutes and left to dry at room temperature. Slides were then stained in aqueous 10 % Giemsa stain for 40 min. Micronuclei induction frequencies and RBC nuclear abnormalities were calculated under a binocular microscope at 600x magnification. Each fish was analyzed for a total of 35,000 erythrocytes. The frequencies of micronuclei induction were scored according to the protocol adopted by Carrasco et al. (1990) and Cavas and Gozukara (2005).
2.5 Statistical analysis
Standard error and analysis of variance (ANOVA) SPSS 9 software were used to work out means. DMR test was used to compare means, and P < 0.05 was considered significant. DNA fragmentation through Comet assay was analyzed by TriTek Comet Score™ Freeware 1.6.1.13 by Tritek Corporation.
3 Results
3.1 Water quality
The mean pH TDS, TSS, salinity, and conductivity values were observed gradually decreasing trends at S1, S2, and S3. The water samples collected from S1, S2, and S3 showed a decreasing trend in BOD, COD, sulfates, and phenol. This decreasing trend in the water quality parameters is probably due to dilution from water in the coming upstream areas. Almost all heavy metals showed a decreasing trend from S1, S2 and S3, probably due to sedimentation or dilution by water from upstream (Table 1). Means sharing a similar letter in a row or in a column are statistically non-significant (P > 0.05). BOD; Biochemical Oxygen demand, COD; Chemical Oxygen demand. S1-S3; Polluted experimental sites,
Sites
Water quality parameters (mgL-1)
Lead
Chromium
Zinc
Manganese
S1
2.043
±
0.014c
0.527
±
0.023d
0.344
±
0.003d
2.12
±
0.025c
S2
1.749
±
0.094ef
0.431
±
0.011f
0.339
±
0.002d
2.02
±
0.037d
S3
1.729
±
0.035f
0.357
±
0.013e
0.331
±
0.003d
1.86
±
0.040e
Copper
Cadmium
Tin
Mercury
S1
1.670
±
0.020d
0.183
±
0.005b
0.436
±
0.009c
1.079
±
0.044bc
S2
1.622
±
0.038d
0.182
±
0.001b
0.379
±
0.008d
1.067
±
0.016bc
S3
1.557
±
0.020e
0.180
±
0.003b
0.366
±
0.011d
0.912
±
0.020a
pH
Sulfates
Salinity
TDS
S1
10.39
±
0.103c
435.00
±
2.717 cd
1942.86
±
20.2f
2397.86
±
1.24 g
S2
10.30
±
0.022c
420.71
±
1.409d
1771.43
±
18.44 g
2269.0
±
11.3i
S3
10.06
±
0.087c
410.57
±
4.407e
1414.29
±
14.29 h
2071.14
±
0.26j
BOD
COD
Phenols
Conductivity mS/m
S1
78.56
±
1.22 h
195.43
±
1.48b
2.19
±
0.012d
3.17
±
0.061b
S2
67.47
±
1.9i
183.00
±
2.88d
1.91
±
0.014ef
3.08
±
0.041e
S3
55.43
±
1.04j
174.00
±
1.4e
1.80
±
0.018f
2.81
±
0.061f
3.2 Genotoxicity in fish
E. chlorostigma was used to study the genotoxic potential of pollution in the vicinity of this fish. E. chlorostigma showed comet head diameters 63.33 ± 2.2, 83.59 ± 3.38, and 66.28 ± 2.13px from S1-S3, respectively. Fish E. chlorostigma erythrocytes showed comet tail lengths of 16.66 ± 1.65, 16.20 ± 1.63, and 19.07 ± 1.81px from S1-S3, respectively (Fig. 1). DNA damage was found to be 19.14 ± 1.38, 16.38 ± 1.26, and 19.95 ± 1.33 % from S1-S3, respectively. The tail moment was found to be 6.46 ± 0.79, 4.72 ± 0.69, and 7.14 ± 1.08, while the olive moment was found to be 5.31 ± 0.51, 5.14 ± 0.52, and 6.01 ± 0.49, respectively from S1-S3. Overall comparison of E. chlorostigma from all locations and types indicated significant differences. In the case of % DNA in the tail at different sites, a highly significant difference (P < 0.01) was found except for site and species interaction, where it was found statistically non-significant (P > 0.05). These differences were also highly significant (P < 0.01) in species into a type of interaction. Sites, species, and type interactions also showed significant results (P < 0.01). The highest concentration of DNA in the fish's tail (42.21 ± 2.06 %) was harvested from the polluted area of Tarut Island at S1. It was gradually reduced to 31.26 ± 2.41 % at site S2 and 21.84 ± 2.21 % at site S3 (Table 2). It may be because the polluted water was diluted from the upstream area of Tarut Island. This significant dilution of wastewater was also found in water quality parameters, especially metal concentrations. E. chlorostigma collected from the polluted site showed a higher frequency for single micronucleus induction at 50.0 ± 6.3 ‰, double micronucleus induction at 14.4 ± 2.5 ‰, and nuclear abnormalities at 15.0 ± 2.9 %, respectively (Fig. 2). The fish harvested from the non-polluted site showed a single micronucleus induction, double micronucleus induction, and nuclear abnormalities of 4.2 ± 0.13 ‰, 0.6 ± 0.4 ‰, and 4.40 ± 1.2 %, respectively (Table 3). Head diameter was significantly correlated to BOD, COD, and phenolic polycyclic aromatic hydrocarbons. The tail moment was positively correlated to olive moment, while it showed a non-significant relation to TSS, BOD, COD Phenols, and SO4. DNA in the comet tail here, in this case, showed non-significant relations to all physicochemical parameters (Table 4). In the case of the correlation matrix for DNA damage and heavy metals, DNA in the comet tail showed non-significant relations to all heavy metals. Still, some metals significantly correlated to some of the comet assay parameters. Head diameter was significantly correlated to copper and showed tendencies to move towards significance for chromium. The tail moment was significantly correlated to the olive moment (Table 5). Means sharing similar letters in a row or a column are statistically non-significant (P > 0.05). Small letters represent comparison among interaction means, and capital letters are used for the overall mean. S1-S3 are Experimental polluted sites, Type; fish types, i.e., four categories of experimental fish species +ve; Positive control fish, F; (–ve control) fish, P; Polluted area fish, U; fish from upstream area. SMN: single micronucleus, DMN: double micronucleus, NA: Nuclear abnormalities, Means sharing similar letters in a row or in a column are statistically non-significant (P > 0.05). Upper values indicate Pearson's correlation coefficient; Lower values indicate a significance level at 5 % probability. Non-significant (P > 0.05); Significant (P < 0.05); Highly significant (P < 0.01), d-tail; % DNA in tail, H-dia; Head diameter, T-length; Tail length, T-mo; Tail moment, O-mo; Olive moment, TDS; Total Dissolved Solids, TSS; Total Suspended Solids, Sal; Salinity, Cond; Conductivity, BOD; Biochemical Oxygen Demand, COD; Chemical Oxygen Demand, Phen; Phenols. Upper values indicate Pearson’s correlation coefficient; Lower values indicate a significance level at 5 % probability. Non-significant (P > 0.05); Significant (P < 0.05); Highly significant (P < 0.01), D-tail; % DNA in tail, H-dia; Head diameter, T-leng; Tail length, T-mo; Tail moment, O-mo; Olive moment.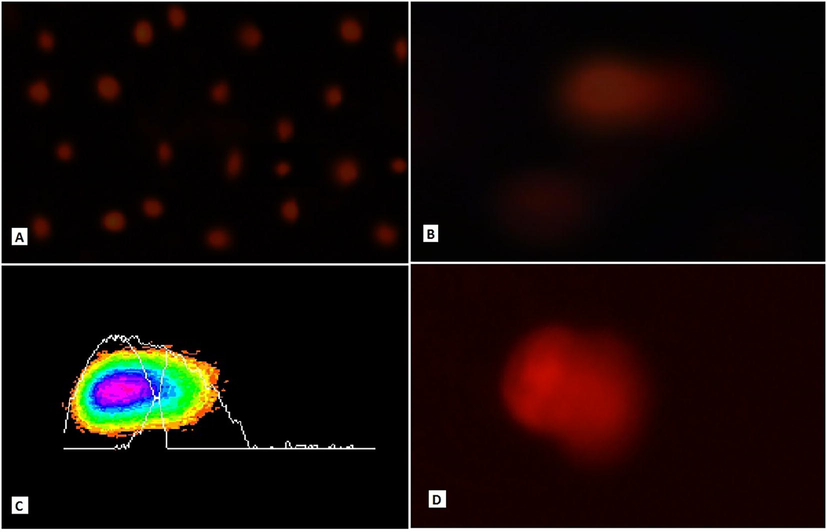
Comet Assay images of fish E. chlorostigma. Contol fish were showing normal erythrocytes (A) Fish erythrocytes indication DNA damage and comet tail formation 60x (B). Fish erythrocyte was analyzed through TriTek Comet Score Freeware 1.6.1.13, indicating significant DNA damage (C). Fish erythrocytes indicate migration of DNA from the core head region 100x (D).
Sites
Head diameter (px)
Tail length (px)
% DNA in Comet tail
Tail moment
Olive moment
Species and site interaction
S1
63.33 ± 2.20d
16.66 ± 1.65b
19.14 ± 1.38a
6.46 ± 0.79b
5.31 ± 0.51a
S2
83.59 ± 3.38bc
16.20 ± 1.63bc
16.38 ± 1.26b
4.72 ± 0.69c
5.14 ± 0.52a
S3
66.28 ± 2.13d
19.07 ± 1.81d
19.95 ± 1.33a
7.14 ± 1.08a
6.01 ± 0.49c
Mean
71.07 ± 1.56C
17.31 ± 0.98C
18.49 ± 0.77A
6.11 ± 0.50B
5.49 ± 0.29B
Species, site and type interaction
S1. + ve
59.96 ± 4.32k-n
16.70 ± 3.73h-n
16.58 ± 2.32d-h
5.64 ± 1.68d-h
4.34 ± 0.92e-h
S1. F
67.06 ± 1.61j-m
3.42 ± 0.99lmn
4.61 ± 1.15hij
0.54 ± 0.29h
1.02 ± 0.30gh
S1. P
88.10 ± 4.85f-j
39.92 ± 3.31b-f
42.21 ± 2.06a
17.71 ± 1.79abc
13.58 ± 1.06ab
S1. U
38.20 ± 2.86n
6.58 ± 1.26k-n
13.18 ± 1.96d-j
1.96 ± 0.59h
2.28 ± 0.38fgh
S2. + ve
122.32 ± 8.53b-e
14.08 ± 3.48i-n
13.31 ± 2.40d-j
2.54 ± 0.99gh
5.07 ± 1.13d-h
S2. F
63.10 ± 2.40j-n
1.46 ± 0.51n
4.77 ± 0.97hij
0.20 ± 0.11h
0.92 ± 0.21gh
S2. P
59.88 ± 3.81k-n
27.12 ± 3.16d-k
31.26 ± 2.41abc
10.30 ± 1.79b-h
8.10 ± 1.04b-f
S2. U
89.06 ± 6.46f-j
22.14 ± 3.62f-n
16.17 ± 2.45d-i
5.83 ± 1.54d-h
6.48 ± 1.18c-h
S3. + ve
69.80 ± 5.67j-m
13.22 ± 2.33i-n
18.05 ± 2.67def
5.32 ± 1.21d-h
5.47 ± 1.02d-h
S3. F
46.48 ± 0.85mn
1.68 ± 0.60n
4.46 ± 1.14hij
0.33 ± 0.13h
0.70 ± 0.19h
S3. P
77.06 ± 4.06g-l
28.44 ± 2.82d-j
21.84 ± 2.21bcd
7.81 ± 1.57c-h
5.88 ± 0.60c-h
S3. U
71.76 ± 3.61i-m
32.94 ± 5.17c-i
35.45 ± 2.36a
15.10 ± 3.57a-d
11.99 ± 1.06abc
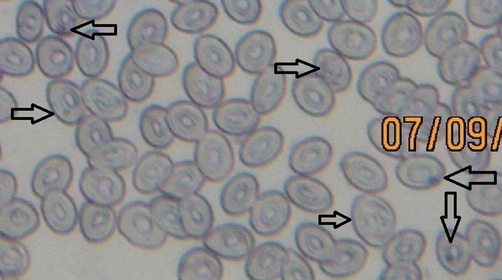
Micronucleus assay of fish (E. chlorostigma) blood harvested from polluted area indicating significant micronucleus induction.
Type
E. chlorostigma
SMN ‰
DMN ‰
NA%
Polluted (Mean from all sites)
50.00
±
6.30a
14.40
±
2.56a
15.00
±
2.92abc
Upstream
14.80
±
3.12 cd
2.80
±
1.02b
08.80
±
1.16a-d
Control
04.20
±
0.13 cd
0.60
±
0.40b
04.40
±
1.21d
+ve Control
52.60
±
5.22a
8.60
±
1.89ab
14.60
±
3.03abc
d-tail
H-dia.
T-leng.
T-mo.
O-mo.
pH
TDS
TSS
Sal.
Cond.
BOD
COD
Phen
H-dia.
−0.512
0.658
T-len.
0.904
−0.096
0.281
0.939
T-mo.
0.826
0.061
0.988
0.381
0.961
0.100
O-mo.
0.786
0.129
0.975
0.998*
0.424
0.918
0.144
0.043
pH
−0.689
0.975
−0.313
−0.161
−0.093
0.516
0.142
0.797
0.897
0.941
TDS
−0.668
0.981
−0.286
−0.132
−0.065
1.000*
0.535
0.123
0.0815
0.915
0.959
0.180
TSS
−0.141
0.923
0.295
0.441
0.501
0.815
0.831
0.910
0.252
0.8.9
0.709
0.666
0.393
0.375
Sal.
−0.681
0.978
−0.303
−0.150
−0.082
1.000**
1.000*
0.821
0.523
0.135
0.804
0.904
0.948
0.007
0.011
0.386
Cond.
−0.718
0.965
−0.352
−0.201
−0.134
0.999*
0.998*
0.790
0.999*
0.490
0.168
0.771
0.871
0.914
0.026
0.045
0.420
0.034
BOD
−0.548
0.999*
−0.138
0.018
0.087
0.984
0.989
0.906
0.986
0.976
0.631
0.027
0.912
0.988
0.945
0.114
0.096
0.279
0.107
0.141
COD
−0.490
1.000*
−0.071
0.086
0.154
0.970
0.976
0.932
0.972
0.958
0.998*
0.674
0.016
0.955
0.945
0.902
0.158
0.139
0.236
0.151
0.184
0.043
Phen
−0.449
0.997*
−0.025
0.132
0.199
0.957
0.965
0.948
0.960
0.944
0.994
0.999*
0.703
0.045
0.984
0.916
0.872
0.187
0.169
0.206
0.180
0.213
0.073
0.029
SO4
−0.220
0.951
0.217
0.368
0.430
0.859
0.873
0.997
0.864
0.837
0.937
0.958
0.970
0.859
0.201
0.861
0.760
0.717
0.342
0.324
0.057
0.335
0.369
0.228
0.185
0.155
D-tail
H-dia.
T-len.
T-mo.
O-mo.
Cd
Cu
Mn
Zn
Pb
Cr
Sn
Head diameter
−0.512
0.658
Tail length.
0.904
−0.096
0.281
0.939
Tail moment
0.826
0.061
0.988
0.381
0.961
0.100
Olive moment.
0.786
0.129
0.975
0.998*
0.424
0.918
0.144
0.043
Cadmium (Cd)
−0.594
0.995
−0193
−0.037
0.131
0.595
0.063
0.876
0.976
0.980
Copper (Cu)
−0.463
0.998*
−0.040
0.117
0.184
0.988
0.694
0.036
0.875
0.925
0.882
0.098
Manganese (Mn)
−0.728
0.962
−0.366
−0.215
−0.148
0.984
0.945
0.481
0.177
0.762
0.862
0.905
0.114
0.213
Zinc (Zn)
−0.133
0.920
0.303
0.448
0.508
0.876
0.940
0.776
0.915
0.257
0.804
0.704
0.611
0.320
0.221
0.434
Lead (Pb)
0.238
0.956
0.199
0.350
0.413
0.923
0.971
0.839
0.994
0.847
0.189
0.872
0.772
0.729
0.252
0.153
0.366
0.068
Chromium (Cr)
−0.416
0.994
0.012
0.168
0.235
0.979
0.999*
0.926
0.957
0.982
0.727
0.069
0.992
0.892
0.849
0.132
0.033
0.246
0.188
0.120
Tin (Sn)
−0.276
0.967
0.160
0.131
0.235
0.937
0.980
0.860
0.989
0.999*
0.989
0.822
0.164
0.898
0.797
0.754
0.226
0.128
0.341
0.093
0.025
0.095
Mercury (Hg)
−0.925
0.799
−0.675
−0.551
−0.493
0.854
0.764
0.933
0.498
0.588
0.429
0.620
0.247
0.411
0.528
0.628
0.672
0.348
0.446
0.234
0.668
0.600
0.480
0.574
4 Discussion
Water is a precious, valued resource, and the increasing pollution is a cause for alarm to save and make sustainable use of this minute amount of water because more than 97 % of all the water on this planet is salty or polluted, and a majority of the remaining 3 % proportion was frozen in icecaps. In this project, all physicochemical parameters showed higher values making this water unusable. Muhirwa et al. (2010), in their study, demonstrated that higher pH was due to effluents indicating the alkalinity of the water. The present findings substantiate the previous results that untreated discharge from various sources increased the alkalinity of the water sample collected from polluted sites of Tarut Island. With the flow of water, pH value decreases, and the same was observed in the present project results at sites RS1-RS3, and these findings are supported by the findings of Nhapi et al. (2011). The water samples collected from polluted area sites showed the TDS values significantly. Aza-Gnandji et al. (2013) and Prasanna and Ramesh (2013) also reported a higher concentration of dissolved solids than permissible limits in the Pazhayar River. Salinity and conductivity also showed a similar pattern of dilution. These findings agreed with Nkuranga (2007), who attributed the significant values of conductivity found in the Nyabugogo Swamp. These higher limits are in line with Nhapi et al. (2011). They also reported that the high BOD value when found might be due to the discharge of organic wastes into the water, ensuing in the uptake of oxygen for an oxidative breakdown of these wastes. They also reported that the high BOD and COD, higher amount of organic matter, and dissolved solids indicated the higher intensity of pollution entering the study area. These phenol findings corroborate with Sprynsky et al. (2007), who found higher concentrations of the phenols in surface waters. Such higher concentrations also confirm the findings of Zhong et al. (2013), who reported that higher values offer potential stress to an aquatic environment. Phenols in marine ecosystems are also related to industrial and municipal sewage generation and the production degradation of numerous pesticides. Both phenols and catechols were reported as harmful ecotoxins (Michałowicz & Duda, 2007; Pulkrabová et al., 2007; Havelková et al., 2008; Dû-Lacoste et al., 2012).
Staniskiene et al. (2006) found elevated levels of Cd in fish flesh (0.140 mg/kg) even from Elektrenai Pond, indicating the pollution and uptake of Cd from the healthy environment of the pond. Nriagu (1989) also found a higher concentration of Cd and reported exceeded level of biogenic inputs of such metals. Staniskiene et al. (2006) also indicated that a considerable amount of Cu in the fishes' flesh was due to environmental copper pollution (Kar et al., 2008). Staniskiene et al. (2006) reported the dispersion of Pb in fish bones and found the highest amount of Pb in the fishbone as 3.30 mg/kg only due to the lead polluted environment (Yousafzai et al., 2008; Pandey et al., 2010; Muiruri et al., 2013). Staniskiene et al. (2006) also reported the dissemination of Cr in the fish tissues inhabiting the Cr polluted environment (Pandey et al., 2010; Muiruri et al., 2013). Lomniczi et al. (2004) and Kosmehl et al., 2007 reported higher concentrations of Sn and Hg.
Fish procured from polluted environments showed a considerably higher number of micronuclei and chromosomal aberrations than fish from the non-polluted site here in this study, as shown by the fish from upstream areas and -ve control, corroborating the findings of Flammarion et al. (2002). Studies by Obiakor et al. (2010) also exposed dose and time response effects and relationships. Boettcher et al. (2010) account for large-scale mortalities due to water contamination. The present study also detected such fish kill due to waterways' contamination. Ramesh & Nagarajan (2013) revealed that industrial effluents cause DNA damage as determined by the comet tail length. The fish procured from a non-polluted site showed typical structures of the chromosomes, whereas registered alterations in the comet tail were reported in the individuals exposed to effluent. AL-Sharif (2012) studied cytogenetic aberrations in tilapia fishes caused by 4-nonylphenol. They exposed the fish to the said compound for one month with 0, 15, and 30 µg/L dilutions. They analyzed the samples of the liver and gills for DNA and RNA amount, micronucleus induction, and nuclear abnormalities in treated fish. The fish exposed to the above-said concentrations reported a significant increase in the micronucleus frequency. Results from the comet assay indicated severe DNA damage at polluted sites.
In contrast, the minor DNA damage at a low contaminated site and this damage were found to be related to the intensity of the pollution (Seriani et al., 2012; Pavlica et al., 2011). Bresler et al. (1999) reported that with rapid industrialization and heavy pollution, DNA unwinding and fragmentation act as an excellent biomarker of genotoxicity with a complete histopathological examination (Barbosa et al., 2010 Pavlica et al., 2011). The regular analysis of genotoxicity in such fish species using consistent and simple assays could be used as a biomarker for screening water bodies.
5 Conclusion
Water bodies are a sink for industrial and domestic sewage waste disposal pollutants. The present study indicated the sensitivity of E. chlorostigma, a commercially popular fish species in the Kingdom that could be used as bioindicators to detect the health of a particular ecosystem. The genotoxicity assay like comet and micronucleus tests could be effectively used as an early warning and to devise monitoring strategies for fish health. The higher concentration of selected heavy metals in the study area exhibited quantifiable DNA damage in the fish collected from Tarut Island. It is because of environmental stressors and their susceptibility to diseases, potentially reducing their capacity to respond to environmental change and, ultimately, their survival.
Acknowledgement
The authors express their sincere appreciation to the Researchers Supporting Project Number (RSP 2021/93) King Saud University, Riyadh, Saudi Arabia.
Declaration of Competing Interest
The authors declare that they have no known competing financial interests or personal relationships that could have appeared to influence the work reported in this paper.
References
- Genotoxicity of 4-Nonylphenol (4NP) on Oreochromus spilurs fish. American-Eurasian J. Toxicol. Sci.. 2012;4(1):41-47.
- [Google Scholar]
- Salinity of irrigation water in the Philippi farming area of the Cape Flats, Cape Town, South Africa. Water SA. 2013;39(2):199-210.
- [Google Scholar]
- Genotoxicity assessment in aquatic environment impacted by the presence of heavy metals. Ecotoxicol. Environ. Saf.. 2010;73(3):320-335.
- [Google Scholar]
- Evaluation of genotoxicity and cytotoxicity of water samples from the Sinos River Basin, southern Brazil. Brazilian J. Biol.. 2015;75(2 suppl.):S68-S74.
- [Google Scholar]
- Comparison of in vitro and in situ genotoxicity in the Danube River by means of the comet assay and the micronucleus test. Mutat. Res.. 2010;700(1–2):11-17.
- [Google Scholar]
- Water Quality in Warm Water Fish Ponds (2nd ed.). Opelika, Alabama: Craftmaster printers Inc.; 1981.
- Marine molluscs and fish as biomarkers of pollution stress in littoral regions of the Red Sea, Mediterranean Sea and North Sea. Helgol. Mar. Res.. 1999;53(3–4):219-243.
- [Google Scholar]
- Assessment of the piscine micronucleus test as an in situ biological indicator of chemical contaminant effects. Can. J. Fish. Aquat. Sci.. 1990;47(11):2123-2136.
- [Google Scholar]
- Genotoxic effects of Roundup® on the fish, Prochilodus lineatus. Mutation Res.. 2008;655(1–2):41-46.
- [Google Scholar]
- Micronucleus test in fish cells: a bioassay for in-situ monitoring of genotoxic pollution in the marine environment. Environ. Mol. Mutagenesis. 2005;46(01):64-70.
- [Google Scholar]
- Comparative study of different exposure routes on the biotransformation and genotoxicity of PAHs in the flatfish species, Scophthalmus maximus. Environ. Sci. Pollut. Res. Int.. 2012;20(2):690-707.
- [Google Scholar]
- Multibiomarker responses in fish from the Moselle River (France) Ecotoxicol. Environ. Saf.. 2002;51(2):145-153.
- [Google Scholar]
- Biochemical markers for the assessment of aquatic environment contamination. Interdisciplinary Toxicol.. 2008;1(2):169-181.
- [Google Scholar]
- Development and validation of a biotic index for evaluation of environmental quality in the central region of Argentina. Hydrobiologia. 2005;543:279-298.
- [CrossRef] [Google Scholar]
- A study on risk assessment of the effect of hematoxylin dye on cytotoxicity and nephrotoxicity in freshwater fish: Food and water security future research. Saudi J. Biol. Sci.. 2021;28(4):2267-2271.
- [Google Scholar]
- Toxicological study of the Anambra River in Otuocha, Anambra State, Nigeria. Arch. Environ. Occup. Health. 2006;61(5):205-208.
- [Google Scholar]
- Assessment of heavy metal pollution in surface water. Int. J. Environ. Sci. Technol.. 2008;5(1):119-124.
- [Google Scholar]
- Temporal and functional analysis of DNA replicated in early S phase. Adv. Enzyme Regul.. 2011;51(1):257-271.
- [Google Scholar]
- Differentiation between bioavailable and total hazard potential of sediment induced DNA fragmentation as measured by the Comet Assay with Zebra fish embryos. J. Soils Sediments. 2007;7(6):377-387.
- [Google Scholar]
- Mercury pollution of the Juramento River water system (Salta province, Argentina) J. Argentine Chem. Society. 2004;92(4/6):65-75.
- [Google Scholar]
- Depletion, degradation, and recovery potential of estuaries and coastal seas. Science. 2006;312(5781):1806-1809.
- [Google Scholar]
- Characterisation of wastewater from the Nyabugogo Abattoir, Rwanda and the impact on downstream water quality. Int. J. Ecol. Development Sum. 2010;16(S10):30-46.
- [Google Scholar]
- Heavy metals in water and tilapia fish from Athi-Galana-Sabaki tributaries, Kenya. Int. Food Res. J.. 2013;20(2):891-896.
- [Google Scholar]
- Assessment of water pollution levels in the Nyabugogo Catchment, Rwanda. Open Environ. Eng. J.. 2011;4:40-53.
- [Google Scholar]
- Nkuranga, E., 2007. Heavy metal removal and accumulation by an Urban Natural Wetland: The Nyabugogo Swamp, Rwanda, M.Sc Thesis, UNESCO-IHE Institute for water education, Delft, The Netherlands.
- A global assessment of natural sources of atmospheric trace metal. Nature (London). 1989;338:47-49.
- [Google Scholar]
- Aquatic genetic biomarkers of exposure and effect in Catfish (Clarias gariepinus, Burchell, 1822) American-Eurasian J. Toxicol. Sci.. 2010;2(4):196-202.
- [Google Scholar]
- Heavy metal contamination of Ganga River at Varanasi in relation to atmospheric deposition. Trop. Ecol.. 2010;51(2S):365-373.
- [Google Scholar]
- DNA integrity of chub erythrocytes (Squalius cephalus L.) as an indicator of pollution-related genotoxicity in the River Sava. Environ. Monit. Assess.. 2011;177(1–4):85-94.
- [Google Scholar]
- Analysis of water pollution in the Pazhayar River at Kanya Kumari district. Int. J. ChemTech Res.. 2013;5(3):1267-2180.
- [Google Scholar]
- Fish as biomonitors of polybrominated diphenyl ethers and hexabromocyclododecane in Czech aquatic ecosystems: Pollution of the Elbe River Basin. Environ. Health Perspect.. 2007;115(S-1):28-34.
- [Google Scholar]
- Evaluation of DNA damage of the fish clarias batrachus exposed to Sago effluent using the comet assay. Eur. Int. J. Sci. Technol.. 2013;2(3):12-16.
- [Google Scholar]
- Water toxicity and cyto-genotoxicity biomarkers in the fish Oreochromis niloticus (Cichlidae) J. Brazilian Soc. Ecotoxicol.. 2012;7(2):67-72.
- [Google Scholar]
- A simple technique for quantification of low levels of DNA damage in individual cells. Exp. and Cell. Res.. 1988;175(01):184-191.
- [Google Scholar]
- The mechanism of benzene-induced leuke- mia: a hypothesis and speculations on the causes of leukemia. Environ. Health Perspect.. 1996;104(Suppl 6):1219-1225.
- [Google Scholar]
- Oxidative DNA damage in human respiratory tract epithelial cells. Time course in relation to DNA strand breakage. Biochem. Biophys. Res. Commun.. 1996;224(1):17-22.
- [Google Scholar]
- Distribution of heavy metals in tissues of freshwater fish in Lithuania. Polish Journal of Environmental Study. 2006;15(4):585-591.
- [Google Scholar]
- Nomenclature for hydrocarbon-induced cytochrome P450 in fish. Mar. Environ. Res.. 1992;34(1–4):133-138.
- [Google Scholar]
- The micronucleus test in piscine erythrocytes. Aquat. Toxicol.. 2006;79(2):201-204.
- [CrossRef] [Google Scholar]
- Heavy metal pollution in River Kabul affecting the inhabitant fish population. Pakistan J. Zool.. 2008;40(5):331-339.
- [Google Scholar]
- Combination of in vitro bioassays for the determination of cytotoxic and genotoxic potential of wastewater, surface water and drinking water samples. Chemosphere. 2009;75(11):1453-1460.
- [Google Scholar]
- Zhong, W., Wang, D., Wang, Z. (2013). Screening level risk assessment for phenols in surface water of three rivers in Tianjin, China. National Basic Research Program (973) of China (No.2007CB407301); National Natural Science Foundation of China (No.20977102); Important National Science & Technology Specific Projects (2008ZX07314-003-3). Retrieved October 20, 2013, from http://aisberg.unibg.it/bitstream/10446/25390/1/123.pdf.


