

Earthquake catalog improvements and their seismic hazard impacts for the Arabian Peninsula
⁎Corresponding author. khassanein@ksu.edu.sa (Kamal Abdelrahman)
-
Received: ,
Accepted: ,
This article was originally published by Elsevier and was migrated to Scientific Scholar after the change of Publisher.
Peer review under responsibility of King Saud University.
Abstract
The Reviewed Event Bulletin (REB) issued through the International Data Centre (IDC) using the International Monitoring System (IMS) network of the Preparatory Commission for the Comprehensive Nuclear-Test-Ban Treaty Organization (CTBTO) is a seismo-acoustic bulletin distributed to the Member States of the CTBTO for the purpose of verifying the Treaty. The REB is partially available within a few days on the public site of the International Seismological Center (ISC), where the REB events are labeled ‘IDC’. This study focuses on the seismicity of the Arabian Peninsula and its adjacent regions, but the conclusions would be similar for regions that include good quality seismic stations of the IMS auxiliary seismic network, which has no weight in the current Event Definition Criteria (EDC). It is indicated that the consideration of the confidence ellipse factors (semi-major a-axis, semi-minor b-axis, and the epicentral area (A) as alternative EDC would significantly improve the completeness of the REB for the Arabian Peninsula, which consequently enhance the quality of the ISC bulletin.
The Arabian Peninsula has been chosen as a study region not only because it is surrounded by the IMS auxiliary seismic stations but also due to its increasing population, rapid urbanization, and strong economic growth in recent years. It has attracted many mega-projects (e.g., Multinational NEUM in Saudi Arabia, Expo 2020 in Dubai, the Special Economic Zone at Duqm in Oman, and the World Cup 2022 in Qatar). The earthquake hazards impact for the big cities in Saudi Arabia, such as Dammam in the east, and Jeddah, Tabuk, and Jizan in the west and the nearby cities are reviewed. The completeness catalog of the revised earthquakes may serve to improve the calculation of earthquake hazards threatening big cities in and around Saudi Arabia.
Keywords
Arabian Peninsula
CTBTO
IMS
REB
EDC
Earthquake hazard

1 Introduction
The International Monitoring System (IMS), a globally distributed network that consists of 337 monitoring facilities (321 monitoring stations and 16 radionuclide laboratories), is established to monitor the entire globe using four technologies; seismic, hydroacoustic, infrasound, and radionuclides (Bondár and North, 1999). The seismic component of the IMS network is the most effective method for monitoring compliance since it can detect underground, and contribute to underwater, and atmospheric tests. It uses 50 primary and 120 auxiliary stations. Continuous and on-time waveform data are transmitted from Primary stations, while waveform segments are retrieved on request from Auxiliary stations. The Late Event Bulletin (LEB) of the IDC from 1/1/2009 to 31/12/2014, which represents the available and complete data set that meets the objectives of this study, discloses about 166 events daily. This number is reduced approximately by 40% through the processing stream. A subset of the reviewed, added, and confirmed events consist of a sufficient number of stations and measured features to meet an Event Definition Criteria (EDC) are forming the Reviewed Event Bulletin (REB), one of the main products of the IDC.
Earthquake activity in the Arabian Peninsula is mostly confined to plate boundaries, where relative motion between the Arabian Plate and its surroundings takes place. The seismicity in the Arabian Peninsula is dominated by shallow-depth earthquakes at <30 km. Throughout this study, the seismicity of the Arabian Peninsula region is studied using four IMS auxiliary seismic stations; EIL (AS48- Israel), MMAI (AS49 – Israel), ASF (AS56 – Jordan), and WSAR (AS74 – Oman), which surround the Arabian Peninsula, to improve the current EDC and allow for more events to be accepted with high precision into the REB. The study area is defined by latitudes 12°–36°N and longitudes 34°–60°E. Major active tectonic features are forming the continental Arabian Plate boundaries. These tectonic features include the Zagros Fold Belt to the north, Makran subduction zone to the northeast, the Red Sea rift to the northwest, the Dead Sea rift to the west, the Gulf of Aden to the south, and Owen Fracture Zone to the southeast (Frizon and Leturmy, 2014).
Data from the IMS stations (Fig. 1) are transmitted to the IDC through satellite-based communications infrastructure and the Global Communications Infrastructure (GCI). Since 1999, the IDC started its routine automatic and interactive processing of seismic data (Ali and Shanker, 2017). Seismic events are saved in the REB based on the EDC. Standard methods to estimate the event location threshold of the IMS seismic network require signals from three primary stations and a total weight of 4.6 (Table 1), adding up all weights for attributes (time, azimuth, and slowness) used in computing the location for each contributing phase (Spiliopoulos and Pearce, 2011). The weights vary from zero (especially for Azimuths and Slownesses) to one (only for the time attribute of P-type primary array or three components seismic phase). However, the weights are zero for all attributes of phases detected at auxiliary stations. Although this approach may not fully address false events, it does address directly location quality. By applying the current EDC, the detected events are systematically included in the REB after analyst review.
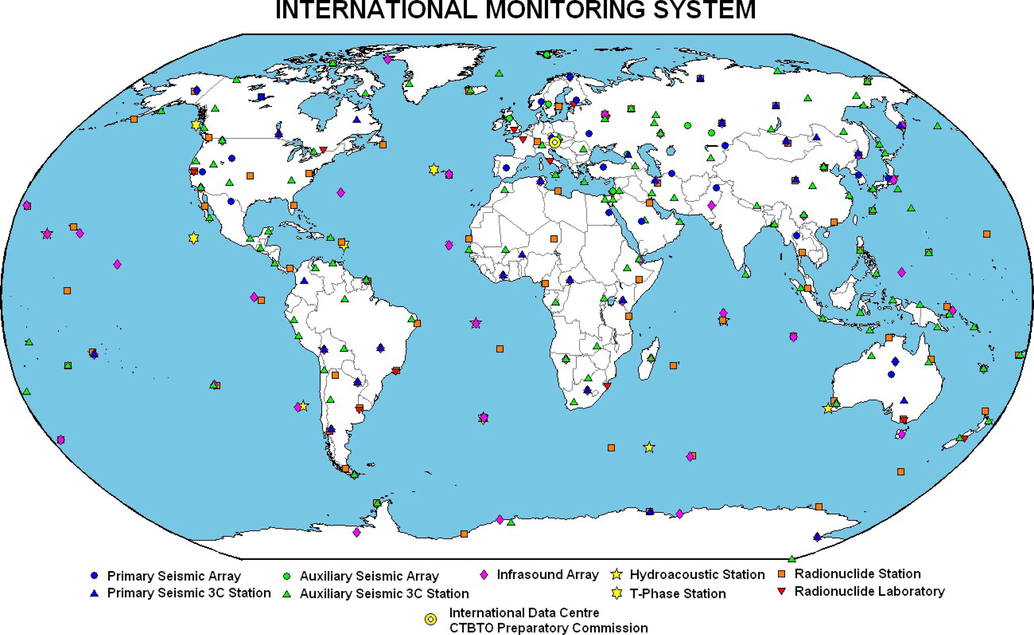
- The geographic distribution of the CTBTO International Monitoring System (IMS) Network (https://www.ctbto.org).
| Phase Type | Station Type | Time (sec) | Azimuth (degree) | Slowness |
|---|---|---|---|---|
| P-type primary | Seismic array | 1.00 | 0.40 | 0.40 |
| P-type secondary | Seismic array | 0.40 | 0.00 | 0.00 |
| S-type regional | Seismic array | 0.70 | 0.40 | 0.40 |
| S-type teleseismic | Seismic array | 0.70 | 0.00 | 0.00 |
| P-type primary | Seismic 3-C | 1.00 | 0.20 | 0.20 |
| P-type secondary | Seismic 3-C | 0.40 | 0.00 | 0.00 |
| S-type regional | Seismic 3-C | 0.70 | 0.00 | 0.00 |
| S-type teleseismic | Seismic 3-C | 0.70 | 0.00 | 0.00 |
Where, 3-C = 3 components.
The IDC of the CTBTO relies on automatic detection firstly to locate events from waveform data but in this study, an IDC dataset is analyzed to compare the automatically generated events with the scanned events. The data used for the detection of the scanned event comprises the number of stations and events at the station. This study could help identify the seismic events missed by automatic processing.
2 Data Collection, Processing, and analysis
The Preparatory Commission for the Comprehensive Nuclear-Test-Ban Treaty (CTBTO) was established in Vienna, Austria, in 1996 to achieve among other objectives the international verification of the CTBT Treaty (CTBT, 1996), including the establishment and completion of the IMS that will, when complete, consist of 337 facilities worldwide to monitor the planet for signs of nuclear explosions. More than 300 facilities – around 90% of the total – are already up and running. Two seismic networks have been used for global monitoring: a 50 stations primary network and a 120 stations auxiliary network. The raw data from the IMS stations are sent to the IDC (Spiliopoulos and Pearce, 2011).
According to the geographical regionalization of the International Data Center catalog, which is based on Flinn and Engdahl (1965) seismic and geographical regionalization scheme, the study region has been subdivided into 12 seismic regions; Arabian Sea, Eastern Arabian Peninsula, Eastern Gulf of Aden, Iraq, Persian Gulf, Red Sea, Socotra, Western Arabian Peninsula, Western Gulf of Aden, Western Iran, Dead Sea and Jordan-Syria region (Fig. 2a). Six years’ earthquake data from Jan. 2009 to Dec. 2014 have been collected with body-wave magnitudes (Mb) between 3.2 and 5.3 within a region bounded by (12°–36°N and 34°–60°E) (Fig. 2b). A total of 1657 Late Event Bulletin (LEB) events have been compiled, from which 1356 events were REB events, and 995 events were automatically built by the automatic system, then were reviewed and saved by analysts (Fig. 3a and Table 2). The large numbers of small seismic events recorded in the Dead Sea, Jordan-Syria, and Western Arabian Peninsula regions were not detected by distant primary stations. As a result, they were recorded only by IMS stations surrounding the Arabian Peninsula. These stations are not primary and data from them cannot participate at the first stage of automatic processing. Moreover, events recorded only by the auxiliary stations even after the analyst’s review cannot contribute to the final reviewed event bulletins because they do not meet the REB EDC.
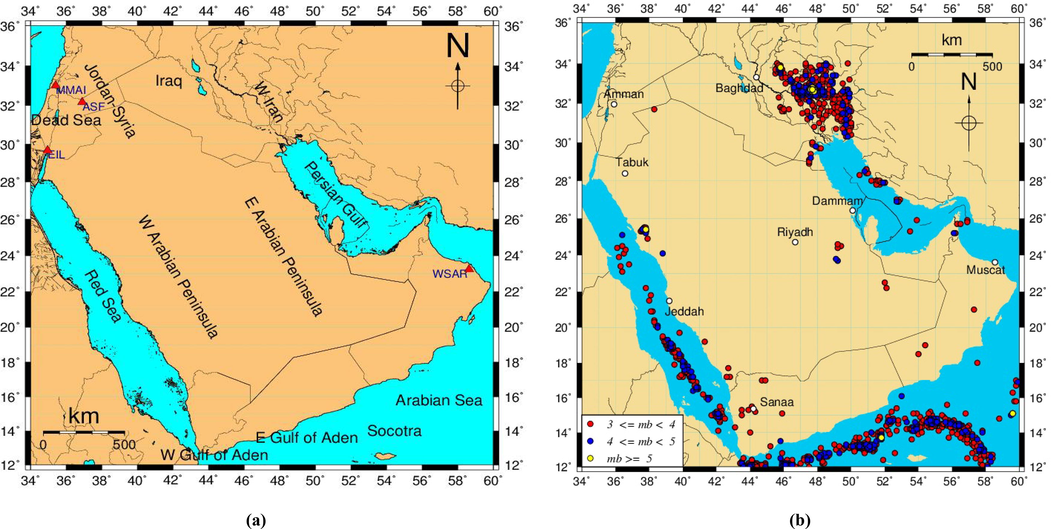
- a) Map is showing the location of the twelve regions and geographic distribution of the four IMS Auxiliary seismic stations located at the Arabian Peninsula (Red triangles). 2b) seismicity of the Arabian Plate. Generic Mapping Tools (GMT) developed by Wessel and Smith (1998) was used for data mapping.
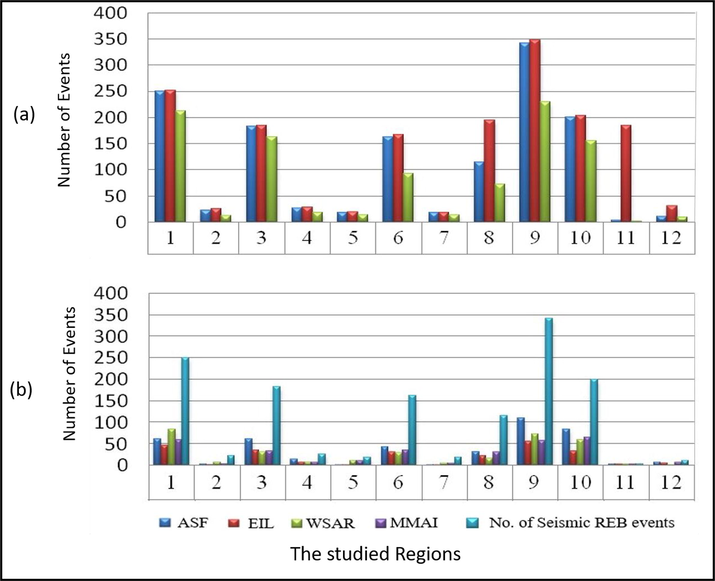
- a) A comparative graph is showing the total number of seismic REB events (blue), the total number of seismic events saved by the IDC analysts (red) and the number of automatic seismic REB events (green). 3b) Contribution of the four seismic stations located at the Arabian Peninsula.
| No. | Region | No. of seismic REB Events | Total no. of saved Events | No. of Automatically generated REB Events | ASF | EIL | WSAR | MMAI |
|---|---|---|---|---|---|---|---|---|
| 1 | Arabian Sea | 250 | 252 | 212 | 62 | 46 | 84 | 59 |
| 2 | E Arabian Peninsula | 23 | 26 | 13 | 3 | 2 | 7 | 4 |
| 3 | E Gulf of Aden | 183 | 184 | 163 | 61 | 35 | 31 | 34 |
| 4 | Iraq | 27 | 29 | 19 | 15 | 7 | 7 | 8 |
| 5 | Persian Gulf | 19 | 20 | 14 | 1 | 1 | 11 | 11 |
| 6 | Red Sea | 163 | 167 | 92 | 43 | 31 | 29 | 35 |
| 7 | Socotra | 19 | 19 | 14 | 1 | 1 | 5 | 5 |
| 8 | W Arabian Peninsula | 115 | 194 | 72 | 32 | 23 | 17 | 31 |
| 9 | W Gulf of Aden | 342 | 348 | 230 | 110 | 56 | 73 | 57 |
| 10 | W Iran | 200 | 203 | 155 | 84 | 33 | 59 | 65 |
| 11 | Dead Sea | 4 | 184 | 2 | 3 | 3 | 3 | 3 |
| 12 | Jordan-Syria | 11 | 31 | 9 | 8 | 6 | 1 | 8 |
Fig. 3b shows the relative ranking of the station contributions in the REB. The four auxiliary seismic stations surrounding the Arabian Peninsula have contributed to the REB with 1314P-type (e.g., Pn, Pg, P) phase detections; 423 phases at ASF, 244 phases at EIL, 327 phases at WSAR, and 320 phases recorded at MMAI (Table 2). The three components station ASF shows the maximal contribution to the REB. It participates in 55% of Western Iran events, 33% of the Eastern Gulf of Aden events, and 27.8% of the Western Arabian Peninsula events.
The data received at the IDC pass through stages of automatic data processing before being compiled into Standard Event Lists (SELs) (Coyne et al., 2012). Data at primary seismic stations are firstly recorded and together with the data at hydroacoustic stations, produce the SEL1 events, which are available one hour after the time at which the event occurred. Additional data segments from auxiliary seismic stations are then added, after being requested based on SEL1 events. At this stage, the infrasound data is included, and the SEL2 emerges, about four hours after the event time. Later arriving signals and more information are then combined with the SEL2 to create the final automatic bulletin issued at the IDC (SEL3) before the human interactive analysis starts. The waveform data analysts, therefore, review the SEL3 bulletin in a timely manner. They add signals, which not associated with the real events, and/or re-associate the miss-associated signals to their related events using the station’s azimuths and slowness, correct and improve the location parameters, discard events that are not real, resolve the mixed and split events, and scan the data for events which may have been missed entirely. The outputs are then reviewed by the IDC lead analysts to maintain the high quality of the IDC products. The processing steps and the products are shown in Fig. 4.
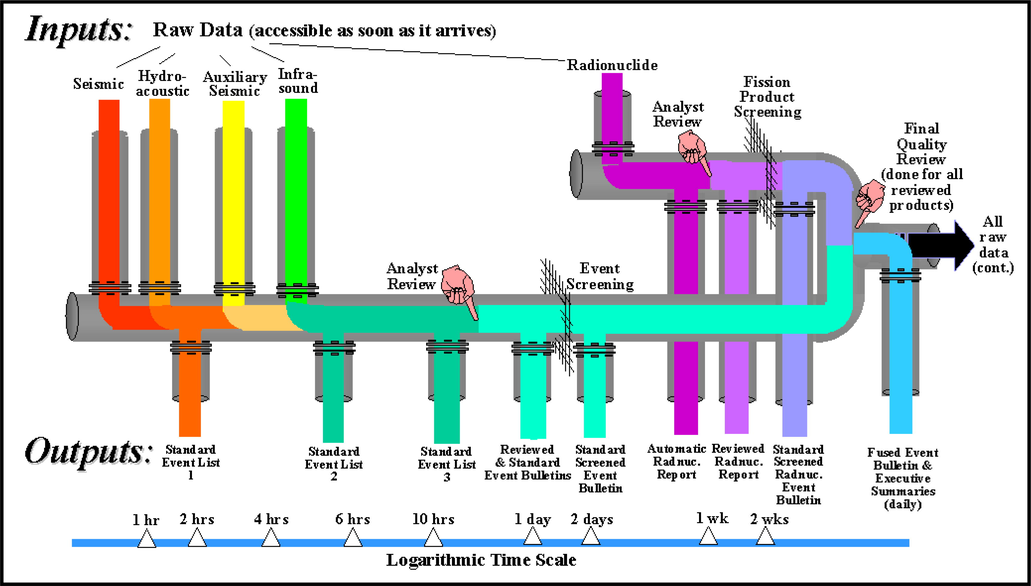
- The IDC processing pipeline with the IMS data flowing into the IDC at the top of the figure and the IDC products flowing out of the IDC at the bottom (https://www.ctbto.org).
All events that achieve the EDC, which are proposed to minimize bogus earthquakes and reserve the best-located real ones, are confirmed and saved by analysts then placed in the Reviewed Event Bulletin (REB). The REB is the outcome of the IDC that includes the event lists with origin parameters (times, depths, coordinates, magnitudes, and the pertinent uncertainties) and other features as well. The events which do not satisfy the REB EDC are discarded or saved internally in the Late Event Bulletin (LEB) but omitted from the REB.
The automatic processing includes station-based processing followed by network processing. The processing sequence for appropriate signals detection at each station includes the phases detection and their parameters, however, the network saves events of multi-station fit the same origin time and source location (Bobrov et al., 2011). The Global Association (GA) (e.g. Le Bras et al., 1999; Hanson et al., 2001) and the Network Processing Vertically Integrated Seismic Analysis (NET-VISA) (Le Bras et al., 2011, 2020); Li et al., 2021) applications perform the tasks of network processing. GA has been in use at the IDC since 1999 and is an exhaustive grid-based method where knowledge is accumulated for each grid cell. The Network Processing Vertically Integrated Seismic Analysis (NET-VISA) is a machine learning, Bayesian method which has been in development for about ten years now, is run in parallel to GA, and complements GA for the analysts since 2018.
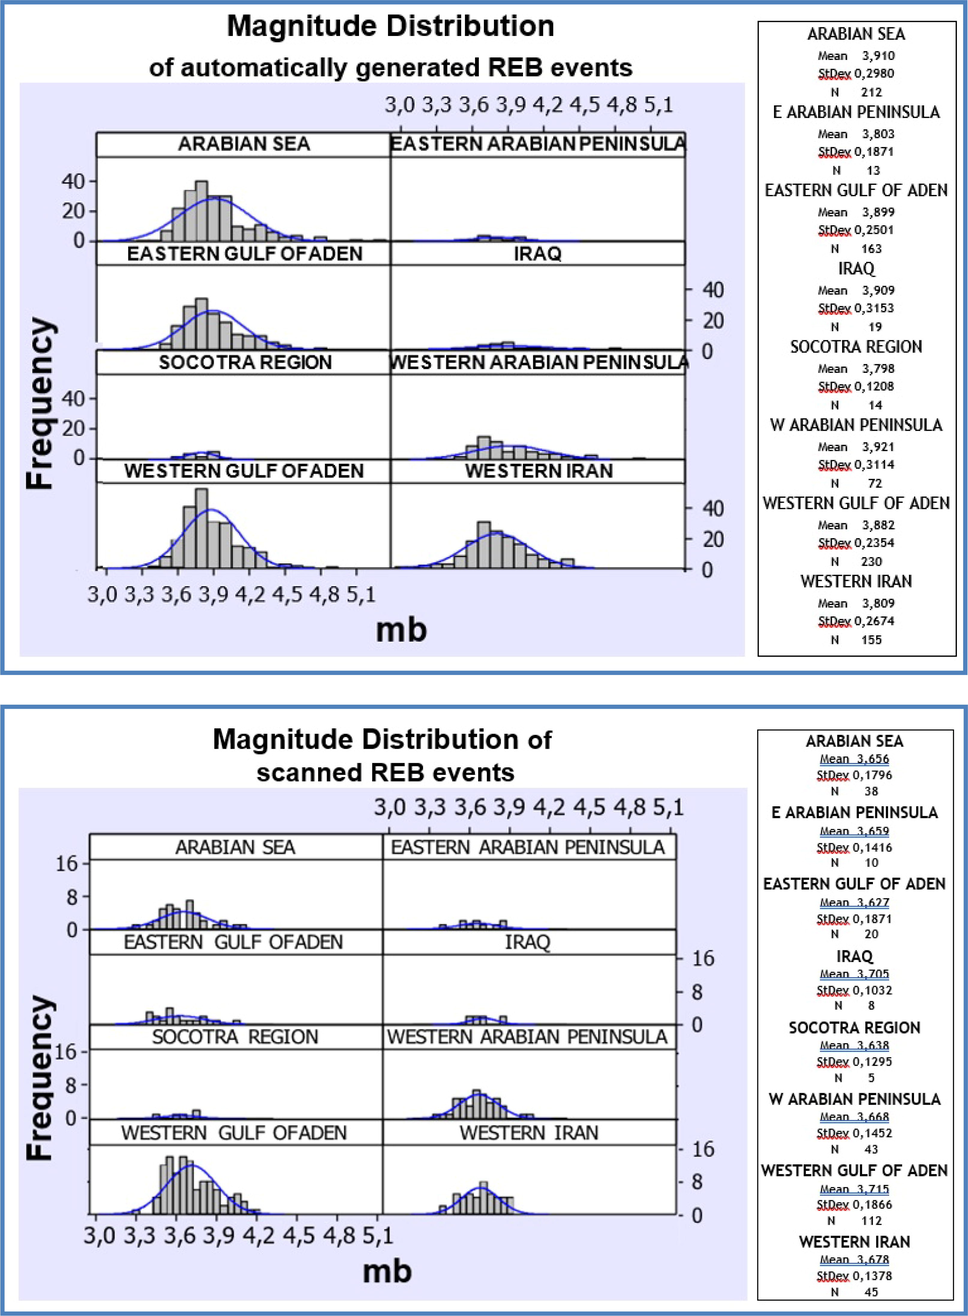
3 Magnitude distributions
The Dead Sea and Jordan–Syria regions include few seismic REB events (4 and 11, respectively), which do not provide enough statistics to make inferences about the whole area. Thus, they will not be included in this study. Events from the other ten regions are subdivided into two groups: automatic and scanned events to study the impact of the interactive analysis on earthquake monitoring. Thus, average magnitude values vary insignificantly for both groups of events (Fig. 5). The average magnitude values of automatic REB events are within the range from 3.72 (at Western Iran) to 3.92 (at Western Arabian Peninsula). The average magnitude values of scanned REB events are within the range from 3.61 (at the Red Sea) to 3.71 (at the Western Gulf of Aden).
- Interval plots of body wave magnitudes for automatically generated REB events (upper side) and scanned REB events (lower side).
4 Accuracy of seismic event locations
Accuracy of seismic event location is of utmost importance for the CTBTO monitoring system as it plays a vital role in event identification and in the preparation phase for an on-site inspection. It depends on measurement uncertainties and model bias. Currently, location uncertainties are given as uncertainty in-depth and a 90% confidence ellipse. The text of the Treaty specifies that an on-site inspection area must be ≤1000 km2 (a protocol to the Treaty, II.A.3 (https://www.ctbto.org/the-treaty/treaty-text/)). Then, an error ellipse of a smaller size is needed for an event to be located with adequate accuracy to be useful in the identification of a possible inspection area.
The interactive analysis enables to decrease the low border of confidence interval where a seismic event can be recorded and included in REBs (if it meets the EDC). Together, the EDC does not depend upon the precision of event location. The most useful guides, in this case, are confidence ellipse factors, such as semi-major (a) axis, semi-minor (b) axis, and the epicentral area (A = πa*b). Plots of the individual values of A for each geographic region (Fig. 6) reveal that the average values of A vary slightly for the group of automatically generated REB events and the number of extreme outliers is not high (relating to the average line), except for the Eastern Gulf of Aden region. In the group of scanned REB events (Fig. 6), the number of extreme outliers is high for almost all regions and the average values of A vary significantly among the regions.
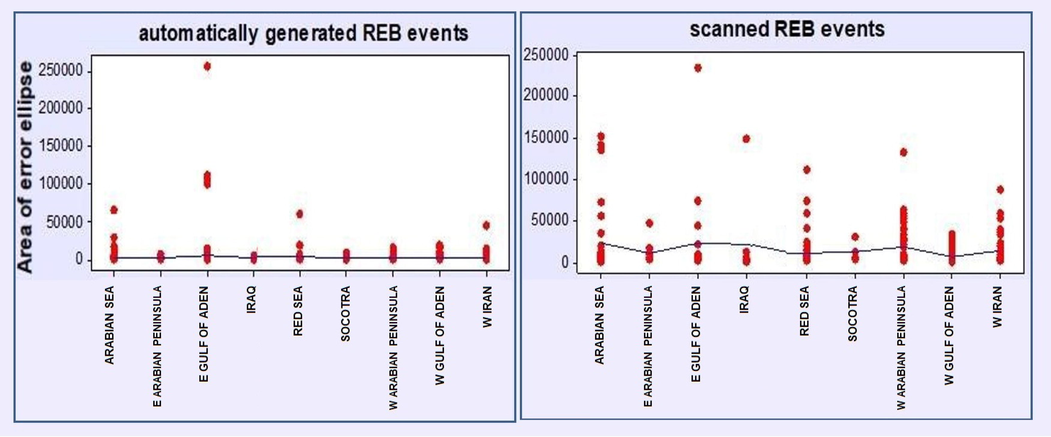
- Size of error ellipses according to geographic distributions of the automatically generated REB events (left side) and the scanned REB events (right side).
Since events with a high level of confidence ellipse are poorly identified, it is consistent to apply the aspect ratio (E = a / b) of the semi-major a-axis and semi-minor b-axis of the epicentral confidence ellipse as a second criterion to also be fit (Pearce et al., 2011). The epicentral confidence ellipse is a function of a final set of data residuals. Unfortunately, when few data are available, it can cause an unreasonably large confidence ellipse to be computed. Comparative plots at Fig. 7 show distributions of the error ellipse parameters A and E for REB events to the six geographic regions; the Arabian Sea, Eastern Gulf of Aden, Red Sea, Western Arabian Peninsula, Western Gulf of Aden, and Western Iran, where the total number of REB events was more than 30 events. This number varies significantly among the different regions. The Eastern Gulf of Aden is 10.93%, the Arabian Sea is 15.2%, Western Iran is 22.5%, Western Gulf of Aden is 32.75%, Western Arabian Peninsula is 37.39% and the Red Sea is 43.5%.
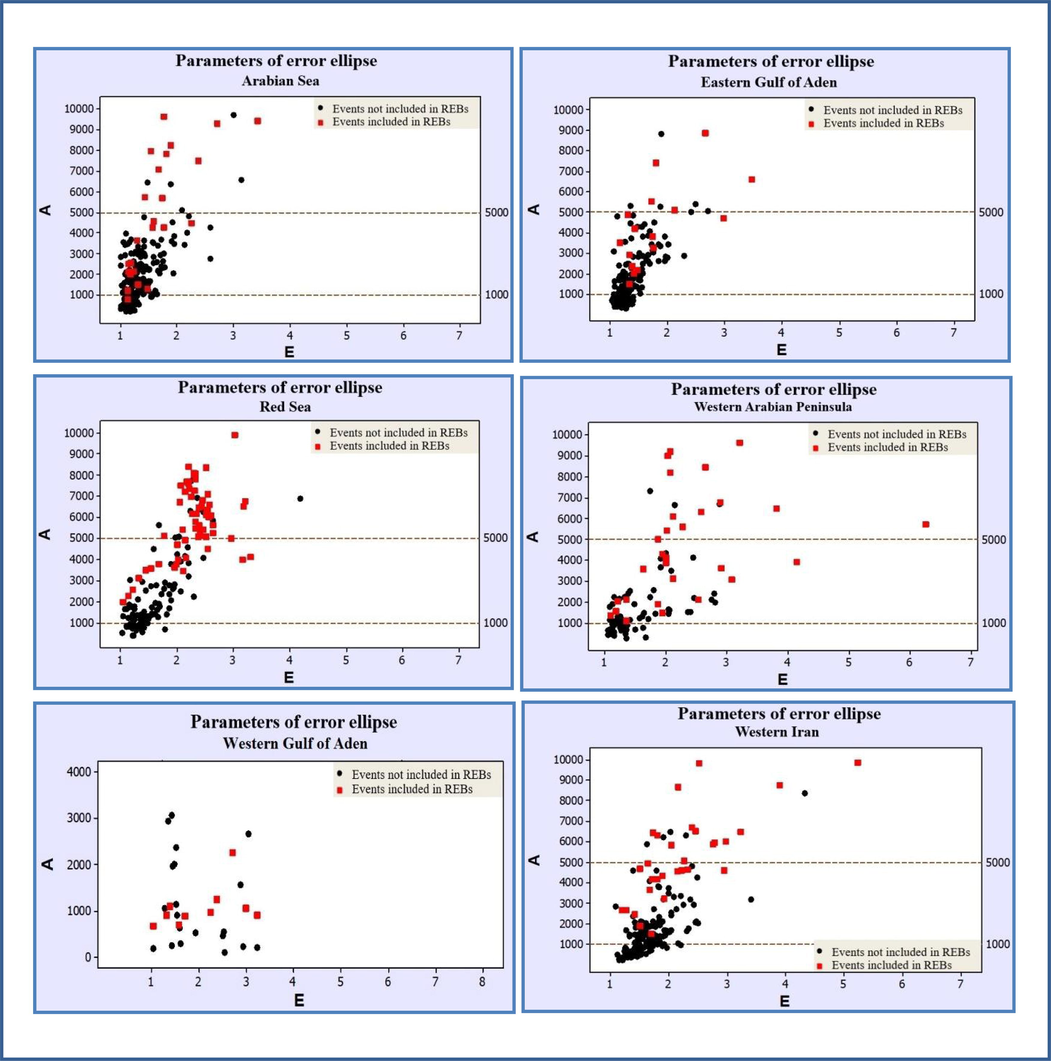
- Parameters of error ellipse A vs E of seismic REB events for Arabian Sea, Eastern Gulf of Aden, Red Sea, Western Gulf of Aden, Western Arabian Peninsula, and Western Iran.
In general, the REB events manually added during the interactive analysis have a higher location uncertainty in comparison with REB events that are automatically generated. The typical difference in location uncertainty assessment amongst the two groups cannot be clarified either by model bias since events within the same regions are compared or different station equipment, because data from the IMS seismic network have been used, or even by the human factor, because all events were reviewed by the same team of IDC analysts. The reason that explains this tendency is simply that the numbers of P-type phases included in the manually added events, in general, are smaller than the numbers of P-type phases included in the automatically generated REB events.
As indicated in most of the studied regions, around 95% of seismic events meet the REB EDC. Only two regions (Jordan-Syria and the Dead Sea) show relatively low percentages of REB events relative to the total number of saved events as exposed in Fig. 7; where the average value of A <4000 km2, while E values <5 or <3.2 for 90% of REB events in the Dead Sea and Jordan-Syria regions, respectively. Fig. 8 shows that the numbers of P-type phases contributing to event location differ among the two studied groups. It is comprehensible, considering that all scanned events are added during interactive analysis when the GA application has already performed its task and the analyst’s goal is to check reliable P-type seismic phases, which GA did not associate to any events.
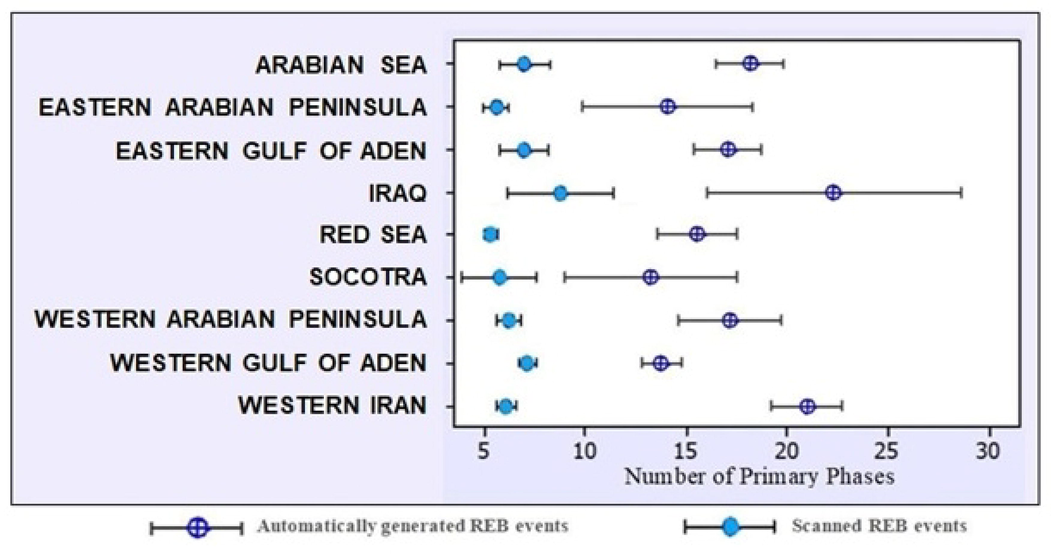
- Numbers of primary phases contributing to event location for the automatically generated REB events and the scanned REB events in all studied regions.
5 Seismic hazard assessment
Al-Amri et al., (2003) assessed the seismic hazard for western Saudi Arabia and the Red Sea region while, Abdalla and Al-Homoud (2004) evaluated earthquake hazard for the eastern Arabian Peninsula based on Peak Ground Acceleration (PGA) for 10% probability of exceedance for timespans of 50 and 100 years. The results indicate that the Northern Emirates is the most seismically active part of the UAE. The PGA in this region ranges between 0.22 g for a return period of 475 years to 0.38 g for a return period of 2400 years. Fnais (2011) simulated Peak Ground Acceleration (PGA) values for the Dammam big city of Saudi Arabia resulting from earthquakes with magnitudes 4.0 ≤ Mw ≤ 7.5 up to 300 km distance from the source using a stochastic model. Al-Arifi et al. (2013) calculated the maximum peak ground acceleration values are found around the Gulf of Aqaba and it is 325 Gal for a 475-year return period while the lowest value in the eastern region are 75 Gal. Almadani et al. (2015) studied the seismic hazard for Yanbu metropolitan city along the western coast of Saudi Arabia. Rehman et al. (2016) evaluated the maximum expected earthquake ground motions along with the western coastal province of Saudi Arabia.
Al-Haddad et al. (1994) obtained a PGA from 0.2 g to 0.3 g in 50 years for 10 and 5 percent probabilities of exceedance respectively for the Gulf of Aqaba and its coastal areas and Jizan, and from 0.05 g to 0.15 g for the other coastal and land areas of western Saudi Arabia; Al-Amri (1995) obtained the same values for the southern Red Sea region; Geomatrix (1996) showed values (0.1 g to 0.5 g) for Jizan; and Yucemen and Qa’dan (1987) had (0.15 g) for the Gulf of Aqaba. Moreover, the estimated PGA for some places is approximate: 0.2 g to 0.3 g for Abha; 0.05 g to 0.1 g for Tabuk; 0.2 g for Haql, Maqna, Bada, Ouyannah, Jizan, Jeddah, and Taif; 0.07 g for Dubai and Wajh; and 0.2 g to 0.3 g for the Gulf of Aqaba.
6 Discussion
To improve the effectiveness of the REB bulletin for seismic hazard studies, it is suggested that all events should pass the current criteria for reasons of continuity. This could be attained through the following choices:
-
-
In addition to events passing the current criteria, allow events with a sufficiently small confidence ellipse area to also be considered. The threshold value for the ellipse area should be set through studies added to the present one and apply solely to events in addition to the ones passing the current EDC.
-
-
Allow good quality auxiliary stations to participate in the weight in order to allow events such as the ones presented in this study to pass the EDC threshold for REB events. A study that adds to the present one could establish a criterion for deciding whether an auxiliary station is of good quality. This may depend on the type of the station, for instance, auxiliary array stations.
-
-
Base the EDC solely on the size of the confidence ellipse area. It becomes necessary to construct the correct threshold for the error ellipse size so that entirely REB events that passed the current criteria would also pass the confidence ellipse-based criteria. Contrary to option 1 above, it would be guaranteed that all REB events would have a confidence ellipse size smaller than the threshold.
The results of this study support the construction of a comprehensive earthquake catalog for the study area, which in turn helps to improve the calculations of earthquake hazards in the area for reducing earthquake risks that threaten major cities in the Arabian Peninsula.
7 Conclusions
IMS seismic stations recorded a considerable number of events within the Arabian Peninsula. A total of 1657 Late Event Bulletin (LEB) events have been compiled, from which 1356 events were REB events, and 995 events were automatically built by the automatic system, then were reviewed and saved by analysts. A major percentage of these events (as identified by IDC analysts) from certain areas (97.8% from the Dead Sea, 64.5% from Jordan-Syria, and 40.7% from the Western Arabian Peninsula) cannot be included in the REB, since they do not pass the current REB EDC. The manually detected seismic REB events vary widely amongst the studied regions. The magnitude detectability of the IMS enables to performance of valuable recordings with average magnitude spreads from 3.72 to 3.92 for automatic events and 3.61–3.71 for scanned events. Simultaneously, the location accuracy of the scanned REB events is lower on average than that of REB events originating from automatic events.
From the present study, it can be concluded that; the study of reviewed bulletins (REBs) from 1 January 2009 until 31 December 2014 reveals the lack of seismic REB events at the transform fault along the Dead Sea rift and East Anatolia. On the other hand, the western zone of the Gulf of Aden comprises numerous REB events. The IMS seismic stations through the Arabian Peninsula play an important role in earthquake recording except for the Dead Sea and Jordan-Syria regions. The present-day EDC for the REB is not appropriate in preparing a bulletin covering the best-located and analyst-verified events. The requirement of three primary seismic stations is insufficient for locations with good accuracy. Re-designing the EDC will be valuable for the seismological community since they could complete the REB bulletin with improved quality as well as enhance the quality of the International Seismological Centre (ISC) online bulletin available at (https://earthquake.isc.ac.uk/).
Due to the increase of population, rapid urbanization, and the strong economic growth in the Arabian Peninsula in recent years as well as the presence of newly attracted mega-projects (e.g., Multinational NEUM in Saudi Arabia, Expo 2020 in Dubai, the Special Economic Zone at Duqm in Oman, and the World Cup 2022 in Qatar), it is highly recommended that, recalculating the seismic risk for major cities in Arabian Peninsula should be done, especially the densely populated cities, in order to reduce the economic and environmental impacts of earthquakes.
8 Disclaimer
The official and commonly adopted United Nations nomenclature and terminology have been used in this research article and therefore the authors disclaim their responsibility for not using any other nomenclature outside of UN Directives.
Acknowledgements
Deep thanks and gratitude to the Researchers Supporting Project number (RSP-2021/351), King Saud University, Riyadh, Saudi Arabia for funding this research article.
Declaration of Competing Interest
The authors declare that they have no known competing financial interests or personal relationships that could have appeared to influence the work reported in this paper.
References
- J.A. Abdalla A. Al-Homoud Earthquake hazard zonation of eastern Arabia 2004 Vancouver, B.C., Canada August 1 6.
- Preliminary seismic hazard assessment of southern Red Sea region. Jour. Europ. Earthq. Eng.. 1995;3(1995):33-38.
- [Google Scholar]
- Seismic hazard assessment of western Saudi Arabia and the Red Sea region. In: Bulletin of the International Institute of Seismology and Earthquake Engineering. 2003. p. :95-112.
- [Google Scholar]
- A new evaluation of seismic hazard for the northwestern part of Saudi Arabia. Nat. Hazards. 2013;2013(69):1435-1457.
- [CrossRef] [Google Scholar]
- A basis for evaluation of seismic hazard and design criteria for the Kingdom of Saudi Arabia”. Earthq. Spectra. 1994;10:231-258.
- [Google Scholar]
- Study of seismicity in the NW Himalaya and adjoining regions using IMS network. J. Seismol.. 2017;21(2):317-334.
- [CrossRef] [Google Scholar]
- Seismic hazard assessment for Yanbu metropolitan area, western Saudi Arabia. Arab. J. Geosci.. 2015;8(11):9945-9958.
- [Google Scholar]
- Perspectives of Cross-Correlation in Seismic Monitoring at the International Data Centre. Pure Appl. Geophys.. 2011;171:3-5.
- [CrossRef] [Google Scholar]
- Development of calibration techniques for the Comprehensive Nuclear-Test-Ban Treaty (CTBT) international monitoring system. Phys. Earth Planet. Interiors. 1999;113:11-24.
- [Google Scholar]
- Coyne J., Bobrov D., Bormann P., Duran E., Grenard P., Haralabus G., Kitov I., and Starovoit Y. 2012. Chapter 17 CTBTO: Goals, Networks, Data Analysis and Data Availability (Version: January 2012; https://doi.org/10.2312/GFZ.NMSOP-2_ch17).
- CTBT, 1996. Retrieved November 11, 2019 from https://www. ctbto.org/fileadmin/user_ upload/legal/CTBT_English_withCover.pdf.
- A proposed basis for geographical and seismic regionalization. Rev. Geophys.. 1965;3:123-149.
- [Google Scholar]
- Fnais, M.S., 2011. Ground-motion simulation for the eastern province of Saudi Arabia using a stochastic model. www.witpress.com, ISSN 1755-8336 (on-line). WIT Transactions on State of the Art in Science and Engineering, Vol 120, https://doi.org/10.2495/ERES110121.
- The structural map of the Arabian Plate and surrounding areas. Episodes. 2014;27(2):111-114.
- [Google Scholar]
- Geomatrix Consult, 1996. Special geo-technical studies”. A report submitted to Ministry of Municipal and Rural Affairs, Deputy of Ministry of Town Planning in Saudi Arabia, Report NJHO, 2, Studies and Investigations, Vol. 3.
- Operational processing of hydroacoustics at the prototype international data centre. Pure Appl. Geophys.. 2001;158:425-456.
- [CrossRef] [Google Scholar]
- NET-VISA from cradle to adulthood. Pure Appl. Geophys.. 2020;178(7):2437-2458.
- [CrossRef] [Google Scholar]
- Le Bras, R., Swanger, H., Sereno, T., Beall, G., Jenkins R., 1999. Global association, Science Applications International Corp. Tech. Rept. ADA304805, San Diego, California.
- Le Bras, R., Russell, S., Arora, N., Miljanovic, V, 2011. Machine learning at the CTBTO. Testing, and evaluation of the false events identification (FEI) and vertically integrated seismic analysis (VISA) projects.
- Evaluation and comparison of the results of the NET-VISA seismic event association method based on Bayesian theory. Nat. Hazards. 2021;105(2):1521-1539.
- [Google Scholar]
- Pearce, R., Kitov, I., and Coyne, J. 2011. An alternative approach to waveform event definition criteria, Science and Technology Conference 2011, Poster T4-P30.
- Seismic hazard assessment of Western Coastal Province of Saudi Arabia: deterministic approach. Earthq. Sci. 2016;29(5):299-309.
- [CrossRef] [Google Scholar]
- Spiliopoulos, S., Pearce, R., and IDC analysts 2011. A regional investigation into the event location threshold using stations of the IMS, Science and Technology Conference 2011, poster T4-P37.
- Yucceman, S., Qa’dan, H., 1987. Seismic hazard analysis for Jordan. Proc. 2nd Arab Conference on Structural Engineering, Jordan Univ., 1987, 19-22 April.


