

Translate this page into:
Dynamic mechanical and thermal properties of Flax/bio-phenolic/epoxy reinforced hybrid composites
⁎Corresponding author. jawaid@upm.edu.my (Mohammad Jawaid)
-
Received: ,
Accepted: ,
This article was originally published by Elsevier and was migrated to Scientific Scholar after the change of Publisher.
Peer review under responsibility of King Saud University.
Abstract
Objectives
The influence of flax fibre loading on the dynamic thermal and mechanical characteristics of composites was investigated in this work.
Methods
Flax composites were fabricated at 30 (F-30), 40(F-40) and 50(F-50) wt% fibre loading. As a control, a bio-phenolic/epoxy polymer blend (P-20) containing 20% bio-phenolic was made.
Results
The findings suggest that the incorporation of flax into the composites led to an enhancement in the dynamic mechanical properties of the experimental sample. The glass transition temperature (Tg) was identified via dynamic mechanical analysis to be between 60 °C and 85 °C. Aside from that, the cole–cole plot revealed a heterogeneous mixture of fabricated samples, with strong fibre-to-matrix adhesion. Thermogravimetric analysis (TGA) showed adding flax to the composite reduces thermal stability.
Conclusions
With the integration of flax as reinforcement, it could be asserted that the composites' dynamic mechanical properties improved while their thermal stability reduced.
Keywords
Flax fibre
Epoxy resin
Bio-phenolic resin
Dynamic mechanical analysis
Thermal properties

1 Introduction
Fibre-reinforced polymer composites (FRC) are employed in a variety of applications, like in automobiles, aircrafts, and building parts. This is due its acceptable mechanical properties, lightweight, high impact strength, chemical/corrosion resistance, high fatigue resistance, and long-life expectancy (Chegdani et al., 2020; Sathees Kumar et al., 2021). Natural fibre has a lower environmental impact than synthetic fibre since it is renewable, sustainable, produce fewer greenhouse gases, and decreases dependency on petroleum-based resources (Banik et al., 2017; Potluri et al., 2017).
In 2019, the production of natural fibre alone was approximately 33 million tons, while the combined production of synthetic and natural fibres was estimated to reach 110 million tons which indicated that natural fibre accounted for 30% of the total production fibre (Townsend, 2020). Table 1 summarizes several of the natural fibres global production. Ramie, jute and kenaf the examples of plants that grow to harvest fibre, while oil palm, sugarcane bagasse, and flax are obtained from agricultural waste. Natural fibre-based polymer composites are employed in numerous industries, including furniture, construction, automotive, railway coaches, packaging, and aerospace (Mishra et al., 2020; Venkatesan and Bhaskar, 2020). In these applications, natural fibres such as flax, bagasse, jute, abaca, coir, kenaf, sisal and oil palm fibre have been employed (Mishra et al., 2020; Venkatesan and Bhaskar, 2020). Natural fibres intrigue scientists due to their modest weight, superior specific strength and modulus, nonabrasiveness, minimal cost, and biodegradability (Faruk et al., 2014; Nadlene et al., 2015).
Natural Fibre
World Production (×103 Tons)
Flax fibre and tow
790
Ramie
100
Jute-Kenaf-Allied fibres
3200
Cotton lint
25,960
Coir
1,000
Flax was cultivated primarily in France, Belgium and Canada to harvest it fibre and extract the oil from flax seed (Uppal et al., 2022). Flax is a low density fibre with high specific stiffness, cheap and recyclable (Bos et al., 2002; Summerscales et al., 2010). The use of the flax fibre depending on it grade. The high quality of the fibre was used in textile industry while lower quality was used in composite industry (Uppal et al., 2022). Flax fibre can improve the dynamic response of the composite due to its high crystalline structure, which enhances the interfacial adhesion among both adjoining fibre layers as well as consequently enhance polymer motions inside the composites.(Bos et al., 2002). The investigators looked at the viability of flax as a reinforcement on various polymer matrices.
It is critical to understand the maximum temperature that fibres can withstand throughout the production or fabrication process, as natural fibre is temperature sensitive. The thermostability of natural materials can be altered by temperature, which can result in the contraction or expansion of radiation heat, as well as an expansion in the volume and percentage of moisture absorption, which causes the fibres to swell (Wang et al., 2005). Natural fibre degrades at temperatures exceeding 180 °C, hence natural fibre-reinforced polymer composites fabricated at this temperature will have poor mechanical properties (Gassan and Bledzki, 2001). Researchers have reported that the flax fibres degraded at a temperature of around 200 °C (Kannan et al., 2013). According to the available literature, no research has been conducted on the dynamic mechanical and thermal characteristics of flax-reinforced bio-phenolic/epoxy composites. This study's primary objective is to assess the influence of flax loadings upon this dynamic mechanical as well as thermal characteristics of composites. The fabricated polymer blend with 20 wt% bio-phenolic was based on the results of the earlier studies. (Ismail et al., 2021; Ismail et al., 2023). The previous study reported the mechanical as well as physical characteristics of flax reinforced bio-phenolic/epoxy composites (Ismail et al., 2022).
2 Materials and method
2.1 Materials
The plain weave flax fabric was procured from commercial textile company in Guangdong, China, and utilized as reinforcement. The moisture content, weight and yarn count for the flax fabric is 7.20%, 160 GSM and 14 × 14 respectively. Composites were made with a polymer combination that included bio-phenolic and epoxy. Bio-phenolic resin came from Bangalore, India. The epoxy resin and hardener came from Selangor, Malaysia. Teflon sheet was supplied by Evergreen Sdn Bhd from Selangor, Malaysia.
2.2 Composites preparation
The experimental samples were fabricated with a dimension of 150 mm × 150 mm. As a control, a polymer blend containing 20 wt% bio-phenolic was produced. Table 2 shows the flax loading and the number of flax layers used in the fabrications. The fabrication method and materials were illustrated in Fig. 1.
Label
Flax loading (wt%)
Number of Layers
Storage modulus at Temperature 30°C, E’G (MPa)
Storage modulus at Temperature 120°C, E’R (MPa)
Effectiveness coefficient, C
P-20
0
–
2205
8
–
F-30
30
6
2609
199
0.048
F-40
40
8
4450
467
0.034
F-50
50
10
3978
496
0.029
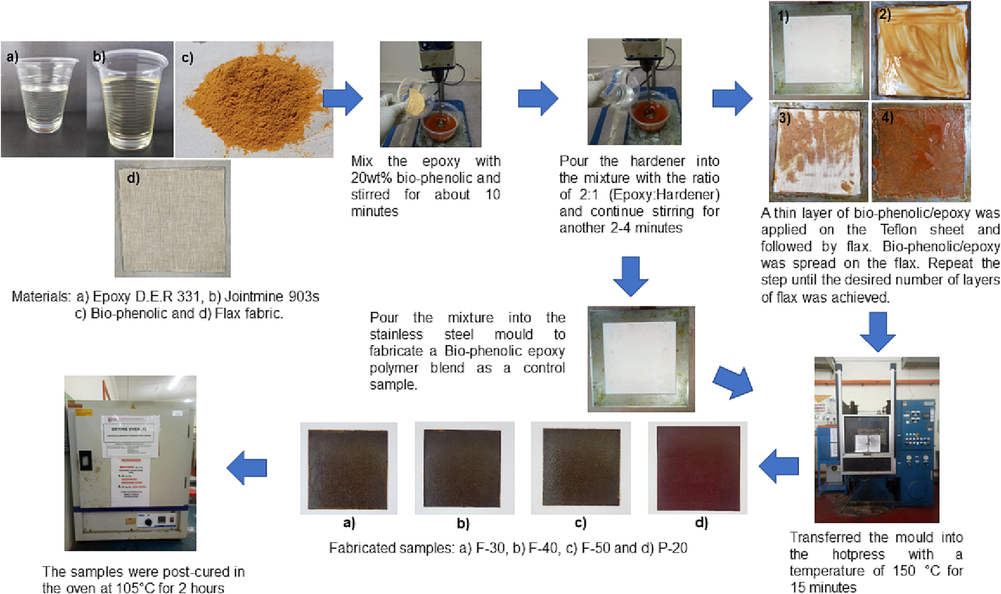
Fabrication method.
3 Testing of the materials
3.1 Dynamic mechanical analysis (DMA)
The specimen measuring 60 mm × 12 mm × 3 mm was evaluated in line with ASTM D 4065 using DMA 800 to determine its mechanical properties. Three-point bending mode and 1 Hz frequency were used. The experimental composites were heated from 30 °C to 150 °C at 10 °C/min.
3.2 Thermogravimetric analysis (TGA)
Thermogravimetric Analysis was utilized to investigate the thermal decomposition profile of the samples as per ASTM E1131-03 (2003). All these measurements were taken with a Mettler Toledo 851e (Schwerzenbach, Switzerland). At a rate of 50 mL/minute, between 40 and 45 mg of samples were placed in the alumina crucible and subjected to pyrolysis in an environment containing nitrogen. The experimental composites were heated from 30 °C to 800 °C at a rate of 10 °C/min.
4 Results and discussion
4.1 Dynamic mechanical analysis
4.1.1 Storage modulus
The storage modulus of the samples is depicted within Fig. 2. As the temperature rises, the storage modulus gradually decreases as the temperature increases, the composite undergoes three distinct phases: the glassy region, the transition region, and the rubbery region. The polymer molecules behave differently in each region. The molecules are densely packed and have little mobility at low temperatures (glassy region), ensuing in a high storage modulus. As the temperature raises, molecules absorb the energy and undergo intrinsic motion. When the temperature approaches the Tg, the energy is absorbed, causing the chain to slowly detangle which increases the component's free volume and mobility. As a result, dramatically decrease of storage modulus was shown in the glass transition region. While the storage modulus of all composites remains constant in the rubbery region. The graph in Fig. 2 demonstrates an improvement in storage modulus by the incorporation of flax. This illustrates that adding reinforcement to the polymer matrix improved the material's ability to bear mechanical constraints while retaining recoverable deformation (Jawaid et al., 2012).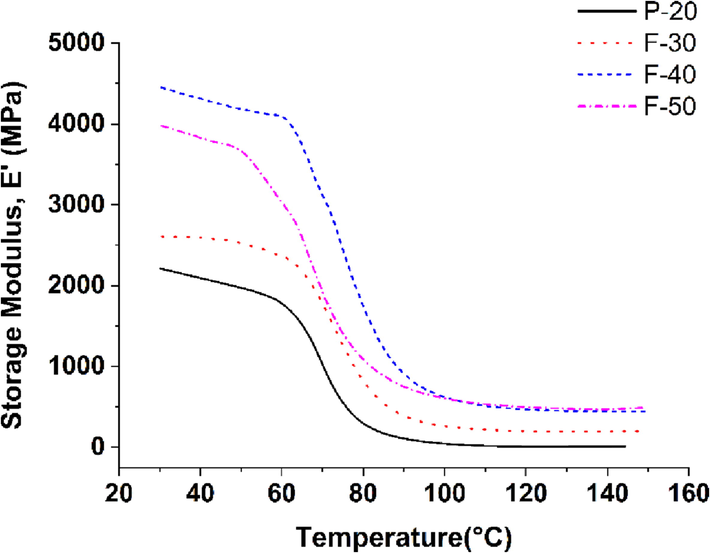
Storage modulus of F-30, F-40, F-50 and P-20.
The storage modulus is enhanced by increase the flax loading up to 40% wt and the storage modulus was reduced when flax loading increased to 50 wt%. The trend of the storage modulus in this study showed a similar pattern to the flexural modulus which was reported in the prior research (Ismail et al., 2022). The storage modulus of P-20 was 2210 MPa at 30 °C, but it dropped to 8 MPa once it approached the Tg. The results indicated that when a material is passed through Tg, the reinforcement increases the storage modulus of the samples. The findings showed that the reinforcement improved its storage modulus when a material passes through Tg. F-50 noted the uppermost storage modulus at 120 °C which is 496 MPa, while F-30 and F-40 recorded a storage modulus at 120 °C around 199 MPa and 467 MPa respectively. The efficiency of interfacial interaction in between matrix and the fibres was determined using the effective coefficient, C. Equation (1) was used to calculate the efficiency coefficient based on the storage modulus of the glassy region (30 °C) and rubbery region (120 °C). Where, E’G and E’R are storage modulus at the glass and rubbery regions respectively. The effectiveness coefficient is inversely related to the efficiency of fibre–matrix interfacial interaction. Table 2 shows the storage modulus (at glass and rubbery region) and the effectiveness coefficient of the experimental sample. In comparison to F-30 and F-40, F-50 has the lowest effectiveness coefficient, indicating that F-50 has strong interfacial interaction among fibres and matrix. The finding is agreed alongside the earlier suggestion that interfacial adhesion is better for F-50 compared to F-30 and F-40(Ismail et al., 2022).
4.1.2 Loss modulus
The loss modulus versus temperature of the composites was depicted in Fig. 3. P-20 exhibited the lowest peak for the loss modulus. The loss modulus of the experimental sample increase as temperature increases until it reaches the Tg, after that the loss modulus of the experimental sample will decrease with increasing in temperature. The addition of flax to polymer caused the peak of the loss modulus curve to rise and the width of the curve to expand. This is because both chain segment and free volume have increased (Woo et al., 1991). Furthermore, the difference in physical condition between the polymer matrix adjacent to the fibres and the matrix reduced molecular mobility. Additionally, the reinforcement of fibres increased the internal fraction and enhances energy dissipation (Jawaid et al., 2012; Sharma et al., 2021). F-40 and F-50 had nearly identical peak values for loss modulus, 454 MP and 459 MPa, respectively. While F-30 showed the lowest value for the peak of loss modulus among the composites with reinforcement which is 372 MPa.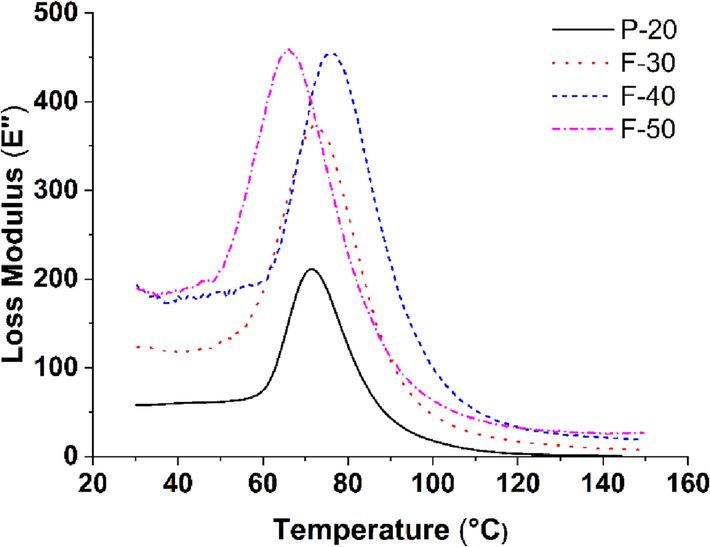
Loss modulus of F-30, F-40, F-50 and P-20.
4.1.3 Damping factor (Tan Delta)
Fig. 4 illustrates the damping factor of F-30, F-40, F-50 and P-20. Tan delta denotes the association between the storage modulus (E′) and the loss modulus (E″) properties. The greater the Tan delta peak, more energy is dissipate, resulting in significant non-elastic deformation. A minimal value, on the other hand, indicates that the material is much more elastic. Tan delta increased as temperature increased, reaching an optimum in the transition region and continuously declining in the rubbery region. The low value of tan delta in the glassy region is due to the arrangement of the molecules which close to each other’s in the composites and their freezing condition (Anand et al., 2018). The molecule absorbs adequate energy to gradually untangle the chain as the temperature rises until it reaches the transition region, which leads to an increase in free volume and molecular mobility. In contrast, the molecules' chains are disentangled in the rubbery region, allowing the molecules to flow easily and without resistance, leading to a low damping factor. The maximum peak of the Tan delta is shown in Table 3. The highest peak for tan delta was observed in P-20 compared to flax composites, and two peaks were observed. P-20 has the largest peak in the tan delta curved, indicating greater molecular mobility, larger energy dispersion, and greater viscosity. Due to the presence of bio-phenolic in the system, which has a higher Tg than epoxy, there are two peaks in P-20 (Table 3).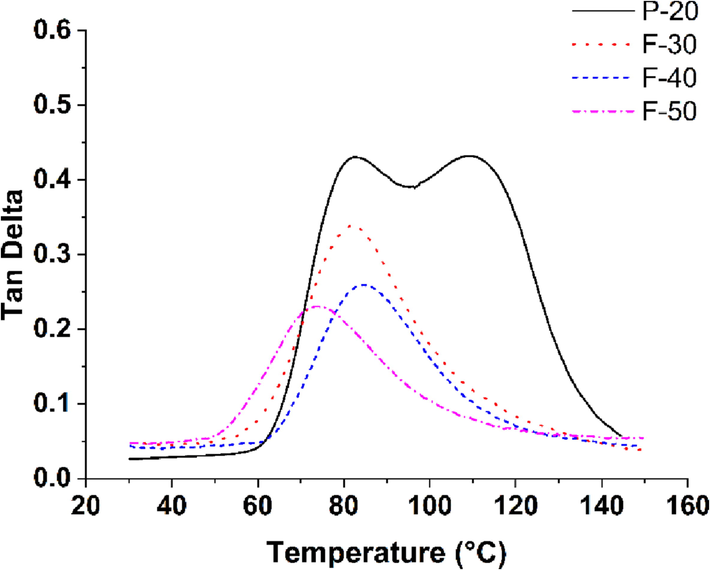
Damping factor of F-30, F-40, F-50 and P-20.
Type of Composites
The peak of Tan delta
Tg from Tan delta (°C)
The peak of loss modulus (MPa)
Tg from Loss Modulus (°C)
P-20
0.43/0.43
82.55/ 109.23
210.97
71.33
F-30
0.34
82.92
372.07
73
F-40
0.26
84.58
454.27
76.33
F-50
0.23
73.92
459.22
66.08
However, when reinforcement was added, only one peak was observed due to the reinforcement reducing the molecules' mobility in the composites. The peak for tan delta decreases as the flax loading increases. The decrease in the peak of the Tan delta is explained by the fact that as fibre loading increases, molecular mobility and free volume decrease. According to de Medeiros et al., (2005) the fibre loading and orientation of fibre in composites affected the free volume and molecular mobility. Incorporation of reinforcement/filler in matrix has stop the molecules' segments from moving around, which can be good evidence, reinforcement/filler embedded in polymer chain diminished the mobility of molecule and decreased the friction between them (Mohammed et al., 2017). Additionally, according to Jawaid et al., (2012) reinforcement in polymer composites performed as a deterrent, limiting the polymer's chain mobility, resulting in decreased flexibility and degree of molecular motion, and thus decreased its damping properties. Furthermore, a lower value of the Tan delta peak indicates the adhesion between fibres and matrix was enhanced. Among all the composites fabricated, F-50 has better fibres and matrix adhesion. A similar trend was shown for the effectiveness coefficient (C) which discuss in the storage modulus.
4.1.4 Glass transition (Tg)
With the help of dynamic mechanical analysis, the peak of the tan delta curve, the loss modulus, or the half height of the storage modulus curve can be used to figure out the Tg of a polymer composite (Venkategowda et al., 2021). The Tg determined by loss modulus is more convincing and realistic than the value determined by the Tan delta's peak. The Tg is illustrated in Table 3 using the peak of tan delta and loss modulus. P-20 exhibited two peaks for tan delta but only one for loss modulus. The Tg from the loss modulus peak was found to be lower than the tan delta peak. The Tg was enhanced by raising the flax loading to 40 wt%. However, increasing the flax loading to 50 wt% reduced the Tg, which is now lower than the Tg of P-20.
4.1.5 Cole-cole
The homogeneity of the polymer matrix and reinforcement can be determined using cole–cole plots (Karaduman et al., 2014). The graph can be used to explore how structural changes in polymers occur when reinforcement is introduced (Harris et al., 1993). In order to investigate the correlation between the storage modulus and the loss modulus, a cole–cole plot was constructed and analyze. The shape of the cole–cole plot can be handled to predict the uniformity of the polymer matrix and reinforcement. An even and semi-circular arc indicates a homogeneous polymer composite, whereas an imperfect or elliptical curve indicates nonhomogeneous dispersion and heterogeneity in polymer composites (Mohammed et al., 2017; Chee et al., 2019). Additionally, ellipsoidal curves show a strong adherence between fibre and matrix. The cole–cole plots for F-30, F-40, F-50 and P-20 are shown in Fig. 5. Cole-cole plots revealed imperfect semi-circles for all composites, indicating the system's heterogeneity. The shape of the curve P-20, on the other hand, it indicates that the bio-phenolic and epoxy molecules is a homogeneous mixture. Cole-cole plots demonstrated a broad curve as the fibre loading increased. This indicate that the fibre and matrix adhered to one another reasonably well. According to the curve, fibre and matrix adhesion is optimal at a fibre loading of 40 wt%. This can be seen with the curved of F-40 is broader compared to other composites. The finding was agree with the finding on the flexural properties of the same composite reported in previous study (Ismail et al., 2022) which showed that F-40 has the highest flexural strength. Similar findings were reported in Kumar et al. (2020) investigation which showed after fibre loading raise up to 45 wt% the cole–cole curved become broaden and indicate the effective interfacial interaction amongst fibres and matrix.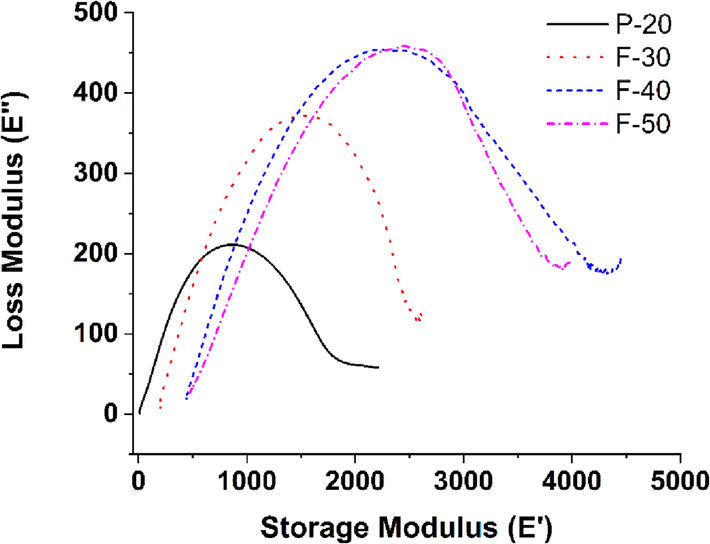
Cole-cole plot of F-30, F-40, F-50 and P-20.
4.2 Thermogravimetric analysis (TGA)
The effect of various flax loadings on the thermal properties of bio-phenolic/epoxy was determined using thermogravimetric analysis. The relationship between weight loss and temperature of F-30, F-40, F-50 and P-20 is depicted in Fig. 6(a), While Fig. 6(b) depicts the first derivative curve of thermogravimetric (DTG) of F-30, F-40, F-50 and P-20. According to the curves in Fig. 6(a) all composites degrade in a single step between 300 °C and 550 °C. This can be proved with a single peak shown in the DTG curve for all composites. The temperatures at which the experimental sample lost 5%, 25% and 50% of their total weight are shown in the Table 4, as well as the temperature at which the residue decomposed at 800 °C. The 5% total weight loss of flax-reinforced composites was observed to occur below 300 °C. While the P-20 reached temperatures of over 300 °C. This occurred as a result of the evaporation of inherent moisture and water absorbed physically by the fibres (Monteiro et al., 2012). When the temperature of decomposition was measured at various weight losses, it was discovered that increasing the flax loading lowers the temperature of decomposition. This indicates that the addition of flax has caused a massive drop in the thermal stability of composites. The decrease in thermal stability was caused by the significantly lessened thermal stability of natural fibres correlated to the polymer matrix (Chee et al., 2019). Note* Temperatures are given based on total weight lost at 5%, 25% and 50%.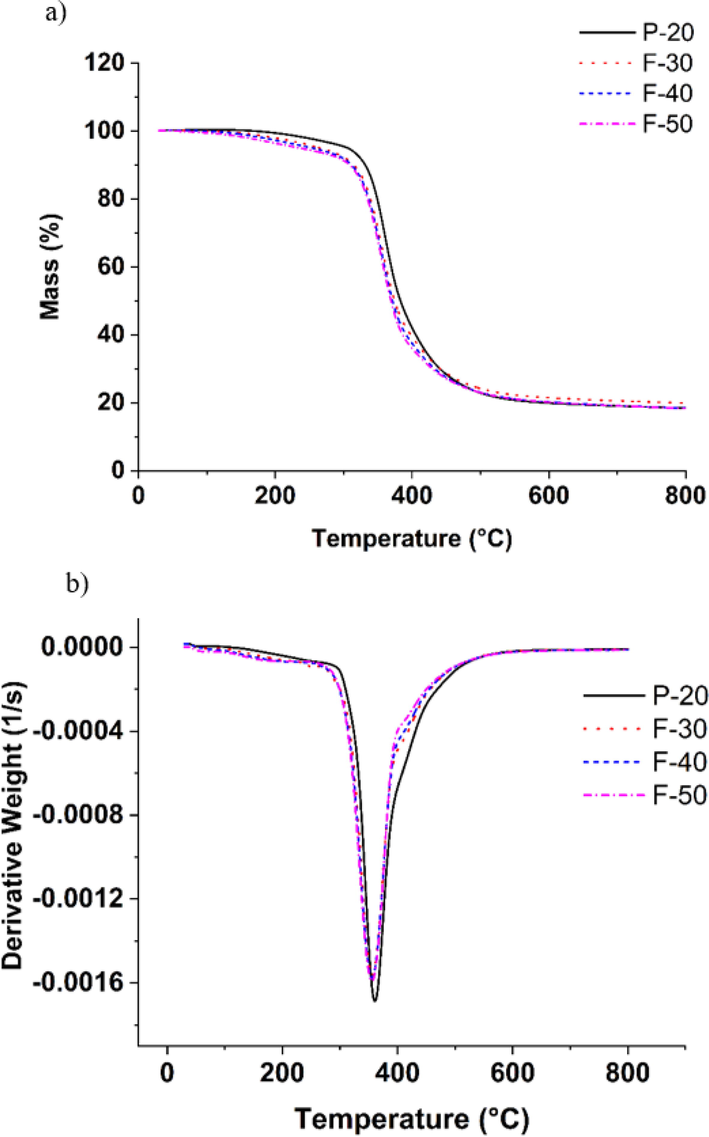
TG and DTG plot of F-30, F-40, F-50 and P-20.
Type of composites
T (°C) at 5 %
T (°C) at 25 %
T (°C) at 50 %
Residue at 800 °C
(%)
P-20
306.12
354.5
383
18.45
F-30
265.17
345.67
374.5
19.92
F-40
254.5
343.5
371.33
18.4
F-50
235.83
341.68
369
18.32
5 Conclusion
To assess the dynamic mechanical and thermal properties, different loadings of flax-reinforced bio-phenolic/epoxy were fabricated. The addition of flax to experimental sample polymer blends demonstrated improvement in storage modulus, loss modulus and damping factor. The cole–cole plot denoted that the samples are heterogeneous, and the fibres adhered well to the polymer matrix. When flax was added as reinforcement, the good interfacial interaction among fibres and polymer matrix was derived in intensification in the storage modulus and loss modulus of the samples. However, the use of flax as reinforcement decreased the composites' thermal stability. After reinforcing with flax, the decomposition temperature of the experimental sample decreased compared to a P-20. The findings of this study as well as a previous findings were used to assess the qualities of flax composites at various fibre loadings, and the optimal fibre loading will serve as the basis to explore the characteristics of flax/carbon/kevlar hybrid composites with the intention of developing a ballistic helmet.
Funding
The first author wishes to express his gratitude to Universiti Putra Malaysia for the financial support provided by Graduate Research Fellowship for this research. The authors wanted to express their gratefulness to Universiti Putra Malaysia for providing funding for this research via Grant Putra Berimpak: 9700800. The authors extend their appreciation to the Deputyship for Research and Innovation, Ministry of Education in Saudi Arabia for Funding this research work through the Project no. (IFKSUOR3-204-02).
Declaration of Competing Interest
The authors declare that they have no known competing financial interests or personal relationships that could have appeared to influence the work reported in this paper.
References
- Dynamic mechanical, thermal and wear analysis of Ni-P coated glass fibre/Al2O3 nanowire reinforced vinyl ester composite. Alex. Eng. J.. 2018;57(2):621-631.
- [Google Scholar]
- An overview of lignin & hemicellulose effect upon biodegradable bamboo fibre composites due to moisture. Mater. Today: Proc... 2017;4(2):3222-3232.
- [Google Scholar]
- Tensile and compressive properties of flax fibres for natural fibre reinforced composites. J. Mater. Sci.. 2002;37:1683-1692.
- [Google Scholar]
- Evaluation of the hybridization effect on the thermal and thermo-oxidative stability of bamboo/kenaf/epoxy hybrid composites. J. Therm. Anal. Calorim.. 2019;137(1):55-63.
- [Google Scholar]
- Thermomechanical and dynamic mechanical properties of bamboo/woven kenaf mat reinforced epoxy hybrid composites. Compos. Pt. B-Eng.. 2019;163:165-174.
- [Google Scholar]
- Effect of flax fibre orientation on machining behavior and surface finish of natural fibre reinforced polymer composites. J. Manuf. Process.. 2020;54:337-346.
- [Google Scholar]
- Mechanical properties of phenolic composites reinforced with jute/cotton hybrid fabrics. Polym. Compos.. 2005;26(1):1-11.
- [Google Scholar]
- Progress report on natural fibre reinforced composites. Macromol. Mater. Eng.. 2014;299(1):9-26.
- [Google Scholar]
- Thermal degradation of flax and jute fibres. J. Appl. Polym. Sci.. 2001;82(6):1417-1422.
- [Google Scholar]
- Study of carbon fibre surface treatments by dynamic mechanical analysis. J. Mater. Sci.. 1993;28(12):3353-3366.
- [Google Scholar]
- Mechanical and morphological properties of bio-phenolic/epoxy polymer blends. Molecules. 2021;26(4):773.
- [Google Scholar]
- Dimensional stability, density, void and mechanical properties of flax fabrics reinforced bio-phenolic/epoxy composites. J. Ind. Text.. 2022;52 15280837221123594
- [Google Scholar]
- Physical, structural and thermal properties of bio-phenolic/epoxy polymers blends. Mater. Today Commun.. 2023;34:105455
- [CrossRef] [Google Scholar]
- Woven hybrid biocomposites: dynamic mechanical and thermal properties. Compos. Pt. A-Appl. Sci. Manuf.. 2012;43(2):288-293.
- [Google Scholar]
- Effect of reinforcement on the mechanical and thermal properties of flax/polypropylene interwoven fabric composites. J. Ind. Text.. 2013;42(4):417-433.
- [Google Scholar]
- Viscoelastic properties of surface modified jute fibre/polypropylene nonwoven composites. Compos. Pt. B-Eng.. 2014;67:111-118.
- [Google Scholar]
- Mechanical, DMA and Sound Acoustic behaviour of Flax woven fabric reinforced Epoxy composites. Mater. Res. Express.. 2020;7(8):085302
- [Google Scholar]
- Bio-composites reinforced with natural fibres: comparative analysis of thermal, static and dynamic-mechanical properties. Fibre. Polym.. 2020;21(3):619-627.
- [Google Scholar]
- Dynamic mechanical analysis of treated and untreated sugar palm fibre-based phenolic composites. BioResources. 2017;12(2):3448-3462.
- [Google Scholar]
- Thermogravimetric behavior of natural fibres reinforced polymer composites—An overview. Mater. Sci. Eng. A.. 2012;557:17-28.
- [Google Scholar]
- Material characterization of roselle fibre (Hibiscus sabdariffa L.) as potential reinforcement material for polymer composites. Fibres Text. East. Eur. 2015
- [Google Scholar]
- Mechanical properties characterization of okra fibre based green composites & hybrid laminates. Mater. Today: Proc... 2017;4(2):2893-2902.
- [Google Scholar]
- Determination of mechanical properties and characterization of alkali treated sugarcane bagasse, pine apple leaf and sisal fibres reinforced hybrid polyester composites for various applications. Fibre. Polym.. 2021;22(6):1675-1683.
- [Google Scholar]
- Waste fly ash powder filled glass fibre reinforced epoxy composite: physical, mechancial, thermo-mechanical, and three-body abrasive wear analysis. Fibre. Polym.. 2021;22(4):1120-1136.
- [Google Scholar]
- A review of bast fibres and their composites. Part 1–Fibres as reinforcements. Compos. Pt. A-Appl. Sci. Manuf.. 2010;41(10):1329-1335.
- [Google Scholar]
- Townsend, T., 2020. 40 Million Households Produce Natural Fibres. Discover Natural Fibres Initiative.
- Cellulosic fibres-based epoxy composites: From bioresources to a circular economy. Ind. Crop. Prod.. 2022;182:114895
- [Google Scholar]
- Dynamic mechanical behavior of natural fibres reinforced polymer matrix composites–A review. Mater. Today: Proc. 2021
- [Google Scholar]
- Evaluation and comparison of mechanical properties of natural fibre abaca-sisal composite. Fibre. Polym.. 2020;21(7):1523-1534.
- [Google Scholar]
- Hygrothermal weathering of rice hull/HDPE composites under extreme climatic conditions. Polym. Degrad. Stabil.. 2005;90(3):540-545.
- [Google Scholar]
- Viscoelastic characterization of high performance epoxy matrix composites. Polym. Compos.. 1991;12(4):273-280.
- [Google Scholar]
Appendix A
Supplementary material
Supplementary data to this article can be found online at https://doi.org/10.1016/j.jksus.2023.102790.
Appendix A
Supplementary material
The following are the Supplementary data to this article:


