

Translate this page into:
Drying methods effect on bioactive compounds, phenolic profile, and antioxidant capacity of mango powder
⁎Corresponding author. jothi.engg@cvasu.ac.bd (Jakia Sultana Jothi)
-
Received: ,
Accepted: ,
This article was originally published by Elsevier and was migrated to Scientific Scholar after the change of Publisher.
Peer review under responsibility of King Saud University.
Abstract
Vacuum-dried mango powder had the highest antioxidant capacity compared to the other dried samples. Flavonoids had higher retention factors (RF) than phenolic acids. Caffeic acid was prevailing element among the detected 16 phenolics in mango powder.
Abstract
The effects of various drying methods (spray drying, cabinet drying, vacuum drying, tunnel drying, rotary oven drying, and gas oven drying) on the phenolic profile, bioactive compounds, and antioxidant capacity of mango powder have been considered with the aim of discover the effective drying technique. To identify and quantify the phenolic profile, the Folin-Ciocalteu method was used, while 1,1-diphenyl-2-picrylhydrazyl (DPPH) radical scavenging studies were utilized to elucidate the antioxidant capacity. Results showed that total phenolic content (TPC), total flavonoid content (TFC), total anthocyanin content (TAC) and total carotenoid content (TCC) showed substantial variations (p < 0.05) between different drying methods, and the antioxidant properties were influenced to different degrees by drying methods. The antioxidant capacity of dried mango powder is strongly correlated with phenolic compounds (polyphenol, flavonoids, and anthocyanin). Caffeic acid was predominant among the 16 phenolics in mango powder. Flavonoids had higher retention factors (RF) than phenolic acids. Finally, our findings indicate that both cabinet drying and vacuum drying are appropriate for mango powder production. However, taking into account both economic viability and phenolic compound quality, cabinet drying would be the supreme choice for the outturn of mango powder as antioxidant-rich flavor enhancers.
Keywords
Drying methods
Mango powder
Bioactive compound
Antioxidant capacity
HPLC
UV-VIS spectrophotometer

1 Introduction
Fruits are one of the important sources of various antioxidant phytocompounds for human diets. Mango (Mangifera indica) can be deliberated a rich genesis of bioactive phytochemicals and alimentary antioxidants, including phenolic compounds, carotenoids, and ascorbic acid. Polyphenols are plant secondary metabolites that can be present in a number of foods and beverages extracted from plants. Polyphenols are the influential to defend the human physique from chronic disorder. Mango phenolic compounds from mango pulps, arils, seeds, flowers, leaves, and stem bark have recently fascinated researchers’ interest due to their health-supporting properties, which comprise mangoes and their derivatives a healthy diet choice (Ajila et al., 2007; Berardini et al., 2005b; Masibo and He, 2008; Ribeiro et al., 2008). Mangiferin, quercetin, catechins, rhamnetin, kaempferol, anthocyanins, ellagic and gallic acids, propyl and methyl gallate, protocatechuic acid and benzoic acid are the main bioactive compounds such as polyphenols in mango. Mango polyphenols act primarily as antioxidants, help to protect human cells from destruction associated with oxidative stress that contributes to lipid peroxidation, DNA injury and many degenerative illnesses (Masibo and He, 2008).
Bangladesh grows a variety of nutritionally rich and delicious fruits because of its tropical and sub-tropical weathers. Although, a significant proportion of the harvested yield, mostly due to post-harvest losses, never reaches consumers. Fruit and vegetable postharvest losses are reported to be 15–50 percent (Okezie, 1998) and 20–40 percent (Hassan, 2010), respectively. Mango fruits are including different types of postharvest damages such as bruises, cuts, and sap burn etc. In Bangladesh, mango occupies about an area of 102,939 Acres with a production of inside and outside garden 12883315 M. tones according to BBS (2017). It is now a time demand to minimize the post-harvest loss by processing. The production of high-quality mango powder may meet the growing worldwide requirement for superfluous natural mango-flavored quencher and fulfill the significant demand for natural fruit powder by the pharmaceutical and cosmetic industries for the making of mango powders, including freeze-drying, spray drying, drum drying (Badami and Ramankutty, 2015). Every drying has its own advantages and restrictions. The final product found from these procedures differs in nutritional characteristics and microstructures (Akther et al., 2020).
Spray drying is extensively employed in the viable production of milk, fruits, and vegetables powder (Kim et al., 2009). There are numerous benefits to this method, such as fast drying, high throughput and continuous operation (Brenn et al., 2001). The feed liquefaction is sprayed into drops in a flow of heated air during the drying process. Due to extremely efficient heat and mass transfer, the liquefied droplets are dried in instants (Muzaffar et al., 2017). The ended product can be prepared in the form of fine dry particles (powder), small compact particles, or conglomerate.
Under low pressure, elimination of moisture occurs from food in a vacuum drying method. Besides, for the continual evaporation of water from the food, the requisite latent heat is supplied by a heated plate where a tinny layer of foodstuff is retained (Pap, 1995). Owing to proper heat and mass transfer, a puffed or frothy structure is developed that creates a large area to volume ratio (Jaya and Das, 2003).
A cabinet dryer is employed for drying the wet foodstuffs, which are positioned on the portable trays of stainless steel. Process or systematic air is a flow which used to heating wire and is heated until to reach the essential temperature, then allow continual flow to drying chamber through a multiple sprinkled holes (Mujumdar, 2006). The tray, which is used in this process, must have perforated, solid, or wire mesh bottoms (Hutchinson, 1930).
A tunnel dryer is a largest-scale with direct continuous type dryer where the food materials to be dried are placed through the air heated passageway known as tunnel (Mujumdar, 2006). At one end, the material is reached, and after that the expected dried produce at another end of the tunnel is collected. Effectual hot air is spread and moved out through the long insulated trolleys of the rail truck (Fuller and Charters, 1997).
The rotary oven dryer is used to remove the water content of food stuff by continuous direct exchange between the gas and solids (Amos, 1999). The food materials (may be heat-sensitive or not) to be dried flows in a continuous agitating or cascading motion in parallel or counter-current flow with the necessary heated gases or air through a long inclined drum or cylindrical shell that is slowly rotated on bearings (Krokida et al., 2006).
In a gas oven, the heat is transferred very quickly. A burner is shielded by a sheet of metal with large vents on the sides, which are positioned on the lower part of the kiln compartment and provide very intense radiant heat upwards into the oven compartment (Mujumdar, 2006).
Mango fruits have confined storing lifetime meanwhile they cannot be preserved at lower temperatures due to their sensibility to chilling impairment. Moreover, these circumstances of restrictions lead to considerable postharvest damages creating a huge extent of discarded fruits as bio-waste, which recommend the feasible to be developed into aptness value-added food products. Therefore, mangoes are prone to undesirable decomposition owing to their high-aquatic extent, subsequently drying can efficiently preserve this fruit while offering prolonged usage in various food produces. The drying process may have undesirable effect on food quality; hot air drying, for instance, has been shown to have a negative result on the nutritional properties and antioxidant substances of mango (Dorta et al., 2012). Therefore, the health-promoting properties of this underappreciated fruit need to be investigated.
In particular, phenolic compounds are gaining substantial interest. The characterization of the bioactive compound in mango cultivars in Bangladesh is still scarce. For such circumstances, the development of bioactive rich mango powder by effective drying methods for the consumer that will have antioxidant, anticarcinogenic, anti-inflammatory, and antimicrobial properties is time demand. Nevertheless, the antioxidant substances of fresh fruits can be influenced by drying techniques. Therefore, the present study was carried out to investigate bioactive compounds and antioxidant activity of mango powder obtaining by different drying methods. As different producers are using different drying techniques without having any proper knowledge to produce nutritious dried powder; hence, the production of mango powder with minimizing the losses of the bioactive compound and antioxidant capacity are the major challenges to the producer. It is therefore very important to examine the bioactive compounds of the dried products with the aim of minimize the damage of the bioactive compounds of the target powder.
2 Materials and methods
2.1 Materials
The ripe mangoes (Amropali cultivar) were bought from Chapainawabganj, Rajshahi, Bangladesh. Each mango was weighed an average of 241 ± 12.5 g. The size and color homogeneity of the peels was visually ensured. All chemicals used in this research were analytical grade.
2.2 Methods
2.2.1 Sample preparation
To eliminate the stem and blossom ends, the ripe mangoes were thoroughly washed, and then trimmed. To make concentrated mango pulp, the mangoes were peeled, cut into small pieces, and blended in a mixer (Philips HR 7761, China). Total soluble solids (TSS) were 17 ± 0.45 °Brix and pH was 4.92 ± 0.04 in the concentrated mango . The pulp yield was 70 %.
2.2.2 Production of mango powder using different drying methods
2.2.2.1 Spray drying
For the processing of mango powder, a laboratory spray dryer (B-290, Buchi, Switzerland) was used with a dehumidifier (B-296, Switzerland). Maltodextrin (MD) (DE = 12) (Sigma, USA) was used as a carrier agent, with a moisture content of 4.15 ± 0.02 %. To produce spray-dried powder, the following ingredients were used: 1 kg mango pulp + 60 g maltodextrin + 187 mL water. The sample was fed into the dryer using a peristaltic pump (Dingo-QI, China). The parameters used were as follows: feed rate, 15 mL/min; flow rate of compressed air, 35 m3/h; and 150 °C inlet temperature. The outlet temperature was recorded at 103 °C.
2.2.2.2 Cabinet drying
Two different categories of cabinet dryers were used to develop mango powder. The two categories were laboratory/small scale (Genlab 1000-L, UK) and industrial/large scale (Sinmag, rack oven-F3, Taiwan). The tray size was (8″ X 8″) and (19″ X 30″) for laboratory scale and large scale, respectively. The sample was put in the tray around 0.5 cm of thickness. For both scales, mango pulp was dried for 72 h at 70 °C.
2.2.2.3 Vacuum drying
The mango pulp was dried in a vacuum oven (JP Selecta S.A, 4001490-Vaciotem-TV, Spain) functioned for 24 h at 70 °C at 1 bar. The tray size was 8.5″ X 12″. The sample was put in the tray at 0.5 cm of thickness.
2.2.2.4 Tunnel drying
A continuous type tunnel dryer (NRO-1624, Naogaon Engineering Workshop, Bangladesh) was used. The oven body consisted of mild steel stainless sheet. The temperature was controlled by an automatic temperature controller on the control panel. The mango pulp was put in a tray (12″ X 16″) at 0.5 cm thickness and entered on the one end tunnel belt and dried at 70 °C for 48 h. Then dried mango pulp was collected at another passageway of the tunnel.
2.2.2.5 Rotary oven drying
A rotary rack oven (Arun Rega Three-phase Rack Oven, Tamil Nadu, India) was applied to dehydrate the mango pulp. The sample was put in a tray (15″ X 24″) at 0.5 cm thickness. The sample was dried at 70 °C for 48 h with a rotation of 700 rpm.
2.2.2.6 Gas oven drying
Mango pulp was taken in a tray (15″ X 24″) at 0.5 cm thickness and dried at 70 °C for 48 h in a gas oven (Sinmag, SM-803A, Taiwan).
2.2.3 Preparation of mango powder
A grinder (Panasonic MX-AC300, India) was used to grind the dried product (except spray-dried powder) to prepare fine powder. Then, all the dried mango powder were kept in air-tied plastic container at 4 °C temperature in the refrigerator. Since, the samples prepared by different individual drying methods were coded as SD (Spray-dried), CD(L) (Cabinet dried (laboratory/small scale)), CD(I) (Cabinet dried (industrial/large scale)), VD (Vacuum dried), TD (Tunnel dried), RoD (Rotary Oven-dried), and GoD (Gas Oven-dried).
2.2.4 Analysis of bioactive compounds
2.2.4.1 Extract preparation
Each sample of mango powder was shifted into respective beakers, after added with absolute ethanol (Merck, Germany), the solution left to agitation on a shaker for 72 h at ambient temperature (25.5 ± 1 °C). Then the solvent split up from the plant residue by straining. After that, the filtrate substances were collected and kept at room temperature (25.5 ± 1 °C) while the residue was re-extracted double, each time with fresh solvent. Lastly, all the filtrates were combined and evaporated under condensed pressure at 60 °C using a rotary evaporator (Heidolph™ HeiVAP Value Digital Model) to gather the crude extracts. The obtained crude extracts were balanced and kept at 4 °C until additional analysis.
2.2.4.2 Determination of polyphenol content
2.2.4.2.1 Total anthocyanin content (TAC)
TAC of the mango powder extracts was ascertained calorimetrically following the method designated with minor changes (Selim et al., 2008). For the experiment, an accurate volume of stock solutions of 10 mg/mL of extracts were made for usage. Moreover, aliquots of 3 mL of extract solution were pipetted into a cuvette. The concentration of the extracted color was controlled at wavelength 520 nm using UV–vis spectrophotometer (UV-2600, Shimadzu). Where, ethanol (Merck, Germany) was used for the blank. Using the following equation (1), TAC was expressed quantitatively as milligrams per 100 g (mg/100 g):
2.2.4.2.2 Total flavonoid content (TFC)
TFC of the mango powder extracts were examined using the aluminum chloride colorimetric method designated by Chang et al. (2002) but with slight modifications. In order to prepare the calibration curve, a proper volume of stock solution (1 mg/mL) of extracts were prepared. After that, quercetin (Sigma, USA) was liquefied in 80 % ethanol to prepare standard solutions (0.025, 0.050, 0.075 and 0.100 mg/mL). Furthermore, aliquots of standard solution (diluted extract of 0.5 mL) were mixed with 1.5 mL of 95 % ethanol, 0.1 mL of 10 % aluminum chloride (QualiChem, India), 0.1 mL of 1 mol/L potassium acetate (Merck, Germany), and 2.8 mL of distilled water in the cuvette. Then, the acquire mixture was permitted to cool to ambient temperature (25.5 ± 1 °C) for thirty minutes before being used. Subsequently, the absorbance at a wavelength of 415 nm in a UV–visible spectrophotometer was observed. For the blank preparation, ten percent aluminum chloride were substituted with distilled water of the equal amount. Since, examined TFC was stated as milligrams quercetin equivalents (QE) per 100 g of extract (mg QE/100 g).
2.2.4.2.3 Total phenolic content (TPC)
TPC of the mango powder extracts was examined according to the method designated with minor changes (Azizi et al., 2010). Since, an appropriate volume of stock solutions (1 mg/mL) of extracts and standard solutions of gallic acid (Sigma, USA) (0.02, 0.04, 0.06, 0.08, and 0.10 mg/mL) were made for experiment. After that, gallic acid standard solution or extracts (0.3 mL) were pipetted into a cuvette. Then, the diluted Folin Ciocalteu reagent (1.5 mL) were added and mixed. Furthermore, the mixture was kept for three minutes before adding 1.5 mL of sodium carbonate (75 g/L) solution and left for sixty minutes. Meanwhile, at 765 nm, the absorbance was measured using a UV spectrophotometer, and ethanol was susceptible as the blank.
TPC was considered and stated as milligrams of gallic acid equivalents (GAE) per 100 g of extracts (mg GAE/100 g).
2.3.4.3 Total carotenoid content (TCC)
TCC of mango (fresh pulp and powder) were examined according to the methods designated by Rodriguez-Amaya, (2001). Therefore, this procedure perceives the extraction of carotenoids from the mango samples with acetone (extracting agent), which actually followed by the dissociation with petroleum ether (DUKSAN, Korea). Then, the obtained less concentrated solution (diluted) was used to spectrophotometric measurements (UNICO, SQ-2800 UV/VIS, United Products and Instruments Inc., USA) and the required absorbance was observed at a wavelength of 450 nm. Hence, petroleum ether was susceptible as a control. While, the obtained result was expressed in terms of total carotenoids (μg/g), without considering the mass of the carrier agent. And, the total carotenoid content (TCC) of mango samples were calculated by the following Equation (2):
2.2.4.4 Determination of antioxidant capacity
The antioxidant capacity of the mango extracts were examined using DPPH (Sigma, USA) assay as designated by Azlim Almey et al. (2010) with minor changes. Therefore, an accurate volume of stock solution (1 mg/mL) of extract was diluted to less concentrate to concentrations of (0.50, 1.00, 1.50, 2.00, 2.50) mg/mL in methanol (Merck, Germany). Hence, 6 mg of DPPH were dissolved in 100 mL methanol to prepare the methanolic DPPH solution. And carefully, the methanolic DPPH solution (2 mL) was added to 1 mL of each extract solution of different concentrations. Then, the obtained mixture was kept for thirty minutes, and the absorbance was taken at wavelength of 517 nm. Subsequently, control was made by mixing 1 mL of methanol with 2 mL of DPPH solution. For the preparation of calibration curve, methanol was used as a blank, whereas Trolox (Sigma, USA) was used as a standard. Apart from that, antioxidant capacity based on the DPPH free radical scavenging ability of extracts were considered and stated as milligrams of Trolox equivalents (TE) per 100 g of extracts (mg TE/100 g).
2.2.4.5 Retention factor (RF)
Retention factor (RF) of phenolic compounds in all samples was calculated according to Rothwell et al. (2015), using Eqs. (3) and (4) as follows:
2.2.5 Bioactive compounds profiling
2.2.5.1 Chemicals
Gallic acid, 3,4-Dihydroxy benzoic acid, Catechin hydrate, Catechol, (-) Epicatechin, Caffeic acid, Vanillic acid, Syringic acid, Rutin hydrate, p-Coumaric acid, trans-Ferulic acid, Rosmarinic acid, Myricetin, Quercetin, trans-Cinnamic acid, and Kaempferol were purchased from Sigma–Aldrich (St. Louis, MO, USA). Acetonitrile (HPLC), methanol (HPLC), acetic acid (HPLC), and ethanol were received from Merck (Darmstadt, Germany).
2.2.5.2 Preparation of working standard solutions
In order to prepare the standard stock solutions, phenolic compounds (sixteen no’s) were solubilized with extracting agent (methanol) in a 25 mL volumetric flask. Where, the stock solution concentrations were varied from 4.0 to 50 µg/ml. So as to make the working standard solutions, the essential quantities of each stock solution were mixed simultaneously as well as diluted successively. Finally, all the prepared solutions were kept under cooling.
2.2.5.3 HPLC analysis
Study of HPLC was carried out on a Shimadzu (LC-20A, Japan) furnished with a binary solvent delivery pump (SIL-20A HT), column oven (CTO-20A), an autosampler (SIL-20A HT), and a photodiode array detector (SPD-M20A), as well as controlled by the LC solution software (Lab Solution Separation was completed using Luna C18 (5 µm) Phenomenex column (4.6 × 250 mm) at 33 °C. Apart from that, the mobile phase composed of A (1 % acetic acid in acetonitrile) and B (1 % acetic acid in water) with gradient elution: 0.01–20 min (5–25 % A), 20–30 min (25–40 % A), 30–35 min (40–60 % A), 35–40 min (60–30 % A), 40–45 min (30–5 % A), and 45–50 min (5 % A) was used in this study. Whereas, the sample injection volume was 20 µL, and the flow-rate was set at 0.5 mL/min. In the meantime, the UV detector wavelength was set to 270 nm and subsequently applied for validation of method and analysis. Then, a 0.45 μm Nylon 6, 6 membrane filter has filtered the mobile phase (India) and also degassed under vacuum. For the purpose of calibration curve, a standard stock solution was prepared in methanol containing Gallic acid (20 µg/ml); 3,4-Dihydroxy benzoic acid (15 µg/ml); Catechin hydrate (50 µg/ml); Catechol, (-) Epicatechin, Rosmarinic acid (30 µg/ml each); Caffeic acid, Vanillic acid, Syringic acid, Rutin hydrate, p-Coumaric acid, trans-Ferulic acid, Quercetin (10 µg/ml each); Myricetin, Kaempferol (8 µg/ml each); trans-Cinnamic acid (4 µg/ml).
2.2.6 Statistical analysis
Using IBM SPSS (Statistical Package for the Social Sciences) version 23.0, the obtained data were evaluated by one-way (Tukey's Multiple Comparison Test). At the level of p < 0.05, a significant difference was considered.
3 Results and discussions
3.1 Bioactive compounds analysis
Table 1 shows the bioactive compounds and antioxidant capacity of fresh mango pulp and powder prepared by various drying methods. Vacuum dried mango powder contained higher levels (0.22 ± 0.03 mg TA/100 g) of Total anthocyanin content (TAC) compared to other drying samples. This may be explained by the fact that vacuum drying's convective heat transfer decreases the boiling point of the dried materials, preventing discoloration, degradation, and other chemical changes (Afolabi, 2014) and hold a much higher level of functional content (Burova et al., 2017). Since moisture is removed in the absence of oxygen during vacuum drying, oxidative degradation, such as browning, is minimal in the finished product. Higher anthocyanin leads to having high antioxidant capacity. In this study, the TAC of mango powder has been varied to range between 0.15 ± 0.01and 0.22 ± 0.03 mg TA/100 g. There was no noticeable difference in the total anthocyanin content of the mango powder between the small scale and industrial scale cabinet drying samples, indicating that scale had no effect on the total anthocyanin content of the mango powder. On the other hand, spray dried powder and tunnel dried powder had comparatively higher TAC, which revealed that higher temperature with a short time influences color retention. RoD samples had the lowest TAC, like fresh mango samples, due to its direct heating methods. There was no statistically significant difference between CD(L), CD(I), GoD, TD, and SD samples. Significant at P < 0.05; Values followed by different superscript letters denote a significant difference; comparison done across drying methods. Where, FM = Fresh Mango, TAC = Total anthocyanin content, TFC = Total flavonoid content, TPC = Total phenolic content, TCC = Total Carotenoid content, AC = Antioxidant Capacity, SD = Spray Drying, CD(L) = Cabinet Drying (Laboratory/small scale) CD(I) = Cabinet Drying (Industry/large scale), VD = Vacuum Drying, TD = Tunnel Drying, RoD = Rotary Oven Drying, GoD = Gas Oven Drying.
Sample ID
TAC
(mg/100 g)TFC
(mg QE/100 g)TPC
(mg GAE/100 g)TCC
(μg/g)AC
(mg TE/100 g)
FM
0.15 ± 0.02
2.58 ± 0.01
20.62 ± 0.02
444.66 ± 0.04
1605 ± 3.00
Mango powder
SD
0.18 ± 0.01ab
8.75 ± 0.01f
33.58 ± 0.04f
102.22 ± 0.02f
1104.00 ± 6.00e
CD (L)
0.17 ± 0.03ab
18.38 ± 0.02a
44.09 ± 0.01c
104.35 ± 0.01e
1704.33 ± 9.50b
CD (I)
0.17 ± 0.01ab
11.35 ± 0.03d
46.12 ± 0.01a
105.20 ± 0.01d
1721.33 ± 9.07b
VD
0.22 ± 0.03a
16.83 ± 0.01b
44.83 ± 0.02b
110.47 ± 0.02b
2058.33 ± 7.02a
TD
0.19 ± 0.01ab
9.44 ± 0.02e
43.77 ± 0.04d
106.22 ± 0.02c
1307.00 ± 13.0d
RoD
0.15 ± 0.01b
3.87 ± 0.01 g
31.21 ± 0.01 g
115.22 ± 0.03a
1004.33 ± 10.5f
GoD
0.17 ± 0.03ab
12.86 ± 0.01c
43.52 ± 0.02e
45.01 ± 0.01 g
1481.00 ± 8.54c
The result of total flavonoid contents (TFC) of the extracts of fresh mango and mango powder samples are given in Table 1. Different drying methods resulted a wide range of TFC in powder. The extract concentrations ranged from 3.87 mg QE/100 g to 18.38 mg QE/100 g. Mango powder produced by cabinet drying in the laboratory had the highest flavonoid content than others, and it appears to be the most effective method for preserving flavonoid content. Process airflow through a manifold with uniformly spaced holes during cabinet dryer operation to heat up to the desired temperature, allowing for appropriate humidity and temperature control. Although, the second-highest value (16.83 ± 0.01 mg QE/100 g) was found in vacuum drying, which was also able to retain higher TFC for its unique drying techniques. Vacuum drying removes moisture from food under low pressure, supplying the latent heat provided for evaporation of water from the food (Pap, 1995). Similar to total anthocyanins content, direct, speedy heating is responsible for the lowest total flavonoid content values in rotary oven drying. After drying, TFC increases in almost all the powdered samples than fresh samples, which concludes that drying techniques are beneficial for retaining TFC in powder production. Apart from that, the variation of values may be due to the variation of environmental conditions of the dryer, which can modify the constituents of the sample. A highly significant mean difference was observed in TFC on different drying methods (SD, CD(L), CD(I), VD, TD, RoD, GoD).
Analysis of the total phenolic content (TPC) between mango and differently dried mango powder samples demonstrated that the TPC varies between 20.62 and 46.12 mg GAE/100 g (Table 1). Among all samples, total phenolic content was found in the following order: CD(I) > VD > CD(L) > TD > GoD > SD > RoD > FM and significantly different from one another. It has been noted that powder produced in large-scale cabinet dryers had significantly higher TPC values (46.12 mg GAE/100 g) than the other samples. Also, it can be noticed that similar to TFC, the total phenolic content of all powdered samples was higher than fresh mango.
The result of total carotenoid content (TCC) was ranged from 45.01 to 115.22 μg/g for different dried mango powder, which indicates four times reduction of carotenoids than fresh mango was observed for all dried powder. So, the total carotenoid of all dried powder showed a nearly opposite situation with bioactive compounds (TAC, TFC and TPC), indicating a tendency to degrade. Due to the double bonds in the carbon chain, carotenoids are exposed to certain reactions like oxidation and isomerization (cis–trans) during food processing particularly due to different heat treatment (different drying methods), processing time, temperature and oxygen (Provesi et al, 2011). As a result, biological activity of the carotenoids is reduced.
Antioxidant capacity (AC) refers to the ability of redox molecules to scavenge free radicals in foods and biological systems, which considers the additive and synergistic effects of all antioxidants rather than the effects of single compounds. Dietary antioxidants are therefore closely correlated with Antioxidant Capacity (AC) in terms of total phenolics (TPC), total flavonoids (TFC), and total anthocyanins (TAC) contents. However, the amount of AC consumed by an user is determined by the type and quantity of food consumed (Kalita and Jayanty, 2014). Vacuum-dried mango powder had the highest AC compared to the other dried samples. Furthermore, AC results from this study show that significant differences can be observed among samples. TPC and AC were found to have a close relationship in a variety of fruits, vegetables, and grain products, according to Velioglu et al. (1998). The higher antioxidant-rich powder had a higher free radical scavenging ability. The AC may have been affected by a variety of species (cultivars) and environmental factors such as maturity, climatic growth conditions, growth, ripening stage, temperature, storage period, and thermal treatment. Among all samples, AC was found in the following order: VD > CD(I) > CD(L) > GoD > TD > SD > RoD.
3.2 Drying methods effect on the retention of TAC, TFC, TPC, TCC and AC in mango powder
Retention factors (RF) of TAC ranged from 0.22 to 0.38; TFC ranged from 0.34 to 1.67; TPC ranged from 0.34 to 0.56; TCC ranged from 0.02 to 0.06 and antioxidant capacity ranged from 0.15 to 0.33 in mango powder dried by different methods (Fig. 1). TFC presented higher RF (on average more than 1.0) than other bioactive compounds. TFC increases after drying by CD, VD and GoD, due to might be interconversion of phenolic compounds by isomerization and hydrolysis reactions (Que et al., 2008; Rothwell et al., 2015) in addition to discharge from cell structures (Nunes et al., 2016). The most bioactive compounds (TCC, TPC, and TAC) appeared lower than 1.0 RF, suggesting destructed by drying method, possibly owing to oxidation (Nunes et al., 2016). Nunes et al. (2016) stated RF lower than 1.0 for TPC of the oven and freeze-dried guava powder. The bioactive components (TCC, TPC, TFC, and TAC) and antioxidant capacity retention in fruit powder associated with drying methods are limited. Rothwell et al. (2015) reported the effect of domestic cooking methods on the RF of phenolic compounds. Phenol-Explorer database incorporated RF of phenolic compounds where only three dried fruits (oven-dried plums, dried figs, and freeze-dried tomatoes) data have been available (https://www.phenol-explorer.eu; Rothwell et al., 2015).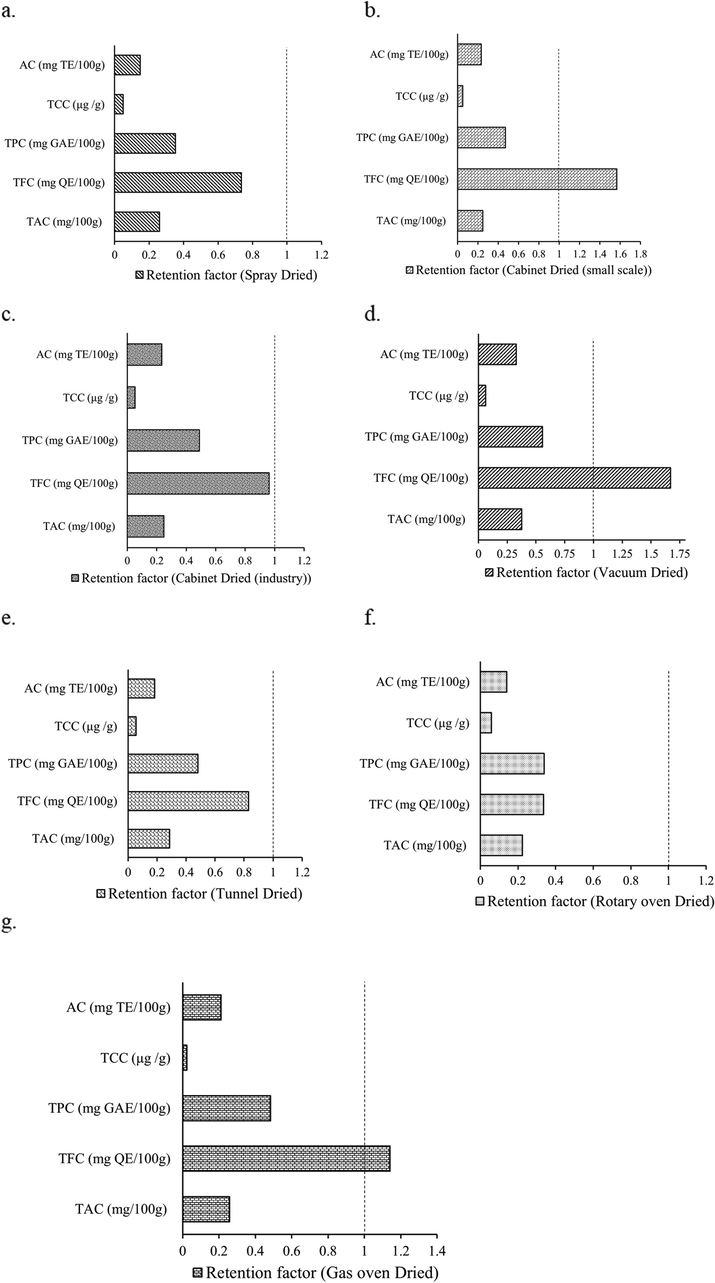
Retention factor of TAC, TFC, TPC, TCC and Antioxidant capacity in Spray dried (a), Cabinet dried (laboratory/small scale) (b), Cabinet dried (industrial/large scale) (c), Vacuum dried (d), Tunnel dried (e), Rotary Oven dried (f), and Gas Oven dried (g) mango powder.
3.3 Correlation among TPC, TFC, TAC, TCC, and AC
Pearson’s correlation coefficients among TPC, TFC, TAC, TCC with antioxidant capacity (DPPH assay) are shown in Table 2. The findings indicate that TFC, TPC, and TAC demonstrate a significant correlation with antioxidant capacity in the order of TFC > TPC > TAC. This implies that the capacity of the antioxidant of dried mango powder is more associated with TFC (R = 0.863, p < 0.01) and TPC (R = 0.826, p < 0.01). Consequently, TAC (R = 0.482, p < 0.05) is moderately correlated therefore contributed relatively less to the antioxidant capacity. The correlation between TCC and corresponding antioxidant capacity was not statistically significant. The findings indicate that phenolic compounds (polyphenol, flavonoids, and anthocyanin) are the most significant contributors to the antioxidant capacity of mango powder. Several studies have been published on the relationship between phenolic content and antioxidant capacity; some authors have identified a strong correlation between phenolic content and antioxidant capacity (Almeida et al., 2011; Reddy et al., 2010; Silva et al., 2007; Mahattanatawee et al., 2006; Thaipong et al., 2006; Kuskoski et al., 2005), on the other hand, others have noticed no correlation (Ismail et al., 2004; Imeh and Khokhar, 2002). The drying methods’ effect on the contributions of phenolics, flavonoids, anthocyanins, and carotenoids content to the antioxidant capacity of mango powder was not examined specifically in any previous research. **Correlation is significant at the 0.01 level (2-tailed); *Correlation is significant at the 0.05 level (2-tailed); N = 21.
Correlation (Sig.)
AC
TAC
TFC
TFC
TAC
0.482* (0.027)
–
–
–
TFC
0.863** (0.000)
0.400 (0.072)
–
–
TPC
0.826** (0.000)
0.356 (0.113)
0.750** (0.000)
–
TCC
−0.017 (0.948)
0.112 (0.628)
−0.173 (0.453)
−0.240 (0.294)
In addition to the statistical correlation in Table 2, a visual correlation presentation of TPC, TFC, TAC, and corresponding AC of various drying methods are shown in Fig. 2. This figure revealed that AC could be explained by the TPC, TFC, and TAC. It is also visualized in Fig. 2 that not all phenolic compounds have shown similar antioxidant potential, which is agreed with other findings already reported (Almeida et al., 2011; Tukun et al., 2014).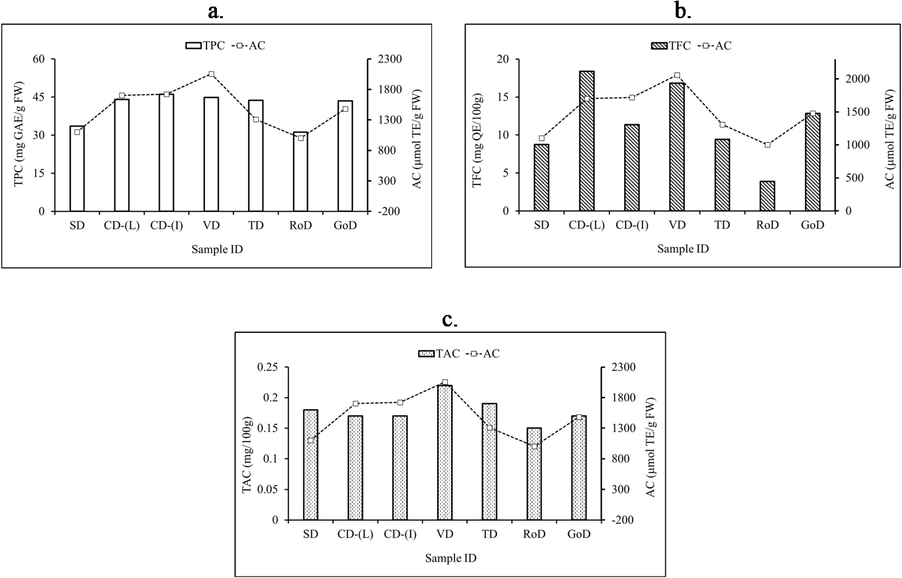
Bioactive compound (TPC (a), TFC (b), TAC (c)) and corresponding AC of dried mango powder by different methods.
3.4 Identification and quantification of phenolic compounds
Individual phenolic compounds in fresh mango and mango powder were identified and quantified using HPLC. HPLC analysis has the advantage over total phenolic content determined by the Folin Ciocalteu method, as it provides more precise information of individual compounds. A class of phytochemicals common in the plant kingdom are polyphenols. In general, these molecules are involved in shielding plants from ultraviolet radiation, pathogenic aggression, and reactive oxygen species (ROS). Phenolic acids are plant secondary metabolites that are part of the human diet and are valuable because of their biological ability and health benefits. Flavonoids are also the most common polyphenols in plants (Maldonado-Celis et al., 2019). Total 16 polyphenol compounds belonging to phenolic acid and flavonoids were identified in fresh and dried samples and summarized in Table 3. Identification was based on chromatographic peak RI and similarity index (SI) greater than 90 percent for all 16 compounds. Ten derivatives of phenolic acid and six derivatives of flavonoids were quantified. FM = Fresh Mango, SD = Spray Drying, CD(L) = Cabinet Drying (Laboratory/small scale) CD(I) = Cabinet Drying (Industry/large scale), VD = Vacuum Drying, TD = Tunnel Drying, RoD = Rotary Oven Drying, GoD = Gas Oven Drying. 1Results are expressed in dry weight basis as means ± standard deviations of three replicates. Different superscript letters in the same row within each fraction indicate significant difference between mean values (One-way ANOVA followed by Tukey multiple comparison post hoc test, p < 0.05); nd = not detected.
Compounds
FM
Effect of various drying methods
SD
CD (L)
CD (I)
VD
TD
RoD
GoD
Phenolic acid
Gallic acid
2.86 ± 0.04
2.88 ± 0.06b
2.92 ± 0.03b
2.70 ± 0.07c
2.94 ± 0.02b
3.68 ± 0.05a
2.84 ± 0.03b
2.89 ± 0.04b
3,4 dihyrdoxy benzoic acid
nd
nd
nd
nd
nd
nd
nd
nd
Rosmarinic acid
5.23 ± 0.04
5.23 ± 0.04a
1.02 ± 0.05d
1.27 ± 0.04c
1.34 ± 0.03c
1.02 ± 0.02d
1.22 ± 0.05c
3.04 ± 0.06b
Catechol
2.92 ± 0.07
2.95 ± 0.11a
2.71 ± 0.08b
2.14 ± 0.12d
2.82 ± 0.02ab
2.42 ± 0.08c
1.43 ± 0.05e
2.76 ± 0.08ab
Trans-Ferulic acid
2.38 ± 0.06
2.38 ± 0.06d
4.51 ± 0.07a
3.36 ± 0.01c
1.02 ± 0.06e
1.11 ± 0.04e
3.56 ± 0.06b
2.42 ± 0.05d
Caffeic acid
12.73 ± 0.10
12.72 ± 0.09f
18.49 ± 0.11a
14.28 ± 0.08d
16.43 ± 0.07c
14.02 ± 0.06e
8.24 ± 0.05 g
18.03 ± 0.09b
Vanillic acid
1.52 ± 0.03
1.52 ± 0.03ab
1.55 ± 0.06a
1.41 ± 0.03b
1.45 ± 0.05ab
0.96 ± 0.01c
0.84 ± 0.02c
1.46 ± 0.08ab
Syringic acid
0.72 ± 0.09
0.72 ± 0.09a
nd
0.38 ± 0.05b
0.35 ± 0.05b
0.46 ± 0.05b
nd
nd
Trans-Cinnamic acid
nd
nd
0.44 ± 0.02b
nd
0.66 ± 0.01a
nd
nd
nd
p-Coumaric acid
3.52 ± 0.04
3.52 ± 0.04 g
11.76 ± 0.09b
12.55 ± 0.08a
7.55 ± 0.06e
8.14 ± 0.06d
5.53 ± 0.06f
10.76 ± 0.04c
Flavonoids
Rutin hydrate
2.25 ± 0.02
2.25 ± 0.02ab
2.27 ± 0.06a
2.22 ± 0.06ab
2.10 ± 0.05bc
1.93 ± 0.05d
1.61 ± 0.05e
2.04 ± 0.05 cd
(-) Epicatechin
nd
nd
1.55 ± 0.07b
1.64 ± 0.06b
2.18 ± 0.03a
1.12 ± 0.08c
nd
1.52 ± 0.07b
Myricetin
1.12 ± 0.05
1.12 ± 0.05c
1.32 ± 0.06b
1.71 ± 0.04a
1.35 ± 0.02b
0.73 ± 0.01e
0.32 ± 0.02f
0.92 ± 0.03d
Quercetin
2.85 ± 0.05
2.85 ± 0.05d
4.24 ± 0.07b
3.60 ± 0.05c
4.71 ± 0.03a
2.27 ± 0.03e
1.51 ± 0.04f
3.56 ± 0.08c
Catechin hydrate
0.95 ± 0.04
0.96 ± 0.08f
5.78 ± 0.09a
4.31 ± 0.08c
4.07 ± 0.05d
2.08 ± 0.07e
0.20 ± 0.01 g
4.63 ± 0.07b
Kaempferol
nd
nd
0.72 ± 0.03b
0.51 ± 0.01c
0.83 ± 0.05a
nd
nd
nd
Based on the experimental results of all the phenolic acid (except 3,4 dihydroxy benzoic acid and trans-Cinnamic acid) and flavonoids (except (-) epicatechin and kaempferol) derivatives present in fresh mango. In fresh mango pulp, the predominant phenolic acid derivatives were caffeic acid (12.73 mg/100 g DM), and rosmarinic acid (5.23 mg/100 g DM), followed by p-coumaric acid (3.52 mg/100 g DM), catechol (2.92 mg/100 g DM), gallic acid (2.86 mg/100 g DM), trans-ferulic acid (2.38 mg/100 g DM), and vanillic acid (1.52 mg/100 g DM). Furthermore, the sample contains a trace amount of syringic acid (0.72 mg/100 g DM). Likewise, the major flavonoids derivatives were quercetin (2.85 mg/100 g DM), and rutin hydrate (2.25 mg/100 g DM), subsequently contains a trace amount of myricetin (1.12 mg/100 g DM) and catechin hydrate (0.95 mg/100 g DM). It was discovered through previous research that the key polyphenols in mango leaves, peels, and mango by-products have been shown to be xanthone mangiferin, flavonoids (quercetin and kaempferol), and phenolic acids (gallic, ferulic, coumaric, and caffeic acids) (Hernández-Maldonado et al., 2019; Herrera-Cazares et al., 2017). The polyphenolic constituents of mango peel included mangiferin, quercetin, rhamnetin, ellagic acid, kaempferol, and their related conjugates (Berardini et al., 2005a). Ordoñez-Díaz et al. (2020) found that the major polyphenols in mango pulp were hydroxybenzoic acid-hexoside (isomer 2) and two isomers of monogalloyl glucoside, afterward phenolic acid 4-hydroxy-3-methoxybenzaldehyde (vanillic acid) and small quantities of other polyphenols (pyrogallol, gallic acid, gallic acid hexoside, 3-O-methylgallic acid, 4-O-methylgallic acid, hydroxybenzoic acid hexoside 1, syringic acid hexoside, methyl gallate, methyl digallate ester (isomers 1 and 2), two isomers of ferulic acid hexoside, three isomers of sinapic acid hexoside and two caffeoyl-hexosides), moreover, trace amounts of epicagallocatechin, epigallocatechin gallate, epicatechin gallate, eriodyctiol and two of its hexoside derivatives, hesperetin, quercetin, isorhamnetin and mangiferin. Mango seed kernels have been found to be high in polyphenols with significant antioxidative activity, in addition to the pulp and peel. Abdalla et al. (2007) measured and discovered several polyphenolic chemicals in mango seed kernels, including tannin, gallic acid, coumarin, caffeic acid, mangiferin, ferulic acid, and cinnamic acid. But unfortunately, when the mango fruit is processed and consumed, the seeds are thrown away as waste. It is obvious that the phytochemical composition of mango pulp is extremely complex; therefore, it is difficult to compare their amounts with the literature because the composition is affected by factors such as cultivar, ripening stage, storage conditions, and therefore the portion of the fruit examined, one among the factors with the greatest impact on bioactive compound accumulation (Ordoñez-Díaz et al., 2020).
The effect of various drying methods (spray dried (SD), cabinet dried (laboratory/small scale) (CD (L)), cabinet dried (industrial/large scale) (CD (I)), vacuum dried (VD), tunnel dried (TD), Rotary oven dried (RoD), and Gas Oven dried (GoD)) on phenolic acid and flavonoids compounds were quantified and tabulated in Table 3 and retention factor of individuals phenolic compounds in dried mango powder were shown in Fig. 3. Gallic acid, rosmarinic acid, catechol, trans-ferulic acid, caffeic acid, vanillic acid, syringic acid, trans-cinnamic acid, p-coumaric acid, rutin hydrate, (-) epicatechin, myricetin, quercetin, catechin hydrate, and kaempferol content was found in dried mango powder ranges from (2.7–3.68 mg/100 g DW), (1.02–5.23 mg/100 g DW), (1.43–2.95 mg/100 g DW), (1.02–4.51 mg/100 g DW), (8.24–18.49 mg/100 g DW), (0.84–1.55 mg/100 g DW), (0.35–0.72 mg/100 g DW), (0.44–0.66 mg/100 g DW), (3.52–12.55 mg/100 g DW), (1.61–2.27 mg/100 g DW), (1.12–2.18 mg/100 g DW), (0.32–1.71 mg/100 g DW), (1.51–4.71 mg/100 g DW), (0.20–5.78 mg/100 g DW), (0.51–0.83 mg/100 g DW) respectively (Table 3). The value of individuals phenolics compounds in mango powder was significantly varied from different methods. Therefore, it can be concluded that each drying method has influenced the composition of phenolics in dried mango powder in a different way.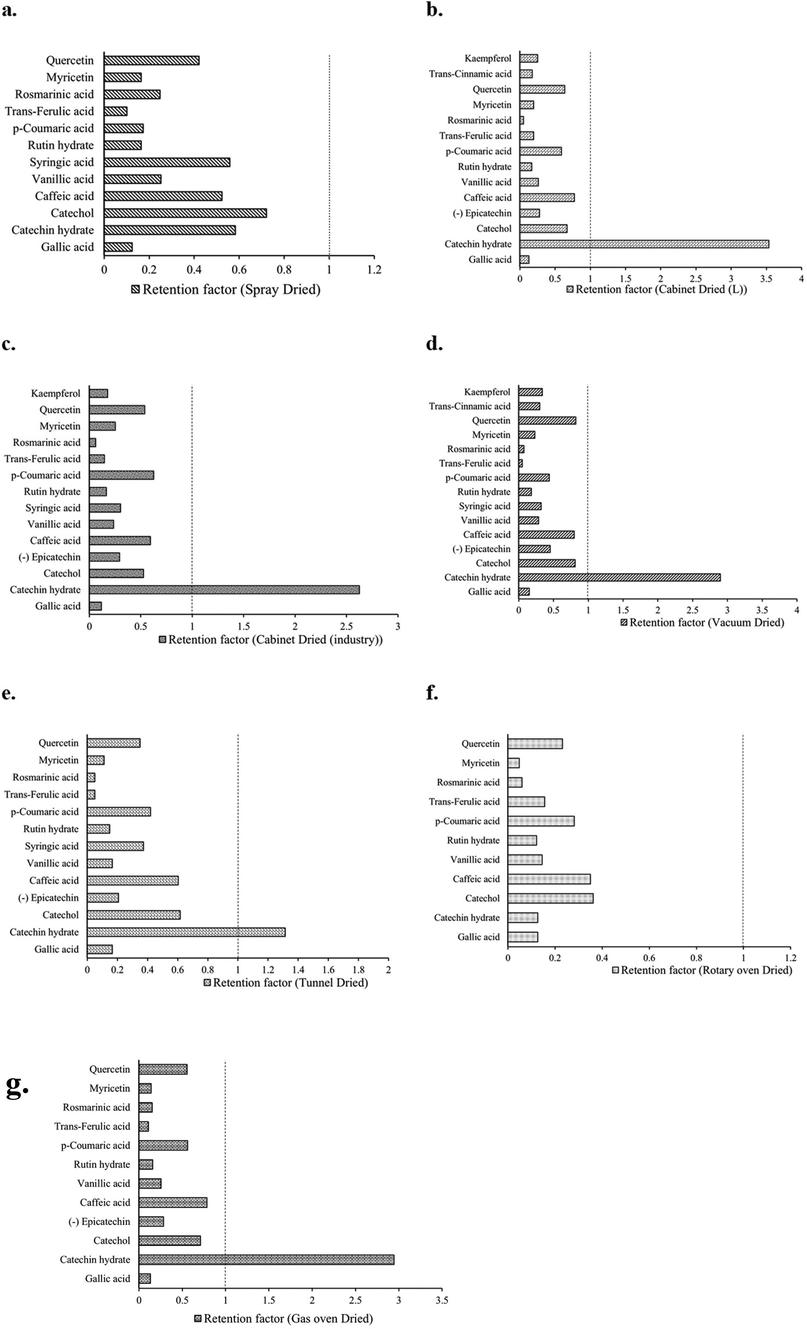
Retention factor of individuals phenolic compounds (phenolic acid and flavonoids) in Spray dried (a), cabinet dried (laboratory/small scale) (b), cabinet dried (industrial/large scale) (c), vacuum dried (d), tunnel dried (e), Rotary oven dried (f), and Gas Oven dried (g) mango powder.
The highest gallic acid content was identified in TD mango powder, where rosmarinic acid, catechol, vanillic acid, syringic acid, and rutin hydrate were observed higher in SD powder. Furthermore, trans-ferulic acid, caffeic acid, vanillic acid, p-coumaric acid, rutin hydrate, myricetin, and catechin hydrate were detected higher in CD powder. trans-Cinnamic acid and kaempferol were only noticed in CD and VD powder. This is the first study that we are aware of that looks into the impact of the seven most prevalent drying processes on phenolic acid and flavonoids derivatives in mango powder.
3.5 Drying methods effect on the retention of individual phenolic compounds (phenolic acid and flavonoids derivatives) in mango powder
Retention factors (RF) of individual phenolic compounds (phenolic acid and flavonoids derivatives) ranged from 0.10 to 0.72 for SD powder; from 0.05 to 3.54 for CD(L) powder; from 0.06 to 2.62 for CD(I) powder; from 0.07 to 2.90 for VD powder; from 0.05 to 1.31 for TD powder; from 0.05 to 0.36 for RoD powder; and from 0.11 to 2.95 for GoD powder (Fig. 3). Flavonoids had higher RFs (0.59 on average) than phenolic acids (on average 0.33). Phenolic compounds display an RF lower than 1.0 in all samples, suggesting loss after drying, possibly due to oxidation (Nunes et al., 2016). Similar findings were reported by Nunes et al. (2016) for freeze dried and oven dried guava powder. The RF of catechin hydrate (flavonoids) was higher than 1.0, suggesting a rise in its contents after drying, which may have been caused by isomerization and hydrolysis interconversion between phenolic compounds and by its formation from catechin conjugates (Que et al., 2008; Rothwell et al., 2015; Nunes et al., 2016). To the best of our understanding, the retention of phenolic components in mango powder associated with drying methods are rare. Nunes et al. (2016) reported the effect of freeze and oven drying methods on the RF of individual phenolic compounds (soluble plus insoluble forms) in guava powder.
4 Conclusion
In this study, the phenolic property of mango powder was significantly affected by different drying method applied. Total polyphenol, total anthocyanin, total flavonoid content and antioxidant capacity measured will give consumer clear idea about important source of polyphenols. Individual phenolic compounds in fresh mango and mango powder dried by various methods were identified and quantified using HPLC. Among the 16 phenolics, caffeic acid was predominant in mango powder. Flavonoids had higher retention factors (RF) than phenolic acids. Due to oxidation, phenolic compounds display lower RF. The catechin hydrate (flavonoids) was increased in mango powder may have been caused by isomerization and hydrolysis interconversion between phenolic compounds and by its formation from catechin conjugates. The findings indicate that the most important contributors to the antioxidant capacity in the mango powder were phenolic compounds (polyphenol, flavonoids and anthocyanin). While different drying process resulted in a decrease in antioxidant capacity, values were still seen for mango powder. Finally, it can be concluded that both cabinet drying and vacuum drying are the most effective and potential drying techniques for bioactive enriched mango powder production. However, cabinet drying would be the best choice for the production mango powder by taking into account both economic viability and phenolic compound quality and that could be applied to baking and dairy products to boost up their functional value while adding the desirable mango flavor.
Acknowledgements
The Bangabandhu Science and Technology Fellowship provided funding for the first author's PhD program, for which she is extremely grateful. The University Grants Commission of Bangladesh provided funds for this study.
Declaration of Competing Interest
The authors declare that they have no known competing financial interests or personal relationships that could have appeared to influence the work reported in this paper.
References
- Egyptian mango by-product 1. Compositional quality of mango seed kernel. Food Chem.. 2007;103:1134-1140.
- [CrossRef] [Google Scholar]
- Moisture migration and bulk nutrients interaction in a drying food systems: a review. Food Nutr. Sci.. 2014;58:692-714.
- [Google Scholar]
- Bioactive compounds and antioxidant potential of mango peel extract. Food Chem.. 2007;105:982-988.
- [CrossRef] [Google Scholar]
- Physicochemical properties of mango (Amropali cultivar) powder and its reconstituted product as affected by drying methods. Int. J. Food Prop.. 2020;23:2201-2216.
- [CrossRef] [Google Scholar]
- Almeida, M.M.B., de Sousa, P.H.M., Arriaga, Â.M.C., do Prado, G.M., Magalhães, C.E. de C., Maia, G.A. de Lemos, T.L.G., 2011. Bioactive compounds and antioxidant activity of fresh exotic fruits from northeastern Brazil. Food Res. Int. 44, 2155–2159. https://doi.org/10.1016/j.foodres.2011.03.051.
- Amos, W.A., 1999. Report on biomass drying technology National Renewable Energy Laboratory (NREL/TP-570-25885), Golden, CO (US). https://doi.org/10.2172/9548.
- In vitro and in vivo effects of three different Mitragyna speciosa Korth leaf extracts on phase II drug metabolizing enzymes—glutathione transferases (GSTs) Molecules. 2010;15:432-441.
- [CrossRef] [Google Scholar]
- Total phenolic content and primary antioxidant activity of methanolic and ethanolic extracts of aromatic plants’ leaves. Int. Food Res. J.. 2010;17:1077-1084.
- [Google Scholar]
- Urban agriculture and food security: a critique based on an assessment of urban land constraints. Glob. Food Sec.. 2015;4:8-15.
- [CrossRef] [Google Scholar]
- BBS, 2017. Yearbook of Agricultural Statistics of Bangladesh, 2017. Bangladesh Bureau of Statistics, Ministry of Planning, Bangladesh., p. 157-158. http://bbs.portal.gov.bd/sites/default/files/files/bbs.portal.gov.bd/page/1b1eb817_9325_4354_a756_3d18412203e2/Yearbook-2017-Final-05-05-2018.pdf.
- Utilization of mango peels as a source of pectin and polyphenolics. Innov. Food Sci. Emerg. Technol.. 2005;6:442-452.
- [CrossRef] [Google Scholar]
- Screening of mango (Mangifera indica L.) cultivars for their contents of flavonol Oand xanthone C-glycosides, anthocyanins, and pectin. J. Agric. Food Chem.. 2005;53:1563-1570.
- [CrossRef] [Google Scholar]
- Modeling and experimental investigation of the morphology of spray dryed particles. Chem. Eng. Technol.. 2001;24:1113-1116.
- [CrossRef] [Google Scholar]
- A review of techniques for drying food products in vacuum drying plants and methods for quality control of dried samples (Technical note) Revista Espacios. 2017;38 (N° 52):35-43.
- [Google Scholar]
- Estimation of total flavonoid content in propolis by two complementary colorimetric methods. J. Food Drug Anal.. 2002;10:178-182.
- [CrossRef] [Google Scholar]
- Using drying treatments to stabilise mango peel and seed: effect on antioxidant activity. LWT-Food Sci. Technol.. 2012;45:261-268.
- [CrossRef] [Google Scholar]
- Performance of a solar tunnel dryer with microcomputer control. Solar Ener.. 1997;59:151-154.
- [CrossRef] [Google Scholar]
- A Guide to Postharvest Handling of Fruits and Vegetables. Mymensingh: Department of Horticulture, Bangladesh Agricultural University; 2010. p. :117.
- [Google Scholar]
- In vitro gastrointestinal digestion and colonic fermentation of high dietary fiber and antioxidant-rich mango (Mangifera indica L.) “Ataulfo”-based fruit bars. Nutrients. 2019;11:1564.
- [CrossRef] [Google Scholar]
- Hutchinson, J.E., 1930. Drying Cabinet, United States Patent: US1752797A.
- Mango-bagasse functional-confectionery: vehicle for enhancing bioaccessibility and permeability of phenolic compounds. Food Funct.. 2017;8:3906-3916.
- [CrossRef] [Google Scholar]
- Distribution of conjugated and free phenols in fruits: antioxidant activity and cultivar variations. J. Agric. Food Chem.. 2002;50:6301-6306.
- [CrossRef] [Google Scholar]
- Total antioxidant activity and phenolic content in selected vegetables. Food Chem.. 2004;87:581-586.
- [CrossRef] [Google Scholar]
- A vacuum drying model for mango pulp. Drying Technol.. 2003;21:1215-1234.
- [CrossRef] [Google Scholar]
- Comparison of polyphenol content and antioxidant capacity of colored potato tubers, pomegranate and blueberries. Journal of Food Processing and Technology. 2014;5(8):1000358.
- [Google Scholar]
- Surface composition of industrial spray-dried milk powders. 2. Effects of spray drying conditions on the surface composition. J. Food Eng.. 2009;94:169-181.
- [CrossRef] [Google Scholar]
- Rotary Drying. In: Handbook of Industrial Drying (3rd). Boca Raton: CRC Press; 2006. p. :176-197.
- [CrossRef] [Google Scholar]
- Application of various chemical methods to determine antioxidant activity in fruit pulp. Food Sci. Technol.. 2005;25:726-732.
- [CrossRef] [Google Scholar]
- Total antioxidant activity and fiber content of select Florida-grown tropical fruits. J. Agric. Food Chem.. 2006;54:7355-7363.
- [CrossRef] [Google Scholar]
- Chemical composition of mango (Mangifera indica L.) fruit: Nutritional and phytochemical compounds. Front. Plant Sci.. 2019;10:1073.
- [CrossRef] [Google Scholar]
- Major mango polyphenols and their potential significance to human health. Compreh. Rev. Food Sci. Food Safety. 2008;7:309-319.
- [CrossRef] [Google Scholar]
- Assessment of nutritional, physicochemical, antioxidant, structural and rheological properties of spray dried tamarind pulp powder. J. Food Meas. Charac.. 2017;11:746-757.
- [Google Scholar]
- Effect of drying method on volatile compounds, phenolic profile and antioxidant capacity of guava powders. Food Chem.. 2016;197:881-890.
- [CrossRef] [Google Scholar]
- World food security: the role of postharvest technology. Food technology (Chicago). 1998;52(1):64-69.
- [Google Scholar]
- In vitro gastrointestinal digestion and colonic catabolism of mango (Mangifera indica L.) Pulp Polyphenols. Foods. 2020;9:1836.
- [CrossRef] [Google Scholar]
- Production of pure vegetable juice powders of full biological value. Fruit Process. 1995;3:55-60.
- [Google Scholar]
- Changes in carotenoids during processing and storage of pumpkin puree. Food Chem.. 2011;128:195-202.
- [CrossRef] [Google Scholar]
- Comparison of hot air-drying and freeze drying on the physicochemical properties and antioxidant activities of pumpkin (Cucurbita moschata Duch.) flours. Int. J. Food Sci. Technol.. 2008;43:1195-1201.
- [CrossRef] [Google Scholar]
- Antioxidant activity of fresh and dry fruits commonly consumed in India. Food Res. Int.. 2010;43:285-288.
- [CrossRef] [Google Scholar]
- Phenolic compounds and antioxidant capacity of Brazilian mango (Mangifera indica L.) varieties. Food chem.. 2008;110:620-626.
- [CrossRef] [Google Scholar]
- Rodriguez-Amaya, D.B., 2001. A Guide to Carotenoid Analysis in Foods. ILSI Human Nutrition Institute. One Thomas Circle, NW, Washington DC, 20005-5802, 64.
- Effects of food processing on polyphenol contents: a systematic analysis using Phenol-Explorer data. Mole. Nut. Food Res.. 2015;59:160-170.
- [CrossRef] [Google Scholar]
- Selim, K.A., Khalil, K.E., Abdel-Bary, M.S., Abdel-Azeim, N.A., 2008. Extraction, encapsulation and utilization of red pigments from roselle (Hibiscus sabdariffa L.) as natural food colourants. In Alexandria J Food Sci. Technl. Conf, 7-20.
- Antioxidant activities and polyphenolic contents of fifteen selected plant species from the Amazonian region. Food Chem.. 2007;101:1012-1018.
- [CrossRef] [Google Scholar]
- Comparison of ABTS, DPPH, FRAP, and ORAC assays for estimating antioxidant activity from guava fruit extracts. J. Food Comp. Anal.. 2006;19:669-675.
- [CrossRef] [Google Scholar]
- Antioxidant capacity and total phenolic contents in hydrophilic extracts of selected Bangladeshi medicinal plants. Asian Pac. J. Tropi. Med.. 2014;7:568-573.
- [CrossRef] [Google Scholar]
- Antioxidant activity and total phenolics in selected fruits, vegetables, and grain products. J. Agri. Food Chem.. 1998;46:4113-4117.
- [CrossRef] [Google Scholar]


