

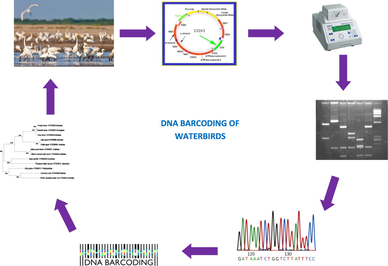
DNA barcoding of waterbirds: A novel technique in environmental conservation biology
⁎Corresponding authors at: Department of Zoology, Government College for Women (Autonomous), Kumbakonam 612 001, Tamil Nadu, India. mushahid@ksu.edu.sa (Shahid Mahboob), drgovind1979@gmail.com (Marimuthu Govindarajan)
-
Received: ,
Accepted: ,
This article was originally published by Elsevier and was migrated to Scientific Scholar after the change of Publisher.
Peer review under responsibility of King Saud University.
Abstract
Abstract
Cytochrome c oxidase I (COI) is one of the mitochondrial genes, an excellent marker used for the DNA barcoding of various organisms. The COI was isolated from twelve different species of waterbirds using the Gene Elute DNA miniprep Kit. The relationship among the waterbirds was assessed by making a phylogenetic tree with the software MEGA-X. The phylogenetic tree's dendrogram showed two main branches in which seven species of water birds aligned one group with four subgroups and the remaining five species aligned with two subgroups based on their similar COI sequences. The Little egret showed 96% similarity with the Cattle egret, Purple heron and Oriental Darter produced 94% similarity with the Grey heron, pond heron shared 90% similarity with the Black-crowned night heron, Asian openbill shared 89% with Pheasant-tailed Jacana and the Common coot 94% similarity with White-breasted waterhen. The pond heron and the Black-crowned night heron showed zero % pairwise distance, but the Cattle egret, Little egret, Oriental Darter, Purple heron and Grey heron showed < 0.29%. However, the other seven species of water birds showed > 12% of the pairwise distance. Twenty-one conserved haplotypes have been shown in their COI sequences based on the multiple sequences alignment. DNA barcoding identifies the species with their genetic property rather than based on their ecology and behvaviour.
Keywords
Waterbirds
DNA barcoding- mt DNA
Phylogenetics
Cytochrome c oxidase I
Conservation

1 Introduction
Generally, the taxonomists identify the avian species based on their field characters and behavior, in which several masked and similar morphological species have shown distinct species, based on the DNA barcoding techniques (Hebert et al., 2004). Nevertheless, millions of species are yet to be described and identified because expertise in avian taxonomy amongst zoologists is dwindling globally. DNA barcoding is a practical and modern tool for taxonomists who are endowed with preparing inventory and management recommendations of the vast and altering earth biodiversity.
Indeed Hebert et al. (2004) published an article on the barcoding of birds in Central American birds using the COI gene. He has made a breakthrough in taxonomy, wherein mitochondrial DNA, rather than nuclear DNA, formed another most attractive and remarkable protocol in the molecular taxonomy of species by using a novel gene called Cytochrome c Oxidase I (COI). Globally, after Hebert’s publication in 2004, several studies have been made and documented the species diversity based on COI, for example, Eurasian birds (Zink et al., 2008), Korean birds (Yoo et al., 2006), Kingfishers (Moyle et al., 2007), Palearctic birds (Kerr et al., 2009a), Scandinavian birds (Johnsen et al., 2010), Marine biodiversity (Radulovici et al., 2010), Continental patterns of avian diversification (Lijtmaer et al., 2011) House sparrow (Schrey et al., 2011), Avian evolutionary studies (Aliabadian et al., 2013), feather mite studies (Doña et al., 2015), Neotropical birds (Chaves et al., 2015) and Migratory birds (Bilgin et al., 2016).
However, certain species have been identified by using COI, for example, mosquitoes (Kumar et al., 2007), Honey bees (Baskaran, 2012), Insects (Banerjee et al., 2015), Insects- thrips (Tyagi et al., 2017), Gobid fishes (Laskar et al., 2017), Turtles (Kundu et al., 2016), Wild Jungle Fowl (Gallus gallus) (Ghosh et al., 2013a; Ghosh et al., 2013b) but no studies as much as carried out on avian species particularly water birds by using DNA barcoding. Therefore, the present study intended to analyze COI gene analysis for the DNA barcoding of water birds and understand their phylogenetic relationships based on their genetic background.
2 Methods
2.1 Collection of bird tissues
The 5–10 g of tissue samples from the twelve species of water birds (dead carcasses) were collected during fieldwork from five different wetlands (Fig. 1). The Little egret (Egretta garzetta) and Phesant-tailed Jacana (Hydrophasianus chirurgus) were collected from the Veeranam lake, (11°19′17.8″N 79°32′36.5″E) Cuddalore District; the Cattle egret (Bulbulcus ibis) and Grey heron (Ardea cinersea) were collected from the Vakkaramari lake (11°21′45.4″N 79°39′50.0″E), Cuddalore District; Pond heron (Ardeola grayii), Oriental darter (Anhinga melanogaster) and Purple heron (Ardea purpurea) were collected from the Solagampatti Village pond (10°46′45.8″N 78°51′36.7″E), Thanjavur District; the Common coot (Fulica atra) and Asian openbill (Anastomus oscitans) were collected from the Perunthottam lake (11°11′31.7″N 79°49′14.1″E), Nagapattinam District; the Little grebe (Tachybaptus ruficollis), White-breasted waterhen (Amaurornis phoenicurus) and the Black-crowned night heron (Nycticorax nycticorax) were collected from the Periya Kulam lake (10°47′44.8″N 78°46′36.0″E), Thiruvanmiyur, Trichirappalli District, Tamil Nadu, India.
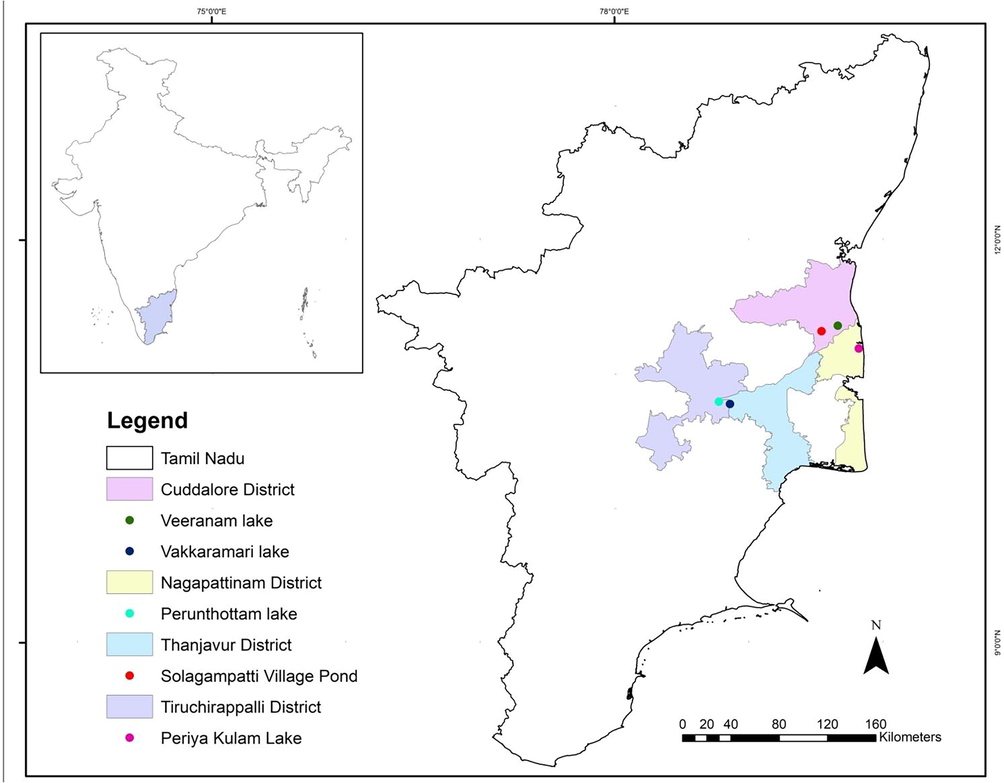
- Map of the study areas.
2.2 Extraction of DNA and PCR amplification for COI gene
Extraction of COI gene, a small amount of bird tissues by using a kit is known as the Gene Elute DNA miniprep Kit, and the extraction of DNA has achieved it with the guidelines described by the Manufacturer instructions (Hebert et al., 2004). The tissue samples were transferred into 10 µl of distilled water for further analysis. In the isolation of COI from the tissues, the amplification was done at the 749-bp region near the 59 termini using the following forward and reverse primers (Forward-TTCTCCAACCACAAAGACATTGGCAC and Reverse-ACGTGGGAGATAATTCCAAATCCTG). Subsequently, 50 µl of PCR reaction was prepared with the combination of 40 µl of double-distilled water, 1.0 µl of Taq polymerase, 2.5 µl of MgCl2, 4.5 µl of 10X PCR buffer, 0.5 µl of each primer (0.1 mM), 0.25 µl of each dNTP (0.05 mM), and 0.5–3.0 µl of DNA. The process of amplification was carried out in 1 min at 94 °C and followed by 5 cycles of 1 min at 94 °C, 1.5 min at 45 °C, and 1.5 min at 72 °C, and in turn by 30 cycles of 1 min at 4 °C, 1.5 min at 51 °C, and 1.5 min at 72 °C, and finally 5 min at 72 °C. The results of the PCR were visualized by using 1.2% Agarose gel electrophoresis. The entire PCR reactions were produced a single, circa 750-bp product, and it was sequenced, and the sequencing process was carried out by using ABI 377 sequencer. The sequences of 12 waterbird species were deposited into the NCBI –GenBank (Table 3). Nevertheless, the COI sequences of 12 species of water birds recovered without any errors and remarkably provided with the non-appearance of nuclear pseudogene amplification (Pereira and Baker, 2004).
2.3 Phylogenetic analysis of mtDNA-COI
The Clustal Omega and Clustal W/X were used to visualize the multiple sequence alignment among the COI of 12 waterbird species. The phylogenetic tree (maximum parsimony) and pairwise distance were assessed by using MEGA-X to understand the relationships of COI sequences of water birds as described by Nei and Kumar (2000) and Kumar et al. (2018).
3 Results
In the present study, twelve different water birds were used to compare evolutionary relationships using their COI regions. The dendrogram's trunk was dichotomously branched into two main branches in which one branch constituted seven species and formed four major groups, and the second branch was organized with five species and formed two subgroups with their similar sequences. The Little egret (Egretta garzetta) showed 96% similarity with the Cattle egret (Bubulcus ibis), the Purple heron (Ardea purpurea), Oriental Darter (Anhinga melanogaster) with Grey heron (Ardea cinerea) produced 94% similarity. The pond heron (Ardeola grayii) shared 90% similarity with the Black-crowned night heron (Nycticorax nycticorax), the Asian openbill (Anastomus oscitans) with Pheasant-tailed Jacana (Hydrophasianus chirurgus) shared 89% similarity and the Common coot (Fulica atra) and the White-breasted waterhen (Amaurornis phoenicurus) showed 94% similarity. The dendrogram results clearly showed that these species of water birds have a close relationship and it seems that they are a homogeneous group with the lower divergence of their mtDNA-COI sequences. However, the Little grebe (Tachybaptus ruficollis) showed a different clade with a more significant divergence than the other water birds studied (Fig. 2).
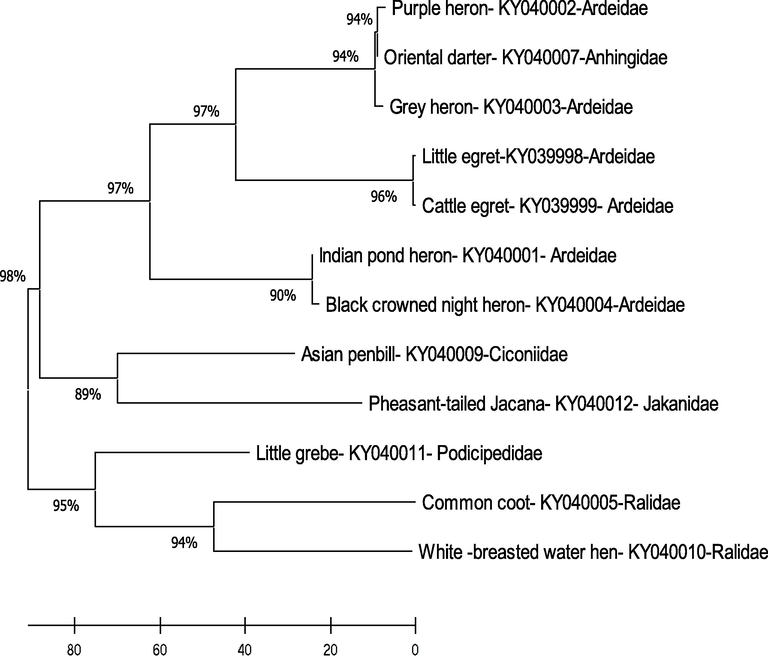
- The Maximum parsimony model of phylogenetic relationships of water birds on the basis of their mtDNA-COI gene.
The pairwise distance between the pond heron and the Black-crowned night heron was zero percent (0%) the Cattle egret and Little egret showed 0.14%. The Oriental Darter showed 0.29 and 0.14% distance with the Purple heron and Grey heron, respectively. However, the Grey and Purple herons showed 0.29% of the pairwise distance. The other species of water birds showed > 12% of pairwise distance (Table 1).
| Name of the water birds | 1 | 2 | 3 | 4 | 5 | 6 | 7 | 8 | 9 | 10 | 11 | 10 |
|---|---|---|---|---|---|---|---|---|---|---|---|---|
| Little egret | 0.00 | |||||||||||
| Little grebe | 19.70 | |||||||||||
| Cattle egret | 0.14 | 19.32 | ||||||||||
| Indian pond heron | 15.52 | 17.23 | 15.52 | |||||||||
| Purple heron | 12.61 | 16.32 | 12.61 | 12.80 | ||||||||
| Grey heron | 12.28 | 16.80 | 12.15 | 13.13 | 0.29 | |||||||
| Black crowned night heron | 15.62 | 17.36 | 15.54 | 0.00 | 13.37 | 13.97 | ||||||
| Common coot | 21.23 | 18.19 | 21.23 | 22.35 | 21.56 | 21.08 | 21.49 | |||||
| Oriental darter | 12.11 | 16.32 | 12.11 | 13.00 | 0.29 | 0.14 | 13.33 | 20.83 | ||||
| Asian Openbill | 17.86 | 15.09 | 17.86 | 19.57 | 17.56 | 17.13 | 18.92 | 18.85 | ||||
| White breasted waterhen | 20.43 | 17.94 | 20.14 | 21.22 | 20.70 | 21.06 | 21.18 | 16.28 | 20.00 | 19.67 | ||
| Pheasant tailed Jacana | 22.64 | 19.13 | 22.70 | 22.13 | 22.17 | 22.17 | 22.03 | 22.61 | 22.17 | 18.87 | 23.78 | 0.00 |
1. Little egret; 2. Little grebe; 3. Cattle egret; 4. Indian Pond heron; 5. Purple heron; 6. Grey heron; 7. Black crowned night heron; 8. Common coot; 9. Oriental Darter; 10. Asian openbill; 11. White Breasted Water hen; 12. Pheasant Tailed Jacana.
*Bold letter indicate lower distance between the species.
The multiple sequences alignment showed 21 conserved haplotypes of sequences among the mtDNA-COI sequences of waterbirds in which the ATAAT showed two frequencies and the other haplotypes sequences were present single occurrence among the sequences analyzed from the 12 species of water birds.
4 Discussion
Identifying birds by using DNA barcoding is one of the essential tools for modern taxonomy and conservation science. Nevertheless, Darwin's theory's principles and views are outstanding contributions to living organisms' evolutionary relationships. Nonetheless, the modern taxonomy describes independently evolving traits or lineages through nucleic acids (Hey et al., 2003; Mace, 2004).
The current study's overall results revealed that all other species showed a lower divergence of their COI gene except Little grebe. The high similarity of the particular mtDNA-COI sequences of species could be due to their genetic trait and their evolutionary process can drive it. Moreover, the current study showed that the genetic distance was 0% between the Black-crowned night heron and pond heron, 0.14% between Little egret and cattle egret, 0.29% between the Grey heron and the Purple heron, 0.29 and the Oriental darter showed 0.14% of distance for the Purple heron and the Grey heron respectively when compared to the other water birds studied. The other waterbird species showed > 12% concerning their pairwise distance (Table 2).
| S. No. | Name of the water birds | Scientific Name | Order | Family | IUCN Categories |
|---|---|---|---|---|---|
| 1. | Little egret | Egretta garzetta | Pelicaniformes | Ardeidae | LC |
| 2 | Cattle egret | Bubulcus ibis | Pelicaniformes | Ardeidae | LC |
| 3 | Indian pond heron | Ardeola grayii | Pelicaniformes | Ardeidae | LC |
| 4 | Purple heron | Ardea purpurea | Pelicaniformes | Ardeidae | LC |
| 5 | Grey heron | Ardea cinerea | Pelicaniformes | Ardeidae | LC |
| 6 | Black crowned night heron | Nycticorax nycticorax | Pelicaniformes | Ardeidae | LC |
| 7 | Common coot | Fulica atra | Gruiiformes | Ralidae | LC |
| 8 | White breasted waterhen | Amaurornis phoenicurus | Gruiiformes | Ralidae | LC |
| 9 | Oriental darter | Anhinga melanogaster | Suliformes | Anhingidae | NT |
| 10 | Asian openbill | Anastomus oscitans | Ciconiiformes | Ciconiidae | LC |
| 11 | Pheasant tailed jacana | Hydrophasianus chirurgus | Charadriiformes | Jakanidae | LC |
| 12 | Little grebe | Tachybaptus ruficollis | Podicipediformes | Podicipedidae | LC |
| S. No. | Name of the weaterbirds with ID | Gen Bank Accession Number (NCBI) |
|---|---|---|
| 1 | Little Egret (Egretta garzetta) LEAVC | KY039998 |
| 2 | Cattle egret (Bulbulcus ibis) CEAVC1 | KY039999 |
| 3 | Indian Pond Heron (Ardeola grayii) IPHAVC | KY040001 |
| 4 | Purple Heron (Ardea purpurea) PHAVC | KY040002 |
| 5 | Grey heron (Ardea cinerea) GHAVC | KY040003 |
| 6 | Black crowned night heron (Nycticorax nycticorax) BCNHAVC | KY040004 |
| 7 | Common coot (Fulica atra) CCAVC1 | KY040005 |
| 8 | Indian Darter (Anhinga melanogaster) DAVC | KY040007 |
| 9 | Asian openbill stork (Anastomus oscitans) AOBSAVC1 | KY040008 |
| 10 | White breasted waterhen (Amaurornis phoenicurus) WBWHAVC | KY040010 |
| 11 | Little grebe (Tachybaptus ruficollis) LGAVC | KY040011 |
| 12 | Pheasant tailed jacana (Hydrophasianus chirurgus) PTJAVC | KY040012 |
The current study also found that the Oriental darter belongs to the Anhinga family but it is closely aligned with the Ardeidae family of Grey heron and Purple heron; this is one of the remarkable findings of the present study. The Grey heron and Purple heron are large wading birds. They mainly forage on fishes, insects, crabs, prawns, but the Oriental darter is a diving bird, and the Oriental darter mainly feeds on fish. In addition to that, the reasonable water depth is the most crucial factor for the survival of Oriental darter, particularly for their foraging behaviour compared to the Grey and Purple herons. However, the phylogenetic tree showed different combinations of species, which is one of the exciting results, which is very interesting and making several questions. Another interesting finding is that the Asian openbill was closely aligned with Pheasant-tailed jacana; both birds are different from Ciconiidae and Jakanidae, respectively. The Asian openbill predominantly forages on fishes and it is classified as a piscivorous bird. However, the Pheasant tailed jacana mainly forages on insects, molluscs, and other invertebrates foraging from the aquatic plants or the water's surface and this is also another significant finding among the water birds studied based on their COI gene. The phylogenetic tree results used by the COI water birds implied that water birds' phylogenetic tree was not purely based on their morphological features and behavioural ecology but could be grouped based on their genetic background. In addition to that, the results show a different level of approach concerning waterbirds' order, family and genus. Because the order, family, and genus are grouped differently, not as per the existing rule of morphology and behaviour, it shows differently with unpredicted results, i.e., genetic background.
Indeed the current study showed significantly lower deep divergences among the species. Studies also stated that DNA barcoding is a vital tool for species identification with a low level of profound divergence (Hebert et al., 2004; Johnsen et al., 2010; Kerr et al., 2009b; Aliabadian et al., 2009). The COI is used for the taxonomy more effectively since it also achieved significant outputs and accurate results with a non-invasive method. The COI is broadly applied in evolutionary studies in various organisms since the COI evolves swiftly compared to the DNA, which brings out the fantastic variations between closely related species (Brown et al., 1979; Moore, 1995; Mindell et al., 1997; Hebert et al., 2003; Hebert et al., 2010). Avise et al. (1987) published the first study on the evolutionary history of species based on their COI sequences within species, which has been linked to the population genetics and systematics of species and instituting the field of phylogeography.
Nevertheless, traditionally, the genetic variations or heredities among the species were determined by using their ecological, morphological and behavioural data but recently are changed and reoriented by using diverse data with a wide range of results with different interpretations. For instance, animals living in the same ecological sites have more chance for mating probability, bringing out a different genetic group, in which the closely related animals might have similar phenotype and behaviour. Conversely, on the other hand, similar ecological and phenotypic features do not essentially specify their close genetic relationships since the genetic relationships could be influenced by similar environmental factors (NASEM, 2019). However, modern taxonomical tools could help us address the challenging tasks in the taxonomy that are overcome by using novel nucleic acid-based identifications. The DNA data could explore various species' ecological, morphological, and behavioural aspects from individual to population about their heredity and evolutionary relationships (NASEM, 2019).
5 Conclusion
Overall, the present study implies that the DNA barcoding using COI approach creates a promising technique to identify the known waterbird species with more excellent resolution. An intensive study with a large set of samples covering various order and family levels should be carried out in the future for the proper knowledge of India's endemic birds concerning their genetic background and their evolutionary relationships for better management and conservation.
Acknowledgment
The authors express their sincere appreciation to the Researchers Supporting Project Number (RSP 2021/48), King Saud University, Riyadh, Saudi Arabia
Declaration of Competing Interest
The authors declare that they have no known competing financial interests or personal relationships that could have appeared to influence the work reported in this paper.
References
- Molecular identification of birds: performance of distance-based DNA barcoding in three genes to delimit parapatric species. PLoS ONE. 2009;4(1):e4119.
- [CrossRef] [Google Scholar]
- Intraspecific phylogeography: The mitochondrial DNA bridge between popu- lation genetics and systematics. Annu. Rev. Ecol. Syst.. 1987;18:489-522.
- [Google Scholar]
- Identification through DNA barcoding of Tabanidae (Diptera) vectors of surra disease in India. Acta Trop.. 2015;150:52-58.
- [Google Scholar]
- Mitochondrial DNA(mtDNA) Variations in the Indian Honeybee Apis cerana indica (Fabr.) Populations in southern India. Adv. Bio. Tech.. 2012;12:13-17.
- [Google Scholar]
- DNA Barcoding of birds at a migratory hotspot in eastern turkey highlights continental phylogeographic relationships. PLoS ONE. 2016;11(6):e0154454.
- [CrossRef] [Google Scholar]
- Rapid evolution of animal mitochondrial DNA. Proc. Natl. Acad. Sci. U. S. A.. 1979;76:1967-1971.
- [Google Scholar]
- Barcoding Neotropical birds: assessing the impact of nonmonophyly in a highly diverse group. Mol. Ecol. Res.. 2015;15(4):921-931.
- [Google Scholar]
- DNA barcoding and minibarcoding as a powerful tool for feather mite studies. Mol. Ecol. Resour.. 2015;15(5):1216-1225.
- [Google Scholar]
- Ghosh, S.K., Bhattacharjee, M.J., Devi, K.M., Ahanthem, M., Kundu, S., Laskar, B.A., 2013a. DNA barcoding: Digital taxonomy of bioresources. In: Proceeding of the 20th conference of Society of Animal Physiologists of India, Kolkata.
- DNA barcoding of wild red jungle fowl from Northeast India. J. Environ. Sociobiol.. 2013;10:15-18.
- [Google Scholar]
- Barcoding animal life: cytochrome c oxidase subunit I divergences among closely related species. Proc. Royal Soc. Lond. B (Suppl.). 2003;270:S96-S99.
- [Google Scholar]
- Identification of birds through DNA barcodes. PLoS Biol.. 2004;2(10):e312.
- [CrossRef] [Google Scholar]
- DNA barcoding of Scandinavian birds reveals divergent lineages in trans-Atlantic species. J. Ornithol.. 2010;151(3):565-578.
- [Google Scholar]
- Understanding and confronting species uncertainty in biology and conservation. Trends in Ecol. Evolution. 2003;18:597-603.
- [Google Scholar]
- Probing evolutionary patterns in Neotropical birds through DNA barcodes. PLoS ONE. 2009;4(2):e4379.
- [CrossRef] [Google Scholar]
- Filling the gap-COI barcode resolution in eastern Palearctic birds. Front. Zool.. 2009;6(1):29.
- [CrossRef] [Google Scholar]
- Kumar, S., Stecher, G., Li M., Knyaz C., Tamura, K., 2018. MEGA X: Molecular evolutionary genetics analysis across computing platforms. Mol. Biol. Evol. 35, 1547–1549.
- DNA barcodes can distinguish species of indian mosquitoes (Diptera: Culicidae) J. Med. Entomol.. 2007;44(1):01-07.
- [Google Scholar]
- Mitochondrial DNA effectively detects non-native Testudines: invisible wildlife trade in northeast India. Gene Reports. 2016;4:10-15.
- [Google Scholar]
- DNA barcoding of Gobiid fishes (Perciformes: Gobiidae) from eastern and northeastern India with new record of a Gobionellinae species for the region. Mitochondrial DNA Part A. 2017;28(4):584-587.
- [Google Scholar]
- DNA barcode libraries provide insight into continental patterns of avian diversification. PLoS ONE. 2011;6(7):e20744.
- [CrossRef] [Google Scholar]
- The role of taxonomy in species conservation. Philosophical Transactions of the Royal Society of London. Series B: Bio. Sci.. 2004;359:711-719.
- [Google Scholar]
- Phylogenetic relationships among and within select avian orders based on mitochondrial DNA. In: Mindell D.P., ed. Avian molecular evolution and systematics. New York: Academic Press; 1997. p. :214-247.
- [Google Scholar]
- Inferring phylogenies from mtDNA variation: Mitochondrialgene trees versus nuclear-gene trees. Evolution. 1995;49:718-726.
- [Google Scholar]
- Feeding behavior, toe count, and the phylogenetic relationships among alcedinine kingfishers (Alcedininae) J. Avian Biol.. 2007;38(3):317-326.
- [Google Scholar]
- National Academies of Sciences, Engineering, and Medicine, 2019. Evaluating the Taxonomic Status of the Mexican Gray Wolf and the Red Wolf. Washington, DC: The National Academies Press. https://doi.org/10.17226/25351.
- Molecular Evolution and Phylogenetics. New York: Oxford University Press; 2000.
- Low number of mitochondrial pseudogenes in the chicken (Gallus gallus) nuclear genome: Implications for molecular inference of population history and phylogenetics. BMC Evol. Biol.. 2004;4:17.
- [Google Scholar]
- DNA Barcodes for Marine Biodiversity: Moving Fast Forward? Diversity. 2010;2(4):450-472.
- [Google Scholar]
- Broad-scale latitudinal patterns of genetic diversity among native European and introduced house sparrow (Passer domesticus) populations. Mol. Ecol.. 2011;20(6):1133-1143.
- [Google Scholar]
- DNA Barcoding studies on Thrips in India: Cryptic species, Species complexes. Sci. Rep.. 2017;4898(7):1-14.
- [Google Scholar]
- Mitochondrial phylogeographies of five widespread Eurasian bird species. J. Ornithol.. 2008;149(3):399-413.
- [Google Scholar]


