

Translate this page into:
DNA barcoding and phylogenetics of Wallago attu using mitochondrial COI gene from the River Indus
⁎Corresponding author. farhatjabeen@gcuf.edu.pk (Farhat Jabeen)
-
Received: ,
Accepted: ,
This article was originally published by Elsevier and was migrated to Scientific Scholar after the change of Publisher.
Peer review under responsibility of King Saud University.
Abstract
Objectives
DNA barcoding technique for fish identification is an effective, rapid, and precise method as compared to the morphological method. Cytochrome c oxidase subunit 1 gene-based DNA barcoding is frequently used in species identification and biodiversity studies. The current study was designed to identify the fishes with the help of DNA barcoding method resulting COI gene sequences, which were used in the construction of genetic diversity and evolutionary history of Wallago attu inhabiting different sites of the River Indus.
Methods
The short mDNA gene sequence of 650 base pairs (COI) was amplified, sequenced, and analyzed by using different bioinformatics tools. The Pairwise distance and phylogenetic analysis by Maximum Likelihood (ML) tree based on Kimura 2 Parameter method was constructed by using MEGA 11 software.
Results
Pairwise genetic distance among species showed less divergence between a minimum of 0.000% and a maximum of 0.038%. The Percentage base composition of sequenced samples was calculated and overall AT content (53.7%) was found higher in all sequences as compared to GC content (46.2%). The Phylogenetic tree revealed that species clustered differently under diverse nodes. It revealed that fish species clustered together because they were in the same order and family. QR code in this study was first time developed to guide misleading and fraud cases.
Conclusions
These results showed that fish species share identical genera but with diverse genetic variations due to diverse habitats involving a common ancestor. The COI barcodes generated in the current study will help in species identification.
Keywords
Wallago attu
Morphological Identification
COI gene
DNA barcoding
Phylogenetic analysis

1 Introduction
In Pakistan, the number of freshwater fish species is not more than 193 (Abro et al., 2020). In River Indus Pakistan, more than 180 freshwater fish species have been recorded (Sheikh et al., 2017). In its tributaries, a high range of diverse, commercially important and representative fish fauna has been found annually. Many scientists have huge data on the diversity and distribution pattern of fish but they still, need a lot of attention (Hussain et al., 2016). Pakistan has varied water resources comprising dams, rivers, streams, and canals. The River Indus system is the largest river system in Pakistan. Near Kailas Mount, River Indus originates in the Tibet Gangdise Range. The Chenab, Sutlej, Jhelum, and Ravi also drain into River Indus in the Punjab plains (Mirza and Mirza, 2014). It had a diverse variety of fish species. Almost 43 native fish species are economically and commercially important (Sherzada et al., 2020). Among all these species, Wallago attu is important economic fish belonging to the family Siluridae under the order Siluriforms. Malee is a common name for W. attu with Vulnerable conservation status (Ng et al., 2019). W. attu is widely distributed in Asian countries, including Pakistan, Nepal, India, Bangladesh, Indonesia, Vietnam, Sri Lanka, and Afghanistan (Siraj et al., 2016). It is a catfish with a fast growth rate and a good food fish with high nutritional value (Gupta, 2015). It has high protein content. Due to its importance and environmental changes, it is near to being threatened (Hussain et al., 2016). According to researchers, there is a need to improve conservation and its protection.
The study of the morphology of fishes plays a vital role in the betterment of conservation, evolution, ecology, and environmental variations (Ozcan and Altun, 2015). Morphological relationships play an important role between fish stock identification and species population and distribution. But it is difficult to identify this species exactly based on morphology due to the lack of some morphological features and also taxonomic expertise. DNA barcoding can offer a precise and rapid method of identification of Wallago attu (Bhattacharjee et al., 2012).
DNA barcoding is the most commonly used genetic technique for species identification and has also been used for species discovery in different organism groups (Ude et al., 2020; Kamran et al., 2020; Tsoupas et al., 2022). DNA barcoding method in which a small mitochondrial gene fragment was used for species identification was developed by Hebert and his colleagues at the University of Guelph in Canada (Rahman et al., 2019). In this method, small fragments of mitochondrial gene almost 655 bp of COI gene fragment from the 5′ were used as a standard marker for the identification of eukaryotic species including vertebrates and invertebrates (Keskİn and Atar, 2013). Due to the advancement in computational techniques, DNA sequencing becomes the major source to understand genetics and evolutionary relationships (Hajibabaei et al., 2007). DNA barcode system is applicable for all fish species identification and is a simple, reliable, accurate, and cheap method for the identification of species (Lakra et al., 2011; Becker et al., 2011). A good barcode has less intraspecific distance than interspecific (Hajibabaei et al., 2007). DNA barcoding can accurately differentiate between the species which have highly similar morphological features. This method can identify species at any developmental stage. Cryptic species can also be identified using this technology (Bingpeng et al., 2018).
For the discrimination between closely resembled species across dissimilar animal phyla mitochondrial Cytochrome c oxidase subunit I is best for molecular analysis of marine and freshwater fishes (Hebert et al., 2003). For differentiation of a vast variety of animal species presently, there is no such great data on W. attu ecology, biology, and molecular analysis in the area of the River Indus, Punjab, Pakistan. Keeping in view the above facts, the study was planned to assess morphology, meristic characteristics, and DNA barcoding of W. attu from the River Indus. The study will be a great addition to the research and conservation of W. attu in the River Indus, Punjab, Pakistan.
2 Materials and methods
Ethic statement:
All procedures regarding the sampling were according to the protocols of the ethical review committee of Government College University Faisalabad, Pakistan in line with the international standards on animal experimentation.
2.1 Sampling sites
Fish samples were collected with the help of commercial fishermen using small meshed cast nets from seven different sites along an 85 Km stretch of the River Indus, Punjab, Pakistan from upstream to downstream viz., Kalabagh (L1), DaudKhel (L2), Mochh (L3), Rokhri (L4), Mianwali (L5), Ghandi (L6) and Chashma (L7). Fish samples of around 500 g were collected from these locations (S1-S7). The collected specimens were preserved in absolute ethanol and then transferred to the research laboratory, Department of Zoology, Government College University Faisalabad.
2.2 Morphological analysis
Identification of all morphometric characters was done by using a special key of the fishes of Punjab, Pakistan (Mirza and Sharif, 1996). All morphometric measurements of each sample were done with the help of scales, magnifying glass, and vernier calipers were done at room temperature (Fig. 1). After the identification based on morphology samples were further processed for DNA barcoding.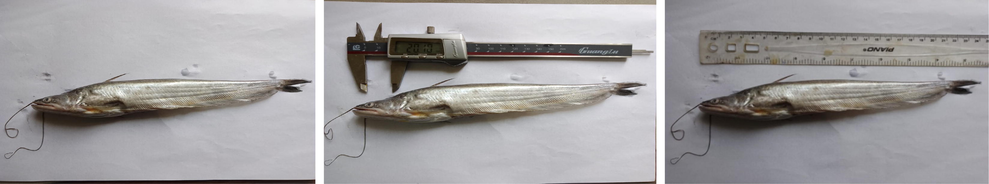
Wallago attu.
2.3 DNA extraction and PCR amplification
A small piece of ethanol preserved tissue was cut-off to isolate DNA by using “QIAampR DNA Mini Kit” following the directions of manufacture. A conserved region was amplified from 5/ end of COI gene using the under given primers.
The Cytochrome c oxidase subunit 1 (COI) gene was amplified with the help of universal primers synthesized from (MACROGEN Inc., Seoul, Korea) Fish F1 & Fish R1 (Ward et al., 2005; Kamran et al., 2020). Primer sequences were:
FishF1: (5/ TCAACCAACCACAAAGACATTGGCAC 3/).
FishR1: (5/ TAGACTTCTGGGTGGCCAAAGAATCA 3/).
The final volume of PCR reaction was 25 µl which included 1X reaction buffer, 1 µl template DNA, 2.5mMdNTPs, 2.5 mM MgCl2, 0.2 U TaqDNA polymerase and 0.5 µl of each primerin PCR machine DNA Engine Tetrad 2 Peltier Thermal Cycler (BIO-RAD). PCR amplification conditions were as follows: 94 °C for 5 min; 94 °C for 30 sec, variable temperature for 30 sec, 72 °C 40 sec for 35 cycles; 72 °C for 7 min. PCR products were envisioned on 1% agarose gel electrophoresis tainted with ethidium bromide.
2.4 PCR product purification and standard sequencing
The polymerase chain reaction sequencing was performed using Genetic Analyzer (ABI PRISM 3730XL Analyzer 96 capillary type). Cycle sequencing was passed out by using the Big Dye(R Terminator v3.1) Cycle Sequencing Kit (Applied Biosystems).
3 Statistical and sequence analysis
Morphological parameters were analyzed using Minitab 17 software by one-way ANOVA and t-test. The sequencing data were converted into FASTA format. BLASTS of the COI sequences were done at the NCBI to determine the best match homology. Evolutionary analysis of the aligned sequences was conducted in the software MEGA 11. The phylogenetic tree was rooted using Ompok bimaculatus as an out group. The history of evolution was directed using the Maximum Likelihood method (Nei and Kumar, 2000). Evolutionary divergence was calculated using the Kimura 2-parameter distance model (Kimura, 1980). Sequenced data was used to generate unique QR code by using an online QR code generator for precise detection of this specie.
4 Results
The species were first identified by shape, size, fin ray count, color, and other morphometric and meristic characteristics (Table 1). All these characters showed significant differences (p < 0.005) between and within groups. Pectoral fins of fish belonging to the family Siluridae, genus wallago were considered for DNA barcode creation. Amplification of the mitochondrial COI gene of 650 bp was done by using Fish F1 and Fish R1 primers.
Morphometric characters
(mm)
Locations
L1
(Kalabagh)
L2
(DaudKhel)
L3
(Mochh)
L4
(Rokhri)
L5 (Mianwali)
L6
(Ghandi)
L7
(Chashma)
TL
318.99 ± 11.70
295.38 ± 46.47
322.29 ± 23.93
308.38 ± 39.88
273.81 ± 25.37
281.42 ± 29.68
273.59 ± 38.05
SL
254.35 ± 55.74
258.20 ± 39.75
265.27 ± 42.77
261.25 ± 42.99
248.52 ± 27.45
235.27 ± 19.38
220.56 ± 4.64
FL
289.65 ± 31.58
270.44 ± 53.45
295.83 ± 33.07
298.85 ± 28.89
260.42 ± 33.32
258.63 ± 26.70
240.54 ± 30.44
HL
55.51 ± 4.14
57.71 ± 6.27
60.48 ± 4.53
58.13 ± 5.88
52.76 ± 3.05
54.24 ± 4.32
53.54 ± 5.79
SnL
24.20 ± 3.53
25.52 ± 0.94
26.73 ± 1.79
25.37 ± 1.48
24.94 ± 1.25
26.30 ± 2.05
25.94 ± 3.34
ED
7.08 ± 1.16
7.52 ± 0.14
8.18 ± 0.53
7.61 ± 0.54
7.08 ± 1.10
7.50 ± 1.17
7.16 ± 1.60
PrDL
75.79 ± 7.61
76.00 ± 8.51
80.19 ± 5.17
78.97 ± 5.72
72.22 ± 5.07
73.47 ± 4.82
70.85 ± 6.76
PsDL
185.30 ± 34.92
177.36 ± 39.90
198.08 ± 22.36
196.44 ± 23.20
171.10 ± 18.78
172.75 ± 18.70
162.24 ± 21.34
There were 605 of 675 conserved sites, 61 of 675 variable sites, 33 of 675 parismony informative sites, and 28 of 675 singleton variable sites found in the barcodes. Transversional substitutions (sv = 71.36) were found to be more common than transitional substitutions (si = 28.65), with R ratio of 0.40 for the dataset. BLAST analysis revealed that all the sequences of COI gene of W. attu specimens have a maximum identity (100%) with the respective sequence in the mitochondrial region in the GenBank database (Table 2). After editing the consensus length of all barcode sequences was 655 bp and no deletions, insertions, or stop codons were observed in any sequence. All analyzed sequences were more than 600 bp which confirmed that NUMT (Nuclear DNA sequence originated from mDNA sequences and are less than 600 bp in length) were not sequenced in the present study.
Query sequence ID
Accession No.
Query
Length
Percent
Identity
E-value
Accession No. of the best match
Query Cover
W. attu(L1)
MZ461934
633
99.68%
0
MK572628.1
100%
W. attu(L2)
MZ461935
595
100%
0
JX983507.1
100%
W. attu(L3)
MZ895367
619
100%
0
MZ312383.1
100%
W. attu(L4)
MZ895368
605
100%
0
MN368903.1
100%
W. attu(L5)
MZ895369
623
100%
0
JX983507.1
100%
W. attu(L6)
MZ913725
621
100%
0
FJ170767.1
99%
W. attu(L7)
MZ913726
623
100%
0
MK572628.1
100%
W. attu(L1)
OP482183
644
97.57%
0
MN368898.1
98%
W. attu(L1)
OP482270
618
99.84%
0
MN368898.1
99%
W. attu(L2)
OP482296
605
99.67%
0
MN368903.1
99%
W. attu(L2)
OP520920
631
100%
0
MN368898.1
100%
W. attu(L3)
OP520921
616
99.84%
0
MN368898.1
100%
W. attu(L3)
OP520930
618
99.19%
0
MN368902.1
100%
W. attu(L4)
OP520931
616
96.91%
0
MN368898.1
100%
W. attu(L4)
OP521220
616
99.02%
0
MN368902.1
100%
W. attu(L5)
OP521572
629
98.25%
0
MN368897.1
100%
W. attu(L5)
OP521769
629
98.09%
0
MN368897.1
100%
W. attu(L6)
OP521770
628
98.41%
0
MN368895.1
100%
W. attu(L6)
OP524192
616
99.84%
0
MN368898.1
100%
W. attu(L7)
OP563463
644
100%
0
MW150846.1
100%
W. attu(L7)
OP566851
659
100%
0
MW150844.1
100%
A Phylogenetic tree was constructed by using the maximum likelihood (ML) method based on the K2P method (Fig. 2). The analysis involved 21 nucleotide sequences of experimental species. To compare with experimental specie some reference sequences from NCBI with accession numbers from the BLAST search were downloaded to minimize error for identification. After this, experimental and reference sequences were arranged in FASTA format. Then, all sequences were uploaded to MEGA 11 software for advance alignment, construction and analysis, of the phylogenetic tree. The analysis concerned 39 consensus sequences. Positions of codon were included 1st + 2nd + 3rd + Noncoding. Gaps and missing data from all sequences were eliminated. After elimination of all gaps total 572 positions were remained in the final sheet. By using MEGA 11 software all evolutionary analyses were accomplished. The evolutionary tree between specie exposed that the majority of the specie clustered simultaneously indicating less divergence between them. Similarly, these species showed less pairwise genetic distance (Table 3).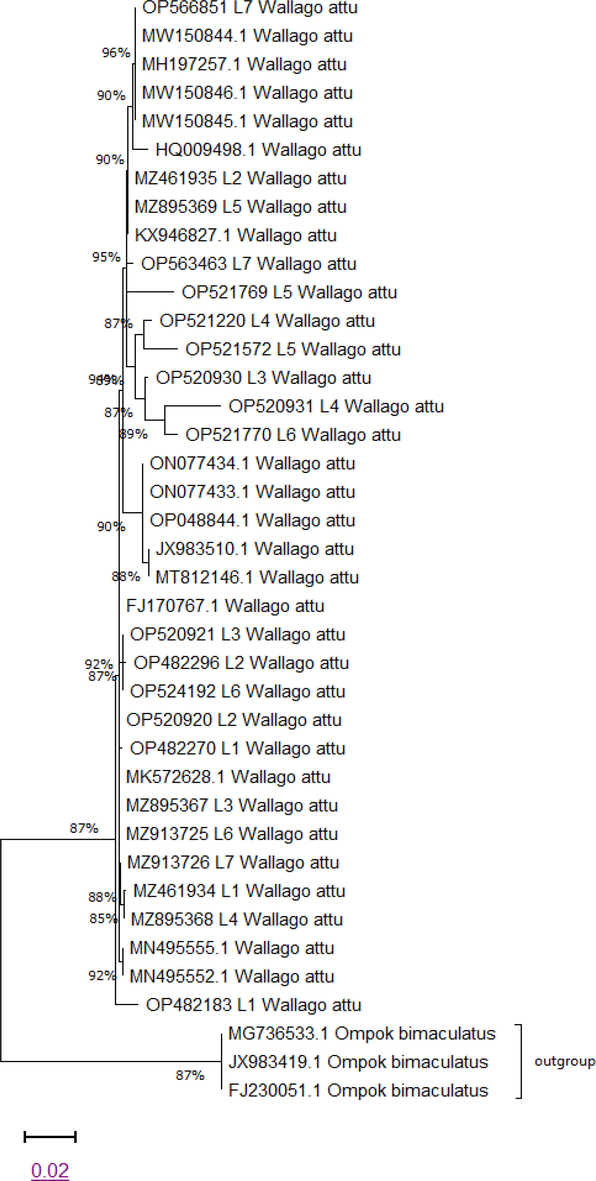
Maximum likelihood tree representing genetic relationship among Wallago attu.
1
2
3
4
5
6
7
8
9
10
11
12
13
14
15
16
17
18
19
20
21
1. MZ461934 L1
2. MZ461935 L2
0.004
3. MZ895367 L3
0
0.004
4. MZ895368 L4
0
0.004
0
5. MZ895369 L5
0.004
0
0.004
0.004
6. MZ913725 L6
0
0.004
0
0
0.004
7. MZ913726 L7
0
0.004
0
0
0.004
0
8. OP482183 L1
0.005
0.009
0.005
0.005
0.009
0.005
0.005
9. OP482270 L1
0.002
0.005
0.002
0.002
0.005
0.002
0.002
0.007
10. OP482296 L2
0.004
0.007
0.004
0.004
0.007
0.004
0.004
0.009
0.005
11. OP520920 L2
0
0.004
0
0
0.004
0
0
0.005
0.002
0.004
12. OP520921 L3
0
0.005
0.002
0.002
0.005
0.002
0.002
0.007
0.004
0.002
0.002
13. OP520930 L3
0.002
0.007
0.007
0.007
0.007
0.007
0.007
0.012
0.009
0.011
0.007
0.009
14. OP520931 L4
0.007
0.036
0.032
0.032
0.036
0.032
0.032
0.038
0.034
0.036
0.032
0.034
0.032
15. OP521220 L4
0.032
0.011
0.014
0.014
0.011
0.014
0.014
0.019
0.012
0.018
0.014
0.016
0.011
0.032
16. OP521572 L5
0.014
0.014
0.018
0.018
0.014
0.018
0.018
0.023
0.019
0.018
0.018
0.019
0.014
0.029
0.011
17. OP521769 L5
0.018
0.016
0.019
0.019
0.016
0.019
0.019
0.025
0.021
0.023
0.019
0.021
0.023
0.038
0.027
0.027
18. OP521770 L6
0.019
0.016
0.019
0.019
0.016
0.019
0.019
0.025
0.021
0.019
0.019
0.018
0.016
0.03
0.019
0.023
0.029
19. OP524192 L6
0.002
0.005
0.002
0.002
0.005
0.002
0.002
0.007
0.004
0.002
0.002
0
0.009
0.034
0.016
0.019
0.021
0.018
20. OP563463 L7
0.004
0
0.004
0.004
0
0.004
0.004
0.009
0.005
0.007
0.004
0.005
0.007
0.036
0.011
0.014
0.016
0.016
0.005
21. OP566851 L7
0.004
0
0.004
0.004
0
0.004
0.004
0.009
0.005
0.007
0.004
0.005
0.007
0.036
0.011
0.014
0.016
0.016
0.005
0
The Percentage base composition of all 4 bases in COI sequences of all W. attu from seven sites was calculated (Table 4). The overall mean nucleotide base frequencies observed for these sequences were T (28.6%), C (27.9%), A (25.1%), and G (18.3%). The overall AT content (53.7%) was higher than GC content (46.2%).
Accession No.
T
C
A
G
Total
GC%
AT%
MZ461934 L1
28.8
27.1
25.2
19.0
632.0
46.1
54
MZ461935 L2
29.0
27.4
25.1
18.5
594.0
45.9
54.1
MZ895367 L3
28.3
27.3
25.4
18.9
618.0
46.2
53.7
MZ895368 L4
28.5
27.5
25.5
18.5
604.0
46
54
MZ895369 L5
28.6
27.2
25.1
19.1
622.0
46.3
53.7
MZ913725 L6
28.2
27.3
25.3
19.2
620.0
46.5
53.5
MZ913726 L7
28.5
27.2
25.2
19.1
622.0
46.3
54.7
OP482183 L1
29.2
27.5
25.5
17.7
643.0
45.2
54.7
OP482270 L1
28.5
28.4
25.3
17.8
617.0
46.2
53.8
OP482296 L2
28.6
28.0
25.3
18.0
604.0
46
53.9
OP520920 L2
28.7
28.4
25.1
17.8
630.0
46.2
53.8
OP520921 L3
28.6
28.3
25.2
17.9
615.0
46.2
53.8
OP520930 L3
28.4
28.2
25.4
18.0
617.0
46.2
53.8
OP520931 L4
28.0
28.3
25.5
18.2
615.0
46.5
53.5
OP521220 L4
28.8
28.3
25.2
17.7
615.0
46
54
OP521572 L5
28.7
28.5
24.8
18.0
628.0
46.5
53.5
OP521769 L5
28.5
28.8
24.7
18.0
628.0
46.8
53.2
OP521770 L6
28.7
28.5
24.4
18.3
627.0
46.8
53.1
OP524192 L6
28.6
28.3
25.2
17.9
615.0
46.2
53.8
OP563463 L7
28.9
27.5
24.9
18.7
643.0
46.2
53.8
OP566851 L7
29.3
27.2
24.8
18.7
658.0
45.9
54.1
Avg.
28.6
27.9
25.1
18.3
622.2
46.2
53.7
This is the first study of this specie from the selected sites to generate QR codes for accurate identification of W. attu. This specie could be identified with their unique QR code (Fig. 3).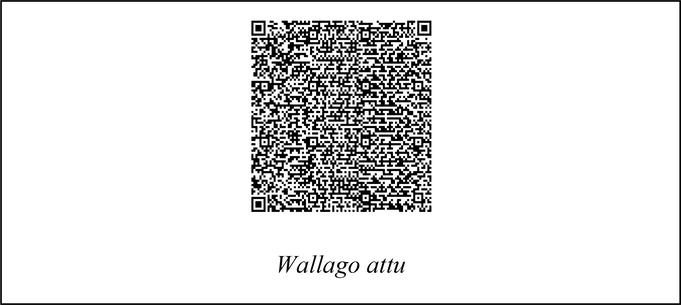
QR codes generated using Fasta Sequences of Wallago attu.
5 Discussion
It is very important to identify fish biodiversity accurately before the utilization of fish in any field. The standard and traditional approach for fish identification is based on morphological characters, but when there is phenotypic plasticity this approach is not reliable. To understand the speciation and phylogenetic relationship of fishes in the past, the only tools were meristic and morphometric. By the investigation of a small fragment of the whole genome, the discrimination of biodiversity is allowed by the micro genomic identification system. Mitochondrial DNA of animals is the best technology for the identification of species analysis than nuclear DNA due to the lack of haploid and introns approach of inheritance. (Cytochrome c oxidase subunit I) COI gene is used as a standard marker for the bio-identification of species (Hebert et al., 2003).
In the current study, thirty-five (35) individuals of Wallago attu (catfish: Siluridae family) were collected from River Indus Punjab, Pakistan. 21 out of 35 samples were processed for DNA barcoding. These samples were initially identified based on morphological characters and to resolve the taxonomic problems; a molecular study has also been done considering the effectiveness of DNA barcoding for the identification of W. attu. Therefore, this study shows so as to the results obtained from the morphometric and molecular analysis is similar.
W. attu is rare and ranked near threatened (Khan et al., 2008) in this area due to which a limited number of samples were taken for this study. Identification based on morphology is a basic method to know about demographic characteristics, growth, and systematic variation of fish. Morphometric analysis performs a vital role in the estimation of the relationship between different body parts. The Mean and standard deviation of all the samples showed that all relationships of TL with HL, SL, SnL, FL, ED, PrDL, and PoDL are extremely significant (p < 0.005), showed that all (length-length relationships) LLRs are considerably interrelated (Tables 1, 2). These extremely significant relationships in the current study for length-length relationships are in universal harmony with other studies described on Tor potitura (Naeem et al., 2011b), Oreochromis mossambicus (Naeem et al., 2011a).
The morphological parameters demonstrated a comparative constructive increase with an increase in the length of fish. (Ujjania et al., 2012) too revealed that with an enhancement in fish length morphometric parameters were also recorded with positive growth. Meristic counts were almost invariable with different body lengths in all the collected samples of fish, so it concluded that the meristic counts were independent of body length (Ishtiaq and Naeem, 2016).
5.1 DNA barcoding
At species level identification, an effective and advanced method is DNA barcoding. The Barcoding technique can be applied all over the samples. It can be used for fresh as well as preserved samples (Cawthorn et al., 2012). The Mitochondrial COI gene with 655 base pairs is considered a universal barcode for animals due to its high number of exons, fast mutation rate, and high availability all over the cells and maternal inheritance. DNA barcoding gives accurate identification of taxon and also covers the issues of conservation in biodiversity. Genetic sequences obtained from the species assemblage are uploaded to the barcode library. In recent years, barcoding of freshwater fishes has particularly donated to the global GenBank dataset from diverse reservoirs, lakes, and riverside systems (Kundu et al., 2019). Superlatively, interaspecific divergence should be about 10 times less than interspecific divergence (Hebert et al., 2004). Clear sequence divergence between species that is coupled with sequence conservation within species confirmed the barcode COI sequence as highly specific and variable.
5.2 Phylogenetic tree analysis
Phylogenetic tree analysis showed identical categorization regarding morphology and taxonomy beside with non-significant differentiation at taxonomic levels. Our findings showed the worth of barcoding for the exact identification and authentification of freshwater fish species of the River Indus. In this study, 21 freshwater fish samples of W. attu were categorized.
Within species together branch length is more bunched than the branch length between species which are deeper. This confirms the finding of (Meyer and Paulay, 2005) branch length tends to be much deeper between species than between conspecific individuals. The phylogenetic tree noticeably separates the Wallago attu samples on the bases of genetic distance. (Ward et al., 2005) in their Australian fish species study verified effectiveness of phylogenetic tree in distinctive species through presenting fourteen diverse clusters from fourteen flathead species. The evolutionary analysis was summarized with the help of Maximum Likelihood method (ML) based on the K2P model. The analysis involved 21 nucleotide sequencing of W. attu. All gaps and missing data were removed and evolutionary examination was accomplished in MEGA 11 software (Karim et al., 2018). The study of tilapia renowned dissimilar tilapia fish species into diverse clustered groups (Sogbesan et al., 2017). These results demonstrated that all individuals of a species collected together.
In the phylogenetic tree, W. attu MZ913726, OP520920 and MZ913725 originated from same cluster showed these are sister species, while W. attu MN49555.1 is more closely related to the above-mentioned species (Fig. 1). In this tree, all sequenced samples are closely related to each other and showed less divergence because all these species belong to the same genus. Phylogenetic clade showed more divergence between Wallago attu and Ompok bimaculatus due to having different genera.
5.3 Pairwise genetic distance (K2P)
In our investigations, K2P model was utilized to estimate pairwise genetic difference between species. The average distance among species was a minimum of 0.000% and a maximum of 0.038% because distance decreases as we move from family to species level (Table 4). As we studied about single specie our results showed the less genetic difference. Our findings are reliable with the earlier study by (Mudumala et al., 2011).
5.4 Nucleotide base discrimination
The Percentage base composition of all four bases in partial COI sequencing of all W. attu samples from the River Indus was collected (Table 4). Our results demonstrated that the composition of average nucleotide bases was 46.2% GC and 53.7% AT catfish. The average GC content was less than the average AT content. Overall excessive thymine nucleotide as compared to other nucleotide bases was found in all sequences, this outline is also examined in other cyprinid species as pragmatic by (Meyer and Paulay, 2005; Karim et al., 2018).
5.5 DNA sequence based generated QR codes
This is barcode base study due to which we generated QR codes that be capable of scan by using cell phone application. This method is similar as barcodes scanned in superstore (Fig. 3). In this study, we generated QR code for the 1st time based on the molecular level for the identification of freshwater catfish Wallago attu. QR code of this specie was generated and named. Yang et al. (2019) generated 1st time DNA sequence based QR code which differs from our approach.
As there is no previous DNA-based study for Wallago attu fish collected from River Indus, Pakistan. As the results of the present study, provide early data for possible mitochondrial genomes and some phylogenetic research. It is necessary to understand further DNA research studies on commercially important catfish Wallago attu of family Siluridae from the River Indus are requisite, as understanding between catfish obtainable genetic resources could prove helpful for scheming future genetic breeding programs.
6 Conclusions
In the current study, the identification of catfish Wallago attu was done based on morphology which was further confirmed through DNA barcoding. Morphological identification has many limitations due to which DNA barcoding has enough variability to differentiate among species. This research will be helpful for future researchers and this data has a great addition to River Indus biodiversity and conservation.
Acknowledgements
The authors are grateful to Higher Education Commission of Pakistan for funding this research project under grant number 5698/PUNJAB/NRPU/R&D/HEC/2016 and the Punjab Fisheries Department for helping sample collection.
Declaration of Competing Interest
The authors declare that they have no known competing financial interests or personal relationships that could have appeared to influence the work reported in this paper.
References
- Diversity of freshwater fish in the lower reach of Indus River, Sindh province section, Pakistan. Egypt. J. Aquat. Biol. Fish. 2020;24(6):243-265.
- [CrossRef] [Google Scholar]
- Five years of FISH-BOL: Brief status report. Mit. DNA. 2011;22(sup1):3-9.
- [CrossRef] [Google Scholar]
- Identification and re-evaluation of freshwater catfishes through DNA barcoding. PLoS One. 2012;7(11):e49950.
- [Google Scholar]
- DNA barcoding for identification of fish species in the Taiwan Strait. PLoS One. 2018;13(6):e0198109.
- [Google Scholar]
- DNA barcoding reveals a high incidence of fish species misrepresentation and substitution on the South African market. Food Res. Int.. 2012;46(1):30-40.
- [CrossRef] [Google Scholar]
- Wallago attu (Bloch and Schneider, 1801), a threatened catfish of Indian waters. Int. J. Res. Fish. Aquac.. 2015;5(4):140-142.
- [Google Scholar]
- DNA barcoding: how it complements taxonomy, molecular phylogenetics and population genetics. Trends Genet.. 2007;23(4):167-172.
- [CrossRef] [Google Scholar]
- Barcoding animal life: cytochrome c oxidase subunit 1 divergences among closely related species. Proc. R. Soc. Lond. B. 2003;270(suppl_1):S96-S99.
- [CrossRef] [Google Scholar]
- Ten species in one: DNA barcoding reveals cryptic species in the Neotropical skipper butterfly Astraptes fulgerator. Proceed. Nat. Acad. Sci.. 2004;101(41):14812-14817.
- [CrossRef] [Google Scholar]
- Diversity and status of Ichthyofauna of hill torrents of Suleman Mountain Range, Dera Ghazi Khan region. Pakistan. Pak. J. Agri. Sci.. 2016;53(4):833-842.
- [CrossRef] [Google Scholar]
- Diversity, abundance and seasonal variations of fish community in lentic water bodies of Indus River at Ghazi Ghat, Pakistan. Pak. J. Zool.. 2016;48(1):59-65. 0030-9923/2016/0001-0059
- [Google Scholar]
- Length-weight relationships and condition factor for farmed Catla catla (Hamilton, 1822) from Southern Punjab, Pakistan. Punj. Univ. J. Zool.. 2016;31(2):209-214. 97-PUJZ-61022270/16/0209-0214
- [Google Scholar]
- Identification and phylogenetic analysis of Channa species from riverine system of Pakistan using COI gene as a DNA barcoding marker. J. Bioresou. Manag.. 2020;7(2):10.
- [CrossRef] [Google Scholar]
- Use of CO1 gene sequences for computing genetic diversity between Cirrhinusmrigala from two different habitats (Farm and River) In Basic Clin. Pharmacol. Toxicol.. 2018;3(2):54-57.
- [Google Scholar]
- DNA barcoding commercially important fish species of Turkey. Mol. Ecol. Resour.. 2013;13(5):788-797.
- [CrossRef] [Google Scholar]
- Ichthyofaunal survey of some freshwater reservoirs in Punjab. J.A.P.S.. 2008;18(4):151-154.
- [Google Scholar]
- A simple method for estimating evolutionary rate of base substitutions through comparative studies of nucleotide sequences. J. Mol. Evo.. 1980;6(111–120)
- [Google Scholar]
- DNA barcoding of freshwater fishes from Brahmaputra River in Eastern Himalaya biodiversity hotspot. Mit. DNA Part B. 2019;4(2):2411-2419.
- [CrossRef] [Google Scholar]
- DNA barcoding Indian marine fishes. Mol. Ecol. Resour.. 2011;11(1):60-71.
- [CrossRef] [Google Scholar]
- DNA barcoding: error rates based on comprehensive sampling. PLoS Biol.. 2005;3(12):e422.
- [Google Scholar]
- Longitudinal zonation in the fish fauna of the Indus river in Pakistan. Biologia. 2014;60(1):149-152.
- [Google Scholar]
- A Key to fishes of the Punjab. Lahore, Pakistan: Ilmi Kitab Khana; 1996.
- Phylogenetic relationships of coastal tunas inferred from mitochondrial DNA sequences in the cytochrome c oxidase I (COI) gene—a study on DNA barcoding. November. In: First Meeting of the IOTC Working Party on Neritic Tunas, Chennai, India. 2011. p. :14-16.
- [Google Scholar]
- Length–Weight relationship of female population of farmed Oreochromis mossambicus in relation to body size and condition factor from Pakistan. In: International Conference on Bioscience, Biochemistry and Bioinformatics, IPCBEE. Vol vol. 5. Singapore: IACSIT Press; 2011. p. :360-363.
- [Google Scholar]
- External morphometric study of hatchery reared mahseer (Tor putitora) in relation to body size and condition factor. Afr. J. Biotech.. 2011;10(36):7071-7077.
- [CrossRef] [Google Scholar]
- Molecular Evolution and Phylogenetics. Oxford University Press; 2000.
- Ng, H.H., de-Alwis-Goonatilake, S., Fernado, M., Kotagama, O., 2019. Wallago attu (errata version published in 2020). The IUCN Red List of Threatened Species, e.T166468A174784999.
- Length-weight relationship and condition factor of three endemic and threatened freshwater fishes from Orontes River. Pak. J. Zool.. 2015;47(6):1637-1643. 0030-9923/2015/0006-1637
- [Google Scholar]
- Building a DNA barcode library for the freshwater fishes of Bangladesh. Sci. Rep.. 2019;9(1):1-10.
- [CrossRef] [Google Scholar]
- Current Status of Three Major Carps (Labeo rohita, Cirrhinus mrigala and Catla catla) In the Downstream Indus River, Sindh. Fish. Aqua. J.. 2017;8:222.
- [CrossRef] [Google Scholar]
- Identification of three cyprinidae family members through cytochrome oxidaseI. Pakistan J. Zool.. 2020;52(1):1-4.
- [CrossRef] [Google Scholar]
- Bioaccumulation of heavy metals in different organs of Wallago attu from River Kabul Khyber Pakhtunkhwa, Pakistan. Biol. Trace Element Res.. 2016;172(1):242-250.
- [CrossRef] [Google Scholar]
- DNA barcoding of tilapia species (Pisces: Cichlidae) from North-Eastern Nigeria. J. Biotec. Biomat.. 2017;7(4):1-4.
- [CrossRef] [Google Scholar]
- DNA barcoding identification of Greek freshwater fishes. PLoS One. 2022;17(1):e0263118.
- [Google Scholar]
- DNA barcoding for identification of fish species from freshwater in Enugu and Anambra States of Nigeria. Conserv. Genet. Resour.. 2020;12(4):643-658.
- [CrossRef] [Google Scholar]
- Biometric studies of mahseer (Tor tor. Ham. 1822) from Bari talab (Udaipur), India. Int. J. Innov. Bio-Sci.. 2012;2(3):38-141.
- [Google Scholar]
- DNA barcoding Australia's fish species. Philos. Trans. Roy. Soc. Lond. Ser. B Biol. Sci.. 2005;360:1847-1857.
- [CrossRef] [Google Scholar]
- Decision theory-based COI-SNP tagging approach for 126 scombriformes species tagging. Front. Genet.. 2019;10:259.
- [CrossRef] [Google Scholar]
Appendix A
Supplementary material
Supplementary data to this article can be found online at https://doi.org/10.1016/j.jksus.2023.102725.
Appendix A
Supplementary material
The following are the Supplementary data to this article:


