

Translate this page into:
Discorea nipponica saponins restore the Th17/Treg balance in aplastic anemia through the Notch/RBPJκ/FOXP3/RORγt axis
⁎Corresponding author. liubaoshanzyy@163.com (Baoshan Liu)
-
Received: ,
Accepted: ,
This article was originally published by Elsevier and was migrated to Scientific Scholar after the change of Publisher.
Peer review under responsibility of King Saud University.
Abstract
T cell differentiation is a key pathological process of aplastic anemia (AA). Tregs and Th17 must be balanced for efficient immune tolerance. Discorea nipponica saponins (DNS) improves the recovery from hematopoiesis in AA models through its ability to increase the number of T-helper cells whilst decreasing the percentage of T-cytotoxic cells in AA mice. However, the mechanisms by which DNS leads to these therapeutic effects remains largely undefined. Here, we explored the mechanism(s) by which DNS regulates T cell subsets in mouse AA models. BALB/c male mice were used to establish the AA model using 137Cs irradiation and intraperitoneal injection with cyclophosphamides and Chloramphenicol. Mice were administrated DNS/Tripterygium wilfordii polyglycoside tablets (TW)/cyclosporine A (CsA)/distilled water via gavage each day for 14 days. Peripheral blood, spleen and bone marrow were obtained. Bone marrow morphology, Notch/RBPJκ/FOXP3/RORγt signaling and molecules regulating Th17/Treg balance were evaluated. We found that DNS-M attenuated pancytopenia in mouse AA models. DNS-M could not only suppressed Th 17 cell numbers and RORγt expression, but enhanced the prevalence of Treg cells and Foxp3 expression. Moreover, DNS-M modulated the level of Notch1, Jagged1, RBPJκ, FOXP3, RORγt, DLL4 in AA models. These data suggest that the administration of DNS-M exhibits therapeutic effects through restoring the Th17/Treg cell balance in AA mice through its regulation of the Notch/RBPJκ/FOXP3/RORγt pathway.
Keywords
Discorea nipponica saponins
Aplastic anemia
T cell differentiation
Notch pathway

1 Introduction
Aplastic anemia (AA), a disease of bone-marrow failure characterized by peripheral pancytopenia and marrow hypoplasia, is caused by the immune-mediated apoptosis of hematopoietic stem/progenitor cells (HSC/HPC) (Young et al., 2008). In China, the annual morbidity of AA is 0.74/1,000,000, with no obvious gender differences. There are two morbidity peak periods of aplastic anemia, one is between 15 and 25 years old, the other is over 60 years old (Liu and Shao, 2018). As a “severe” disorder of the blood system, new and more effective therapeutics are urgently required. The typical pathological features of AA include that the activated CD8+T cells mediate autoimmunity to hematopoietic stem/progenitor cells, which leads to the pathogenesis of bone marrow failure (Hosokawa et al., 2016). Clinically, immunosuppressive therapy (IST) including anti-lymphocyte globulin or anti-thymocyte globulin (ALG/ATG), cyclosporine A (CsA) can be used for AA treatments.
As the absolute number of Tregs decrease in the peripheral system and bone marrow decline, leading to immunosuppression. The proportion and absolute values of Th17 cells in the peripheral blood of patients with AA however, increases (Kordasti et al., 2012). The balance between Tregs and Th17 is key to immune tolerance. The Notch family is a class of highly conserved cell membrane receptors and ligands that act as regulators of gene transcription, which includes 4 receptors, such as Notch1, Notch2, Notch3 Notch4 and 5 ligands, like Jagged1, Jagged 2, DLL1, DLL3, DLL4. Notch components are widely distributed on HSC/HPC, embryonic cells, peripheral lymphocytes, and vascular endothelial cells. Notch signaling regulates T cell functionality, differentiation and the regulation of effector cells (Osborne and Minter, 2007). Hematopoietic stem cells mainly express Notch receptor, while bone marrow mesenchymal cells express Notch ligands, the coordination of which regulates the proliferation and differentiation of HSC/HPCs. Recent studies have shown that Notch regulates T lymphocyte development, during which lymphoid precursor cells (CLPs) entering the thymus receive Notch signals to differentiate into T cells, as opposed to B cells. In the peripheral blood, antigen-presenting cells (APC) transduced with Jagged-1, one of the Notch family ligands, induce the differentiation of primary T cells into Treg cells. Treg cells stably express Notch receptors and ligands, particularly Notch4 and DLL1 that significantly increase after TCR activation. Inhibiting Notch l expression in vitro led to a significant loss of the immunosuppressive effects of Treg cells (Ostroukhova et al., 2006). Regulating Th17 differentiation and the secretion of IL-17 are key to AA therapy (Jiao et al., 2011).
As an active component of dioscinaceae plants, DNS contains a variety of active ingredients of steroidal saponins. DNS has many biological activities including anti-tumor, immune regulation, improved cardiovascular function, and the regulation of metabolism. (Tao et al., 2018). Previous studies have shown that DNS enhances the proliferation of erythroid and granulocyte hematopoietic cells in aplastic anemia mice, restoring bone marrow hematopoiesis (Liu et al., 2015), and regulating the abnormal expression of bone marrow T lymphocytes, leading to immunosuppressive effects (Liu et al., 2013; Yan et al., 2013). However, the mechanisms through which immune balance is regulated remain undefined. Given the requirement of Notch signaling for Treg/Th17 differentiation, we reasoned that it represents a clinical target for AA pathogenesis. We therefore investigated whether DNS regulates Th17/Treg cell balance in AA mice through its effects on Notch signaling.
2 Materials and methods
2.1 Animal and reagents
BALB/c mice (SPF) weighing 20 ± 3 g (n = 90, 8-week-old males) were obtained from the Vital River Laboratory Animal Technology. DNS was purchased from Topsun Science and diluted to 3.744 mg/mL, 7.488 mg/mL, and 14.976 mg/mL in water (Liu et al., 2014). Tripterygium wilfordii polyglycoside tablets (TW) were purchased from Hunan Qianjin Xieli Pharmaceuticals and diluted to 0.936 mg/mL. Cyclosporin A (CsA) was purchased from ZhongMeihuadong and diluted to 2.35 mg/mL in water. Cyclophosphamide was purchased from Baxter Oncology GmbH and diluted to 2.5 mg/mL in saline. Chloramphenicol was purchased from Rongsheng and diluted to 6.25 mg/mL in saline. Rabbit anti- Foxp3, Rabbit anti-RBPJκ, Rabbit anti-RORγt, Rabbit anti-DLL4, Rabbit anti-Jagged1, Rabbit anti-Notch1, and peroxidase -conjugated goat anti-mouse IgG antibodies were provided by Abcam Inc. (USA).
2.2 Animals groups and treatments
Mice were housed at 25 °C and provided ad libitum food and water in 12 h light/dark cycling conditions. Mice received treatments after 7 days of acclimatization. All protocols were approved by our local ethics committee. AA models were established using 137Cs irradiation combined with the intraperitoneal injection of cyclophosphamide (25 mg/kg/d) and chloramphenicol (62.5 mg/kg/d) on the 4th, 5th and 6th days of irradiation. AA models were produced through peripheral hemogram and bone marrow smears and separated into the following groups (ten mice per group): (1) AA Model group lacking treatment; (2) DNS-H/M/Lgroups in which AA mice were treated with High dose DNS/ Medium dose DNS /Low dose DNS; (3) TW group, in which AA mice treated with TW; (4) CsA group, in which AA were treated with CsA; and control mice. Mice in the Control and AA groups were intragastrically given water (10 mL/kg⋅bw); Treatments, once each day, began on days 1, for 14 days. On the 15th day, mice were sacrificed, Bone marrow was then obtained frm the tibia and bilateral femurs. Peripheral blood samples were collected through retroorbital sinus bleeding.
2.3 Smear assessments and peripheral hemograms
Bone marrow smears were assessed through Giemsa-staining. Hemoglobin (HGB) concentrations, white blood cell numbers (WBCs), Reticulocyte cell numbers (RET) and platelet counts (PLTs) were assessed on a XE-2100 Haematology Analyzer (Sysmex, Japan).
2.4 Flow cytometry
Lymphocytes were collected and single cell suspensions were stimulated. For Treg assessments, cells were labeled with anti-CD4-FITC (eBioscience), anti-CD25-APC (BD Bioscience), anti-Foxp3-PE (BD Bioscience) to obtain CD4+CD25+Foxp3+Treg cells. Isotype matched antibodies were included as controls. For Th17 assessments, lymphocytes from the peripheral blood were labeled with anti-CD4-FITC (eBioscience), anti-IL-17A-PE(BD Bioscience). Cells were then washed and Treg and Th17 cytokines in the lymphocytes were assess by flow cytometry (Beam cyte-1026). The software Flowjo(v10) was used to obtain the data.
2.5 qPCR analysis
RNA was TRIzol extracted and cDNA was synthesized. RT-PCRs were performed using LightCycler (ABI PRISM7000) and SYBR RT-PCR kits (Takara). Gene expression was assessed via the 2−ΔΔCT method and normalized to Actin values. Each qPCR was repeated on a minimum of three independent occasions. The primers used in the study were present in Table 1.
Gene
Sequence (5′→3′)
Actin
FOR
GCCCTGAGGCTCTCTTCCA
REV
GCGGATGTCGACGTCACA
Notch1
FOR
GATGGCCTCAATGGGTACAAG
REV
TCGTTGTTGTTGATGTCACAGT
RORγt
FOR
GACAGGGAGCCAAGTTCTCA
REV
GTGCAGGAGTAGGCCACATT
Foxp3
FOR
CCCATCCCCAGGAGTCTTG
REV
ACCATGACTAGGGGCACTGTA
Jagged1
FOR
ATGCAGAACGTGAATGGAGAG
REV
GCGGGACTGATACTCCTTGAG
DLL4
FOR
TTCCAGGCAACCTTCTCCGA
REV
ACTGCCGCTATTCTTGTCCC
RBPJκ
FOR
AGTTGCACAGAAGTCTTACGG
REV
CCTATTCCAATAAACGCACAGGG
2.6 Western blot analysis
Proteins were resolved on SDS–PAGE gels, transferred to PVDF membranes and blocked. Membranes were probed with primary antibodies, such as, anti- Foxp3 (1:1000), anti-RBP-Jκ(1:1000),anti-RORγt(1:1000), anti-DLL4(1:1000), anti-Jagged1(1:1000), anti-Notch1(1:1000), overnight at 4 ℃ and labeled with the indicated HRP-secondary antibodies for 1 h. Protein bands were imaged using the ECL system as previously described (Liu et al., 2016).
2.7 Co-immunoprecipitation
The protein solution, obtained from the spleen of mice, add in cold RIPA lysis buffer, centrifuge at 14,000g 4 °C for 15 min, and transfer the supernatant to new tubes immediately. Firstly, Take a small amount of supernatant for Western blot analysis, and then add 1 ug RBP-Jκ antibody and IgG antibody to the remaining supernatant, and slowly shake it at 4C for incubation overnight; 10 μl protein A/G agarose beads, washed by RIPA lysis, was add into the supernatant incubated with the antibody, and go on incubation for 3 h, in oder to couple the antibody with the protein A agarose beads. After the immunoprecipitation, the agarose beads were centrifuged at 3000 rpm at 4C for 3 mins and the supernatant was carefully sucked off, and the agarose beads were washed 3 times with 1 mL of RIPA lysis buffer; finally, 15 μl of 2 × SDS buffer was added and boiled for 5 min; then collect the supernatant to proceed to SDS-PAGE, western blot analysis.
2.8 Statistical analysis
SPSS 20.0 was used for all data analyses. Values are the mean ± SD. Inter-group differences were compared via a one-way ANOVA. Kaplan-Meier curves were plotted for survival analysis and analyzed through log rank tests. P-values ≤ 0.05 indicated significance differences between the groups.
3 Results
3.1 Effect of DNS on peripheral blood routine of AA mice
The effects of DNS treatment on peripheral blood routine of AA mice are shown in Fig. 1. DNS attenuated pancytopenia in AA mice, and the three dose DNS can raise the counts of WBCs, HGB, PLT, and RET in the peripheral blood, respectively. The AA mouse model was assessed on day 7. The counts of WBCs, HGB, PLT, and RET in the peripheral blood were lower in AA model vs. the control group (p < 0.01) (Fig. 1(a–d)). After two weeks DNS treatments, the number of WBCs, HGB, PLT, and RET in the peripheral blood were re-examined. We similarly observed lower peripheral blood counts in AA model vs. control group (p < 0.05). with the peripheral blood routine of each treatment group increased to varying levels, the counts of WBCs, HGB and PLT from the DNS-M and CsA groups raised more obvious among all groups (p < 0.05) (Fig. 1(e–g)). The RET counts of the DNS-L, DNS-M, DNS-H groups increased vs, the AA model (p < 0.05) (Fig. 1(h)). DNS can really promotes the peripheral blood routine of AA mice, especially the medium dose DNS.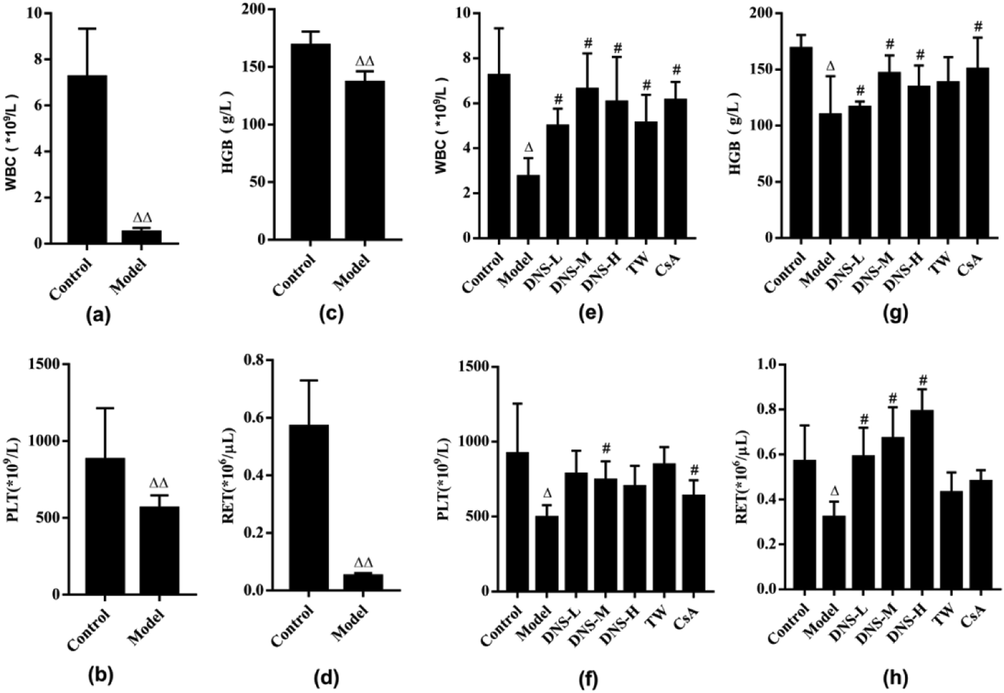
Effects of DNS on peripheral blood routine of AA mice. The counts of WBC, HGB, PLT, RET, in each group were compared after AA model establishment and two-week treatment on AA mice. Comparison of peripheral blood between control group and AA model on day 7 (a–d); two weeks after treatments (e–h). Values expressed as mean ± SD in each group. ΔP < 0.05, ΔΔP < 0.01 vs. control; #P < 0.05, ##P < 0.01 vs. Model group. n = 10.
3.2 Effects of DNS on proliferation of bone marrow cells in AA mice
The effects of DNS treatment on proliferation of bone marrow cells in AA mice are shown in Fig. 2. DNS could increase the number of bone marrow cells and promote the proliferation of bone marrow. The number of nucleated cells in a bone marrow slice image is an important index of the degree of hyperplasia Decreased or severe reductions in bone marrow hyperplasia are an important pathological change. To further demonstrate the successful establishment of the AA mouse model, we observed the changes in bone marrow cell numbers in mice on day 7 of modeling via Wright-Gemsa staining. The number of nucleated cells in the AA model was significantly lower than the control. Based on Figs. 1 and 2(a), it could be considered that the AA mouse model was successfully established. Similarly, two weeks after grouping and administration, the number of nucleated cells in each group showed differences. AA model showed fewer nucleated cells, which indicated diminished bone marrow hyperplasia. Following DNS treatment, DNS-M and CsA groups showed obvious increases the number of nucleated cells in bone marrow, inferring higher curative effects in these groups (Fig. 2(b)).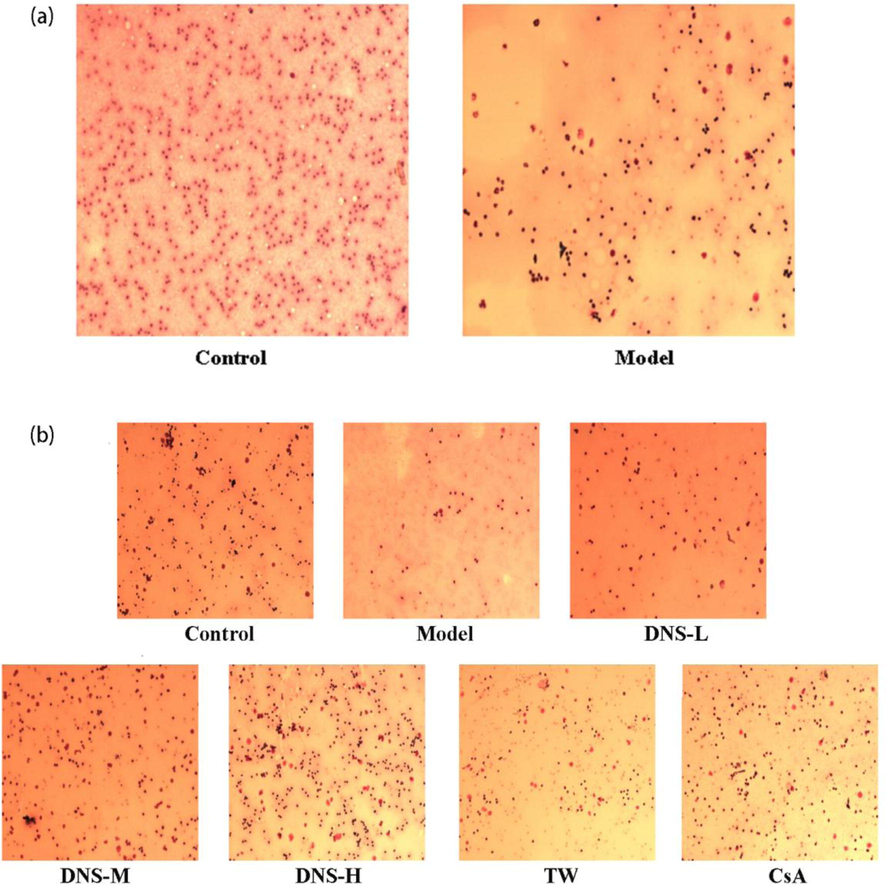
DNS influences bone marrow cell proliferation in AA mice. The number of nucleated cells in each group was detected after AA model establishment and two-week treatment on AA mice (a) Control vs. model groups on day 7. (b) the slice image of bone morrow in each group after two weeks treatment. The number of nucleated cells in bone marrow was assessed via Wright-Gemsa staining. Original magnification × 100. n = 10.
3.3 DNS influences the ratio of Th17/Treg cells in AA mice
As shown in Fig. 3, DNS-M treatment apparently decreased the number of Th17cells, and increased the number of Treg cells, compared with the AA model. Through flow cytometry assessments, the Th17 to CD4+T cell ratio increased (P < 0.01), whilst the Treg to CD4+ T cell ratio declined in AA model, compared to the control. Therefore the Th17/Treg ratio also increased in AA model (P < 0.05). After two weeks DNS treatment, the ratio of Th17 cells in reduced remarkably and the counts of treg cells display a rising trend, compared to AA model, so does the ratio of Th17/Treg cells in the peripheral blood (P < 0.05). The effect of TW and CsA on Th17 cell number and Th17/Treg ratio was consistent with that of DNS, Treg cell numbers were only affected by DNS.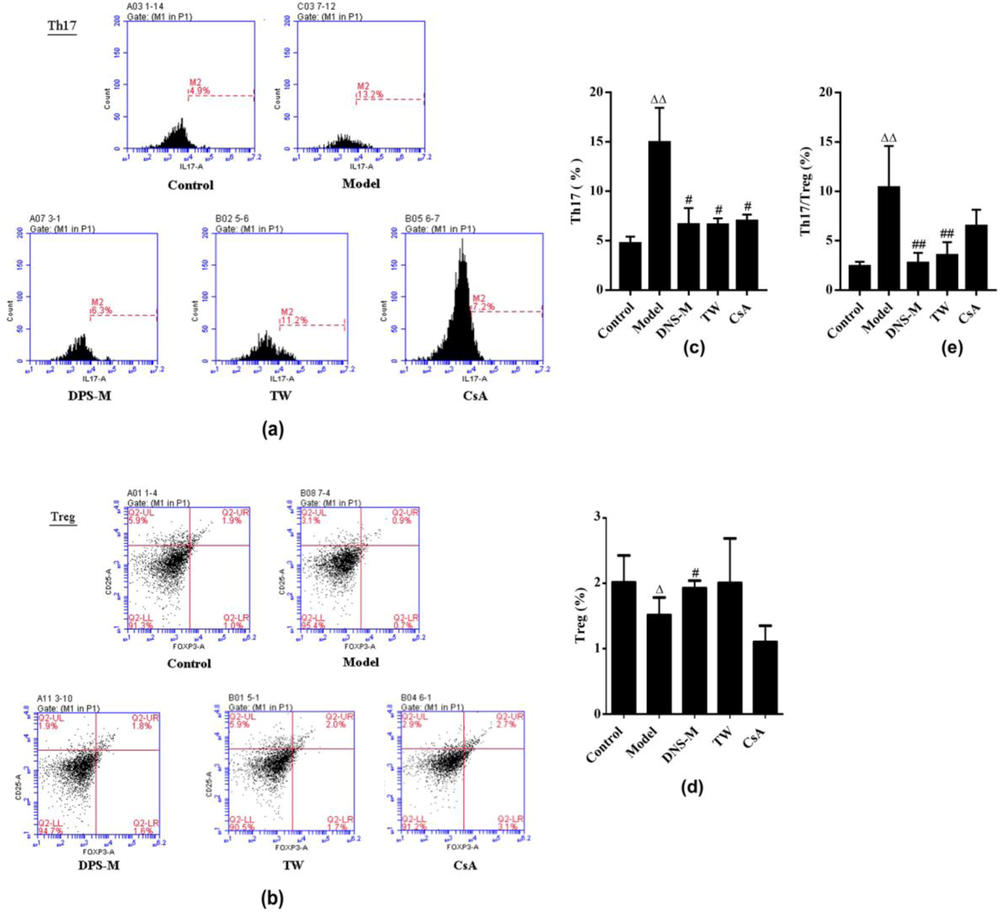
DNS influences the ratio of Th17/Treg cells in AA mice. Flow cytometry assays was used to show the counts of Th17 (a, c) and Treg (b, d) cells in each group after two weeks treatment. the Th17/Treg cell ratio (e) in each group was calculated. Values expressed as mean ± SD in each group. ΔP < 0.05, ΔΔP < 0.01 vs. control; #P < 0.05, ##P < 0.01 vs. Model group. n = 3.
3.4 Effects of DNS on Notch signaling through qRT-PCR analysis
To determine whether DNS-M interferes with the Th17/Treg cell balance in AA mice through Notch signaling, we assessed the expression of Notch components through qRT-PCR analysis of spleen samples. As shown in Fig. 4(a–h), DNS-M treatment increased the relative expression of gene Foxp3, Notch1 and Jagged1, and decreased the expression of gene DLL4, compared with the AA model. RORγt and DLL4 mRNA levels in the spleens of AA model increased over the control group (P < 0.01). In response to DNS, RORγt and DLL4 expression declined (P < 0.05). The levels of Foxp3, Notch1 and Jagged1 mRNA in the spleens of the model group were lower than the control group (P < 0.01). Following DNS treatment, the expression of these components generally recovered (P < 0.05). RBPJκ mRNA levels were comparable in all groups (P > 0.05). We next verified the transcriptional changes of Notch signaling components at the protein level.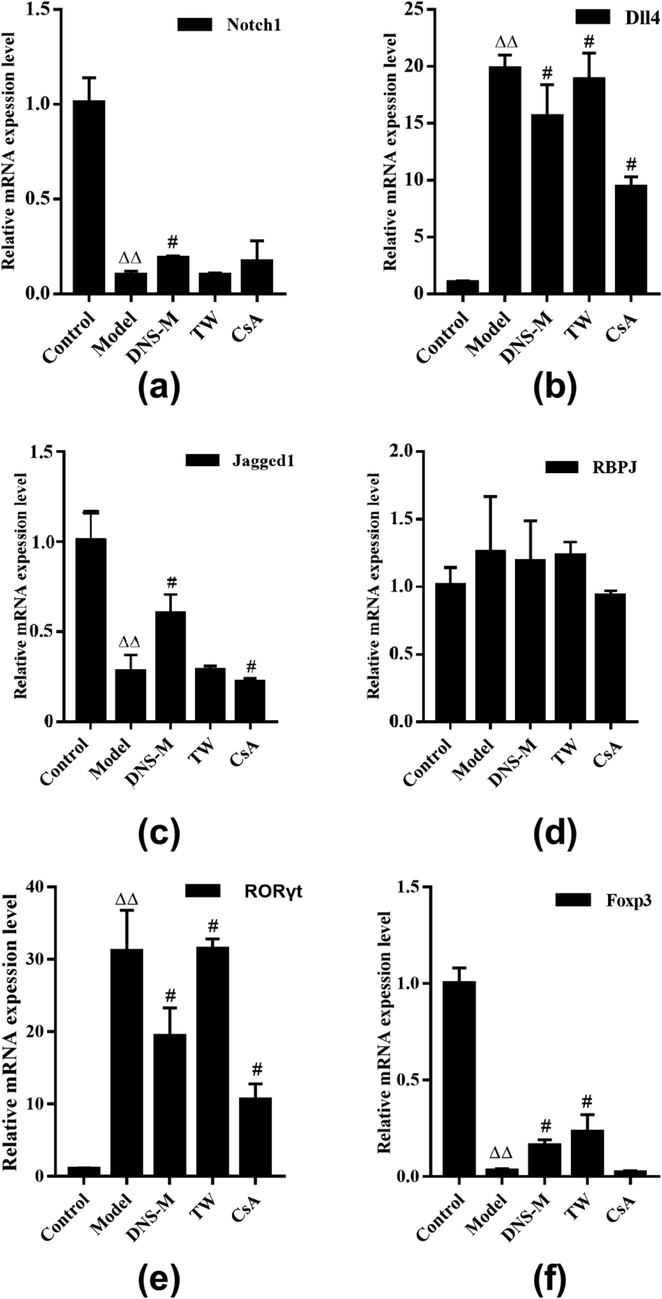
Effects of DNS on the Notch Signaling Pathway. The relative expression of gene Notch1 (a), Dll4 (b), Jagged1 (c), RBPJκ (d), RORγt (e) and Foxp3 (f) in the spleen of each group were on a detection after two weeks treatment. Values expressed as mean ± SD in each group. ΔP < 0.05, ΔΔP < 0.01 vs. control; #P < 0.05, ##P < 0.01 vs. Model; n = 3.
3.5 Effects of DNS on Notch signaling through western blot analysis
As shown in Fig. 5(a–h), DNS-M treatment increased the relative expression of protein Foxp3, Notch1 and Jagged1, and decreased the expression of protein DLL4, compared with the AA model. The relative expression of RORγt and DLL4 at the protein level were higher in the model vs. control group (P < 0.01). The relative expression of these Notch components differed in each DNS treatment group, in which RORγt and DLL4 showed the most significant decreases (P < 0.05). Foxp3, Notch1 and Jagged1 expression in the model group also significantly declined. The relative expression of these Notch components differed in the DNS vs. the model group. Amongst them, Foxp3, Notch1 and Jagged1 expression in the DNS-M group increased (P < 0.05). RBPJκ levels again showed no differences between the groups, (P > 0.05).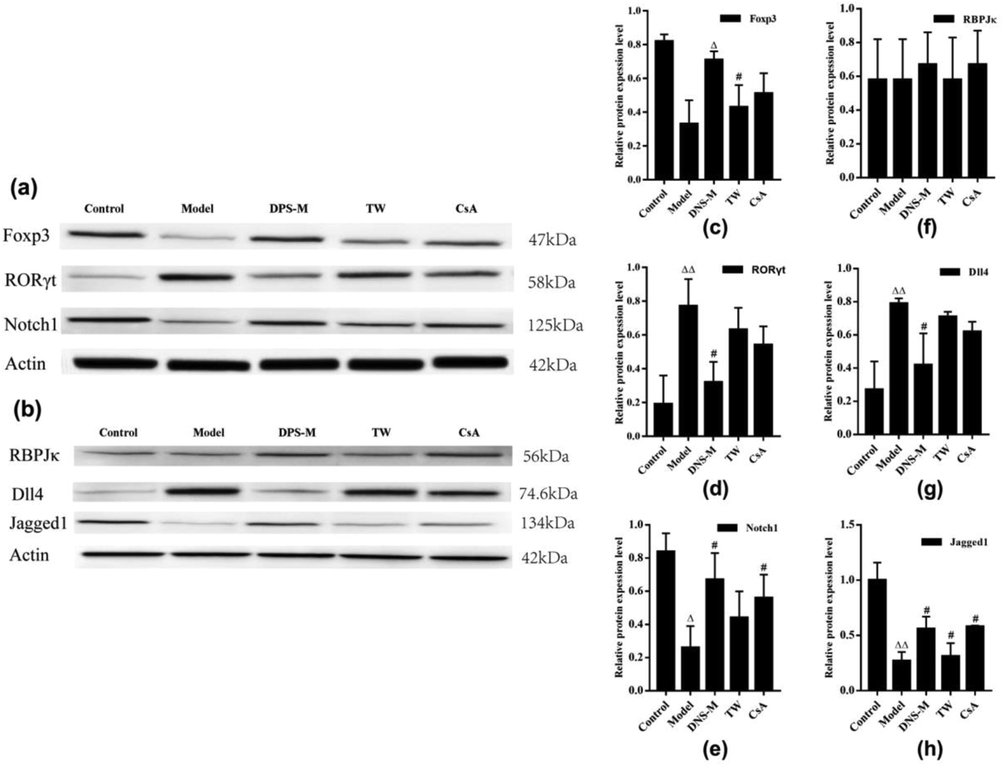
Effects of DNS on the expression of Notch ligands in the spleens of mice through western blot analysis. The expression of protein Notch1, Dll4, Jagged1, RBPJκ, RORγt and Foxp3 in the spleen of each group were on a detection by weatern blot after two weeks treatment. Values expressed as mean ± SD in each group. ΔP < 0.05, ΔΔP < 0.01 vs. control; #P < 0.05, ##P < 0.01 vs. Model; n = 3.
3.6 Effect of DNS on the binding capacity of RBPJκ and RORγt, RBPJκ and Foxp3 protein in the spleens of mice from each group
As shown in Fig. 6, DNS-M treatment could prevent the binding of RBPJκ to RORγt and promote the binding of RBPJκ to Foxp3, compared with the AA model. Co-immunoprecipitations were performed to assess the binding of RBPJκ to RORγt, and the binding of RBPJκ to Foxp3. The levels of RBPJκ and RORγt binding increased in the model group, whilst the binding of RBPJκ to Foxp3 declined (P < 0.05). In the DNS-M group, the interaction of RBPJκ with RORγt decreased, whilst RBPJκ and Foxp3 binding increased (P < 0.05). The interactions of these Notch components were comparable between the DNS-M and CsA groups (P > 0.05) These data further highlighted that DNS regulates Th17 RORγt and Treg Foxp3 through Notch signaling.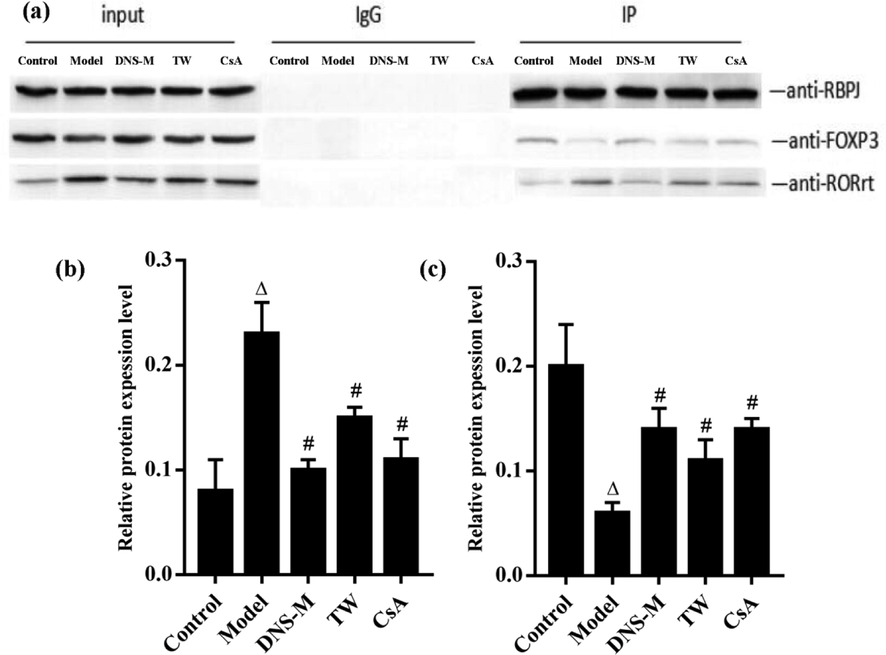
Effects of DNS on the Binding Capacity of RBPJκ and RORγt, RBPJκ and Foxp3 in the spleen of mice in each group. Binding of RBPJκ and RORγt during Notch signaling and binding of RBPJκ to Foxp3 were assessed through co-immunoprecipitations in the spleen of each group after two weeks treatment. Values expressed as mean ± SD in each group. ΔP < 0.05, ΔΔP < 0.01 vs. control; #P < 0.05, ##P < 0.01 vs. Model; n = 3.
4 Discussion
Aplastic anemia is caused by the hyperfunction of some activated CD8+T cell and the destruction with bone marrow as the main target organ, resulting in bone marrow hematopoietic failure syndrome (Young et al., 2008). Emerging evidence suggests that the number and function of Th17/Treg in CD4+T cells mediate the physiological processes of AA. Th17 cell numbers in the bone marrow and blood of AA patients were found to be elevated, whilst the number of Treg cells were low and generally dysfunctional (Liu et al., 2015). The major manifestations of AA include elevated IL-17, IL-21, TNF- and other cytokines secreted by Th17 cells that mediate pro-inflammatory responses. IL-17 and TNF inhibit hematopoietic cell functions through the stimulation of intracellular death pathways that induce apoptosis (Chen et al., 2006; Broxmeyer et al., 2006). Treg cells have immunosuppressive properties, mainly in inhibiting the production of CD4+T cells, CD8+T cells and related cytokines. The study found that Treg cells in aplastic anemia patients cannot effectively inhibit IFN-γ produced by T cells, which leads to destruction of bone marrow cells (Shi et al., 2012). In this study, the number of Th17 cells in the peripheral blood of AA mice increased, the ratio of CD4+T cells decreased, the ratio of Th17/Treg cells increased, and the number of Th17/Treg cells was abnormal, all of which would contribute to AA.
DNS is the main pharmacological component of the dioscinaceae plant, also known as “Chuanshanlong”. In previous clinical applications and animal experiments, DNS were found to significantly improve and maintain the peripheral blood of AA mice by inhibiting T cell hyperfunction and promoting bone marrow cell proliferation (Wang et al., 2015). The dose of DNS that was most effective was 74.88 mg/kg/d (Liu et al., 2015; Liu et al., 2014). We observed that WBCs, HGB, and PLT in the peripheral blood of DNS groups were higher than AA model groups in which larger numbers of bone marrow cells were observed, in a manner comparable to CSA treatment.
The Notch family are a conserved class of transmembrane signaling proteins that regulate the development of multicellular organisms that are widely expressed on CD4+T cells (Li et al., 2017). Under physiological conditions, Notch signaling regulates the immune response according to the specific environment of the body to maintain the immune homeostasis in vivo; under pathological conditions. CD4+T cell differentiation, proliferation and function are regulated by direct or indirect mechanisms, and thus participate in the occurrence and development of various autoimmune diseases and tumor development. Ligands on the cell surface (Jagged1-2, DLL1, 3, 4) bind to the corresponding Notch receptor (Notch1-4). Under the action of three hydrolases, the Notch intra Cellular domain (NICD) is released from the transmembrane segment of the receptor, which translocate to the nucleus to interact with CBF-1, Suppressor of hairless, Lag (CSL) and recruits transcriptional activators such as MAML and p300 to activate the expression of several proteins such as Hes1, Hey1 and Hey2, so as to promote cell proliferation or differentiation (Shang et al., 2016). CSL, also known as RBPJκ in mammals, is a transcriptional repressor that inhibits Notch signaling through binding to NICD. The proliferation of peripheral blood CD4+T cells in RBPJκ knockout mice decreased, indicating that Notch signaling promotes T cell proliferation (Ahmed et al., 2014). Others have shown through chromatin immunoprecipitation experiments that the NICD is recruited to RBPJκ binding elements and binds to Th1, Th2, Th17, Treg enhancers, to promote both their expression and activation (Amsen et al., 2015). Li et al. found that the Notch/RBPJκ/Foxp3/RoRγt signaling axis mediates the recovery and functional balance of Th17/Treg cells in AA mice (Li et al., 2017). In this study, we found that DNS increases the expression of Notch1 and Foxp3 in AA mice, decreases the expression of DLL4, Jagged1, and RORγt, and increases the binding of RBPJκ to Foxp3, leading to reduced RBPJκ and RORγt binding. This indicated that the Notch/RBPJκ/Foxp3/RORγt axis might be involved in the AA pathogenesis and contribute to the imbalance of Th17/Treg cells in AA mice. In summary, RBPJκ within the Notch signaling pathway directly binds to RORγt and Foxp3, and DNS regulates Notch/RBPJκ/RoRγt/Foxp3 signaling in AA mice to reduce the number of Th17 cells and weaken RORγt expression. DNS also increases the number of Treg cells and the expression of Foxp3 to improve the Th17/Treg cell balance, and promote the recovery of immune homeostasis and hematopoietic function.
5 Conclusions
We demonstrate that DNS could restore the Th17/Treg balance in aplastic anemia mice through Notch/RBPJκ/FOXP3/RORγt signaling. However, DNS may represent a therapeutic target in AA, but the clinical utility and the clear mechanism requires further investigation.
Data availability
The datasets used and analysed during the current study are available from the corresponding author on reasonable request.
Acknowledgments
This study was supported by the National Natural Science Foundation of China (no. 81774062) and Tianjin Medical University General Hospital encubation founding (no. ZYYFY2017031).
Declaration of Competing Interest
The authors declare that they have no known competing financial interests or personal relationships that could have appeared to influence the work reported in this paper.
References
- Memory stem T cells in autoimmune disease: high frequency of circulating CD8+ memory stem cells in acquired aplastic anemia. J. Immunol.. 2016;196(4):1568.
- [Google Scholar]
- Functional characterization of CD4+ T cells in aplastic anemia. Blood. 2012;119(9):2033-2043.
- [Google Scholar]
- Notch signalling during peripheral T-cell activation and differentiation. Nat. Rev. Immunol.. 2007;7(1):64-75.
- [Google Scholar]
- Treg-mediated immunosuppression involves activation of the Notch-HES1 axis by membrane-bound TGF-beta. J. Clin. Investig.. 2006;116(4):996-1004.
- [Google Scholar]
- Engagement of activated Notch signalling in collagen II-specific T helper type 1 (Th1)- and Th17-type expansion involving Notch3 and Delta-like1. Clin. Exp. Immunol.. 2011;164(1):66-71.
- [Google Scholar]
- Dioscin: a diverse acting natural compound with therapeutic potential in metabolic diseases, cancer, inflammation and infections. Pharmacol. Res.. 2018;137:259-269.
- [Google Scholar]
- Study on dioscorea saponin regulating immune co-stimulatory molecule in aplastic anemia. China J. Tradit. Chin. Med. Pharmacy. 2015;30(12):4441-4443.
- [Google Scholar]
- Effect and mechanism of bushen huayu huoxue therapy on aplastic anemia. Tianjin J. Tradit. Chin. Med.. 2013;30(3):131.
- [Google Scholar]
- Effect of dioscin on the expression of caspase-3 caspase-8 protein in aplastic anemia mice. J. Sichuan Tradit. Chin. Med.. 2013;10:45-47.
- [Google Scholar]
- Mechanism study on the inhibition of Dioscorea nipponica Makino saponin to the aplastic anemia p-mTOR / p-S6. Chin. J. Basic Med. Tradit. Chinese Med.. 2014;20(12):1637-1641.
- [Google Scholar]
- Effects of guchang capsule on dextran sulphate sodium-induced experimental ulcerative colitis in mice. Evid. -Based Complement. Alternative Med.. 2016;2016(3):1-12.
- [Google Scholar]
- Significance of Th17/Treg cell imbalance in the immunological pathogenesis and treatment of childhood aplastic anemia. Chin. J. Pediatr.. 2015;52(12):927-931.
- [Google Scholar]
- TNF-α-induced programmed cell death in the pathogenesis of acquired aplastic anemia. Expert Rev. Hematol.. 2006;8(4):515-526.
- [Google Scholar]
- The IL-17 cytokine family members are inhibitors of human hematopoietic progenitor proliferation. Blood. 2006;108(2):770.
- [Google Scholar]
- Intrinsic impairment of CD4(+)CD25(+) regulatory T cells in acquired aplastic anemia. Blood. 2012;120(8):1624.
- [Google Scholar]
- Effects of the total saponins from dioscorea nipponica on immunoregulation in aplastic anemia mice. Am. J. Chin. Med.. 2015;43(02):289-303.
- [Google Scholar]
- In patients with chronic aplastic anemia, bone marrow–derived MSCs regulate the Treg/Th17 balance by influencing the Notch/RBP-J/FOXP3/RORγt pathway. Sci. Rep.. 2017;7:42488.
- [Google Scholar]
- Role of Notch signaling in regulating innate immunity and inflammation in health and disease. Protein Cell. 2016;7(3):159-174.
- [Google Scholar]
- Abrogation of Rbpj attenuates experimental autoimmune uveoretinitis by inhibiting IL-22-producing CD4+ T Cells. PLoS ONE. 2014;9(2):e89266
- [Google Scholar]
- Notch in T cell differentiation: all things considered. Trends Immunol.. 2015;36(12):802-814.
- [Google Scholar]


