

Translate this page into:
Development of convolutional neural network-based QSAR model to predict cardiotoxicity and principal component analysis, fingerprint analysis
* Corresponding author E-mail address: sauravmtech2@gmail.com, smallik@arizona.edu (S. Mallik); kanadray00@gmail.com (K. Ray)
-
Received: ,
Accepted: ,
Abstract
Small chemicals that block a potassium ion channel result in a prolonged QT interval, which can have serious cardiotoxic effects and is a major factor in drug development failures. To develop the drug successfully, quantitative prediction of human-ether-a-go-go-related (hERG) blockers is essential for designing drug candidates without the risk of cardiotoxicity. We built a convolutional neural network (CNN)-based quantitative structure–activity relationships (QSAR) model to predict cardiotoxicity. The statistical parameters of mean squared error (MSE) were 0.001, the mean absolute error (MAE) was 0.016, and the correlation coefficient (Q2) was 0.99 for the training dataset. The MSE was 0.62, the MAE was 0.65, and the predicted correlation coefficient (R2) was 0.70 for the test dataset. Further, we explored principal component (PC) analysis, t-SNE, scaffold analysis, active cliff, fingerprint analysis and chemical analyses to identify molecular similarity. We discovered that adding an acidic oxygen/aliphatic oxygen (hydroxyl group) reduces hERG inhibition and increases lipophilicity. The fragments are furan, sulfonamide, methanesulfonamide, p-chlorophenyl, p-fluorophenyl, and ethyl(heptyl)amino groups increased the hERG risk. Finally, we conclude that the QSAR model in combination with the convolutional neural network (CNN) offers a potentially novel approach for quantitatively predicting the cardiotoxicity of drug candidates.
Keywords
Activity Cliff Analysis
Cardiotoxicity
Chemical Analysis
CNN
hERG Potassium Ion Channel Blocker
Human Ether-à-go-go-Related
Fingerprint Analysis
Molecular Similarity
PCA
QSAR
t-SNE
Scaffold Analysis

1. Introduction
Cardiotoxicity brought on by drug-induced blockage of potassium ion channel, which plays a significant role in cardiac action potential, involves the gene that encodes Kv11.1 and is connected to the human ether-a-go-go (hERG) (Sanguinetti et al., 1995; Shan et al., 2022). Severe cardiotoxicity, including cardiac arrhythmia, will result from blocking this hERG potassium ion channel. This will lengthen the medical term (QT) interval, which causes cardiac arrhythmias and sudden death. Some drugs lead to cardiotoxicity, so medicines have been withdrawn from the market. In the process of developing new drugs, ensuring drug safety has grown more demanding and challenging. Recent years have seen a significant increase in the removal from the market due to the toxicity of several medications that were tested in clinical studies. Some of these drugs, including pimozide, terfenadine, grepafloxacin, cisapride, astemizole, and sertindole, exhibit cardiotoxicity (Meng et al., 2021). Experimental bioassays of hERG are available to evaluate the inhibitory activity of unknown molecules. Computationally predicting hERG inhibition in early drug development stages is a big challenge for us. Over the past decade, much research has reported such quantitative structure–activity relationships (QSAR) (Ekins et al., 2002). Many researchers have applied machine learning (ML) algorithms to predict hERG activity. Siramshetty et al. applied neural networks, random forest, and support vector machine (SVM) (Siramshetty et al., 2018). Creanza et al. predict hERG-related cardiotoxicity using SVM and molecular docking (Creanza et al., 2021). Meng et al. employed five different features and ML algorithms on hERG potassium channel dataset for chemical cardiotoxicity prediction (Meng et al., 2021). Cai et al. employed a deep learning-based classification model on the hERG dataset (Cai et al., 2019). Shen et al. built a directed message-passing neural network to classify hERG channel blockers (Shan et al., 2022). Lanevskij et al., applied the XGBoost method to predict hERG inhibition (Lanevskij et al., 2022). Delre et al., built a ML model using a random forest, k-nearest neighbor, to classify hERG-related cardiotoxicity (Delre et al., 2022). Ryu et al. proposed a computational framework that classifies molecules as hERG blockers and non-blockers (Ryu et al., 2020). Traditional methods for cardiotoxicity prediction are costly and time-consuming. Therefore, it is necessary to develop a new approach to predict cardiotoxicity in the early stage of drug development. Lee et al. developed a web server to predict drug candidates that do not cause cardiotoxicity (Lee et al., 2019). Hu et al. developed a novel molecular graph convolution neural network (CNN) model for cardiotoxicity prediction. Sato et al. built an hERG regression model using support vector regression (Sato et al., 2021). Tobita et al. developed a classifier model constructed using the SVM method for hERG inhibitors (Tobita et al., 2005). Du et al. analyzed chemical motifs for hERG inhibitors (Du et al., 2015). Keseru et al. developed a traditional and hologram QSAR model for predicting hERG potassium channel affinities (Keseru et al., 2003). Zhang et al. employed various ML methods to predict hERG potassium channel blockage based on the patch clamp method’s descriptors and fingerprints on a dataset on mammalian cell lines (Zhang et al., 2016). However, most of these models built with ML for the classification of hERG blockers are inappropriate for quantitative prediction. We have focused our attention on developing a deep learning-based QSAR model and chemical analysis of chemical structure. Springer et al. conducted a fingerprint pair analysis of hERG inhibitors in the Novartis internal database (Springer et al., 2013). The structure-activity landscape index (SALI) method for pair analysis uses fingerprints to identify similar pairs (Guha et al., 2008). SALI is also used for activity cliff analysis. Choi et al. studied on 5299 hERG inhibitors using chemical fingerprint analysis and ML and deep learning algorithms for binary classification (Choi et al., 2020).
While traditional drug development methods have been studied extensively, the toxicity problem remains challenging. In the computational approach, deep learning and ML have successfully performed tasks such as classification models. However, the field faces some challenges. While predicting molecules using a regression model, it is unclear how to quantitatively predict a classification model and which part of fingerprints is responsible for biological activity. In this paper, we address some of these limitations by chemical analysis and regression problems.
Chemical space analysis is the most efficient technique for identifying new drug candidates due to the assumption that the same chemical structures would produce similar biological effects. Techniques like t-distributed stochastic neighbor embedding (t-SNE) and principle components analysis (PCA) can be applied (Naveja et al., 2019). PCA makes mapping deterministic and easy. This method disregards how nonlinear features interact with one another.
We proposed CNN architecture on the experimental dataset, which can quantitatively predict the cardiotoxicity of unknown molecules. QSAR is integrated with CNN. The molecular descriptors used in the QSAR model provide details on the physical and chemical structure of the chemical. Following the entry of these descriptors, the CNN framework is used to train a trustworthy and stable model and, eventually, predict the biological activity of hERG blockers. In this study, we determined PCA and t-SNE, chemical space, activity cliff, molecular fingerprint similarity, and scaffolds responsible for blocking the hERG potassium channel.
2. Materials and methods
2.1 Data collection
We collected hERG blockers with IC50 values from the publicly available cHEMBL database (CHEMBL829152) (https://www.ebi.ac.uk/chembl/assay_report_card/CHEMBL829152/). In the dataset, there are 73 chemicals in total. Data were curated by removing incorrect smile formats, conversion of IC50 to pIC50 values, and conversion of smile format to 3D SDF format. We finally obtained 71 compounds for further processing. We changed the IC50 value into the pIC50 value because the data points for IC50 values might not have been spread equally. pIC50 value is a negative logarithmic value of IC50, which is computationally calculated using an aggregate function. The pIC50 values after transformation fell between 4.82 and 8.0. Using the CORINA software, we added hydrogen atoms to 2D structures to make them 3D (Sadowski et al., 1994).
2.2 Descriptor calculation
Molecular descriptors are the physical and chemical characteristics of a compound and are employed to connect biological functions to structure. We converted the 1D structure into a 3D vector that contained critical physical and chemical structural data. Here, we generated molecular descriptors using the PowerMV tool (Liu et al., 2005) and got 147 binary vectors of pharmacophore fingerprint and 24 weighted burden descriptors. Further, we applied PCA and reduced these descriptors into eight principal components (PCs) descriptors and two 2D t-SNE descriptors. Using a random selection, we divided 85–15% of the train-test subsets’ findings into 60 compounds for the training dataset and 11 for the test dataset.
For the model development, we calculated 40 properties of molecules, such as cLogP, where P is ratio of octanol/water; cLogS, where S is water solubility in mol/I, pH=7.5, at 25°C temperature, relative polar surface area, total surface area, topological polar surface area, H-donors, H-acceptors, non-hydrogen and carbon hydrogen atom count, metal atom count, electronegative atom count (As, Br, Cl, F, I, N, O, P, S, Se), stereo center count, rotable bond count, ring closure count, sp3-atom count, systemic atom count, small ring count with or without hetero atoms, small fully saturated ring count, small non-aromatic ring count, aromatic ring count, small saturated carbo-ring count, small carbo-non aromatic ring count, carbo aromatic ring count, small hetero non aromatic ring count, hetero aromatic ring count, functional groups: amide nitrogen, amine, alkyl-amine, aryl amine, aromatic nitrogen atom, basic nitrogen, acidic oxygen, stereo isomer count and relation, 3D: globularity (linear<0.5<spherical), Globularity (non-spherical<0.9<spherical, solvent excluded surface area using VDW-radii and 1.4 Å probe, molecule volume inside solvent excluded surface using VDW-radii and 1.4 Å probe for, PCA and t-SNE analysis using DataWarrior tools.
2.3 QSAR model
We used a CNN architecture, which is very effective and frequently used for drug prediction. We used Python 3.6, a deep learning package called Tensorflow (https://www.tensorflow.org), and Keras (https://keras.io/) for model development. In order to more accurately predict biological activity (pIC50 values), a rigorous iteration procedure is required. The hyperparameters, such as hidden layers, number of epochs, activation function such as rectified linear unit (ReLU), output layer, dense layer, and model optimizer stochastic gradient descent (SGD) were optimized. As loss functions, we employed the mean absolute error (MAE) and mean squared error (MSE). The performance of the model was assessed using the MSE and MAE measures.
Input vector: Chemical compound descriptors matrix 60*51 are used as input vectors for QSAR model. In this case, the whole input vector (descriptors are 51 in length while the hidden state at each step is 71 in length) loads and produces outputs that fed to the convolutional layer.
Convolutional layer: The basic CNN architecture is composed of three consecutive sequential layers called convolutional layers of the network in order from input to output.The convolutional layer uses a filter to reduce feature maps, and its hyper-parameters help reduce feature size and stride. We used a 1x1 kernel size and applied the ReLU activation function. Similarly, this procedure is repeated for two other layers with 128 and 256 output channels.To improve the compound’s biological activity (pIC50 value) prediction, our proposed QSAR model has three convolutional layers, two fully connected layers, and one output layer, as shown in Fig. 1.
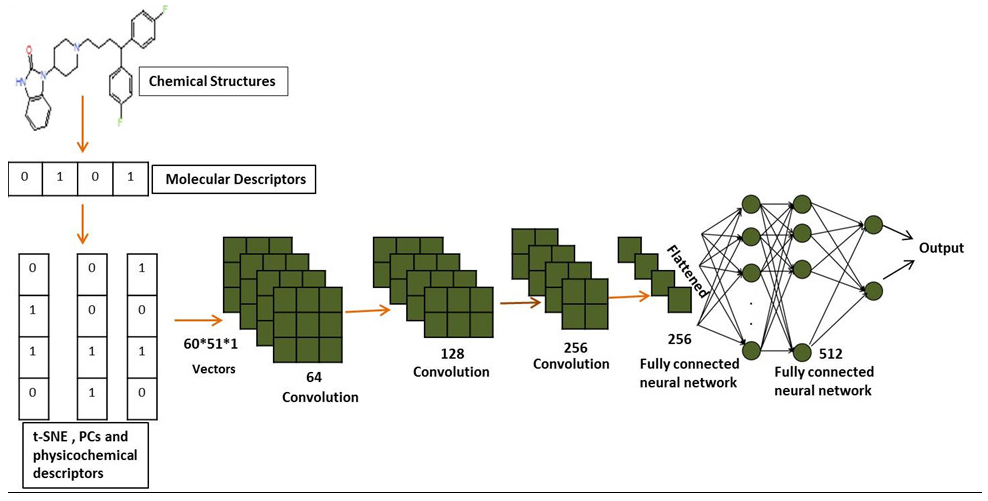
- CNN architecture for QSAR model of hERG potassium channel blockers.
2.4 ReLU
The rectified linear activation function in CNN model has the highest non-saturation level (ReLU). To shorten the training time, the convergence of SGD is accelerated. If no negative input is provided, the function returns zero; otherwise, it returns a positive integer. You can express it in Eq. (1) as follows:
where f(x) is the ReLU function and x is the input to a neuron.
2.5 Model validation and evaluation metrics
Validating the model and assessing its predictive capability with statistical parameters are critical steps in developing a QSAR model. The dataset is randomly divided into 85% training dataset for model development and 15% test dataset for model validation. A QSAR model is constructed using the training data. External performance can be assessed using the validated bioactivity of the test dataset, whereas internal performance is frequently used to validate the bioactivity of the training dataset. The MSE and MAE values were used to calculate the difference between expected and experimental activity. The correlation coefficient (Q2), predicted correlation coefficient (R2), root MSE (RMSE), MSE, and MAE were used to evaluate the QSAR model’s performance. The Q2 varies between 0 and 1. A good model has Q2s close to one and low RMSE, MSE, and MAE values. The best epoch was used to predict the bioactivity of unidentified compounds.
2.5.1 Q2
By predicting a molecule’s biological activity after it has been eliminated from the training set, the model’s accuracy is examined. Until each molecular biological activity in the training dataset has been predicted once, this phase is repeated. Equation is used to determine the internal validation, Q2 (2).
where, yi is the actual and is predicted values of the ith molecule in the training dataset. ymeans is the average activity of all the compounds in the training dataset (Kumari et al., 2016; Steyerberg et al., 2003).
2.5.2 R2
External validation was performed on the test dataset’s molecules by calculating the R2 value using the Eq. (3):
where, yi is the actual and is predicted activities of the ith molecule in the test set. ymeans is the average activity of all the compounds in the test set.
2.5.3 Root mean square
Eq. (4) defines RMSE as the standard deviation of the prediction errors.
2.5.4 MSE
The MSE is the average of the difference in squares between the original values in the dataset and the predicted values. The residuals’ variance is calculated (Pal R, 2017). MSE is defined in Eq. (5) as follows:
where, is actual and is predicted values.
2.5.5 MAE
The average absolute difference between the dataset’s actual and predicted values is measured by the MAE. It computes the average of the testset. Eq. (6) defines the MAE as follows:
where, is the predicted value of yi.
2.6 Chemical space visualization
Chemical space visualization is a technique for plotting 2D or 3D molecular structures according to a predetermined set of characteristics. We employed the visualization techniques PCA and t-NSE to give a visual depiction of the chemical space of molecules. By geometrically projecting descriptor dimensions onto smaller sizes, PCA reduces their size (PC). The first PC (PC1) is selected to maximize projected point variation while minimizing the overall distance between the projected points and the data points. We employed the t-SNE method to reduce the dimension of the molecule’s descriptors. This method uses the Gaussian probability distributions. The low-dimensional space clusters in the embedding space because it maintains its pairwise molecular similarity to the high-dimensional space without significantly losing structural information.
We calculated t-SNE for the chemical space analysis of subsets of the chemical compounds from the dataset of hERG inhibitors. The t-SNE parameters are complexity 10, dimensions 50, and 1000 iterations.
Further, we conducted chemical space research to assess SAR and assist in locating fingerprint pairs of the 71 compounds. This strategy was put into practice by carefully analyzing the top ten PCs, which explain 99.99% of the variance. The subsets were identified, and the chemical similarity at the fragment level was evaluated using activity cliff and scaffold analysis.
2.7 Activity cliffs analysis
Small structural modifications known as “activity cliffs” are linked to surprisingly substantial variations in biological activity. Activity cliffs are a timely and illuminating investigation of the SAR since they identify specific, minute structural alterations that dramatically affect biological activity. To find probable activity cliffs in the dataset, the DataWarrior tool was used to calculate activity cliffs between 2D and 3D t-SNE using three locations corresponding to the pIC50 value.
Activity cliff or activity landscape methods are 2D scaling processes of the chemical space, all involved molecules are positioned such that similar molecules are located close to each other. We used the first two components of a descriptor of the molecules as coordinates in a PCA to scale the data. It also detects SAR between molecules. Every fingerprint pair of molecules that is comparable is subjected to similarity analysis. It is also known as the SALI. Activity cliffs are molecules that exhibit a sudden change in activity despite sharing a relatively comparable structure. To create new structural motives with better activities, it is important to understand the links between structure and activity. These pairs are particularly relevant in this regard. SALI values and activities are encoded in marker size and marker color, respectively, in the similarity view that is produced after an activity cliff analysis.
2.8 Scaffold analysis
Chemical scaffolds are an essential component of chemical structures. Scaffolding enhances pharmacokinetic and biological properties, as well as the dependability of bioactive compounds, SAR studies, and other studies. The Markush structure was first developed by Eugene A. M. (Markush, E. 1924). The two different kinds of scaffolding are structural and functional. A functional scaffold has elements that interact with the target. Even though the structural scaffold supports exit vectors in the proper geometries, interacting moieties can be inserted to embellish the scaffold (Brown N., 2013). The Murcko framework is a second illustration of scaffolding that was put up by Bemis and Murcko. (Bemis et al., 1996).
We used the Datawarrior tool to perform the scaffold analysis. Three scaffolding techniques were employed: the Plain Ring System, the Ring with Atomic No Substitution, and the Murcko scaffold.
3. Results and discussion
We developed a QSAR model to quantitatively predict the cardiotoxicity of unknown molecules that block the hERG potassium channel. We retrieved 73 chemical structures with accompanying IC50 values prior to modeling. After the data curation process, we obtained 71 molecules. We generated fingerprints, weighted burdens, 2D t-SNE, and PCA features that characterize the structural and functional requirements to construct a QSAR model that can be used to predict the bioactivity of drugs in an unknown dataset. After being trained on the first 85% of the randomly split set, the model was verified on the final 20% of the dataset. The results indicated good predictive capacity based on approaches for internal and external validation. For the CNN architecture and number of neurons, hidden layers, activation functions, and QSAR model, measures of efficiency and performance were investigated. The results indicate that it could be possible to predict the bioactivity of a significant database using this model. The MSE of QSAR models was determined using various loss function settings. The change in MSE values versus the values of the loss function has been plotted in Fig. 2. As demonstrated in Fig. 3, obtaining robust and good performance slowly converged with each epoch increment. Eventually, it varied, despite the MAE loss curves of the training and test datasets showing a more convergence pace during the first 50 epochs. As a result, predicting the activity of molecules requires less training time for a model. The value of pIC50 of the training and test datasets was calculated using the QSAR model. For the training dataset, MSE was 0.001, MAE was 0.016, Q2 was 0.99 for the training dataset. For the test set, the MSE was 0.62, the MAE was 0.65, and the R2 was 0.70. The R2 value showed that the model had outliers; the range of IC50 values was from 10 nM to 1412537 nM. The scatter plot of the experimental versus predicted values for the training and test datasets has been shown in Figs. 4 and 5, respectively.
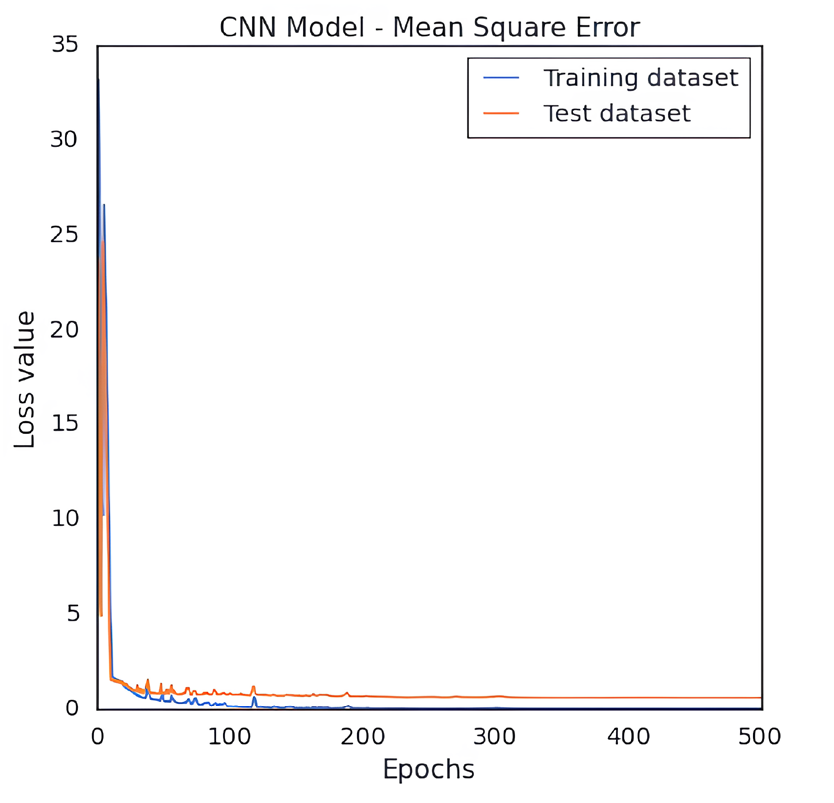
- Plot of CNN based QSAR model’s MSE loss value for the training and test dataset of hERG potassium channel blockers versus the quantity of training epochs.
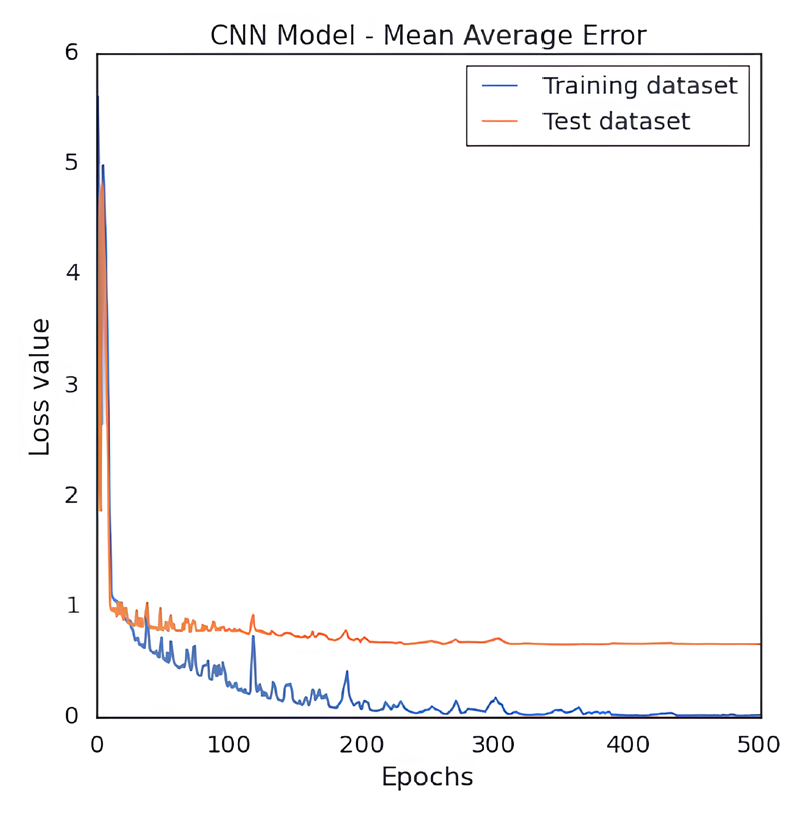
- Plot of CNN based QSAR model’s MAE loss value for the training and test dataset of hERG potassium channel blockers versus the quantity of training epochs.
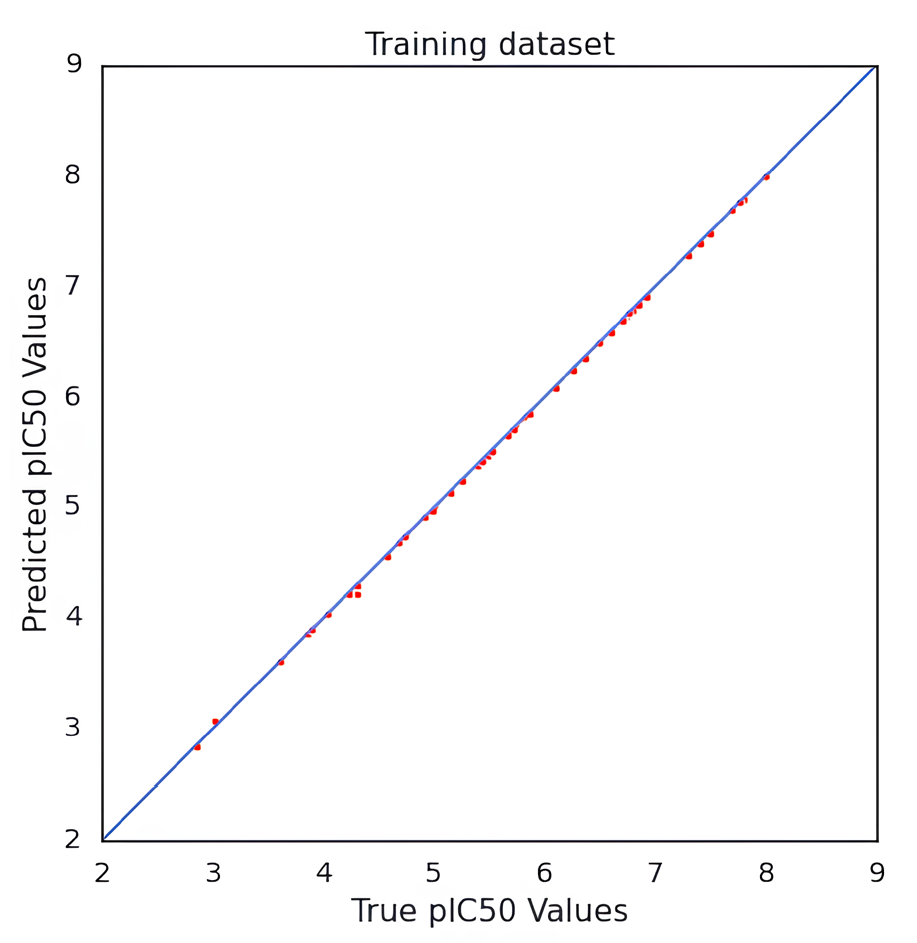
- Scatter plot of actual versus predicted values of the training dataset of hERG potassium channel blockers.
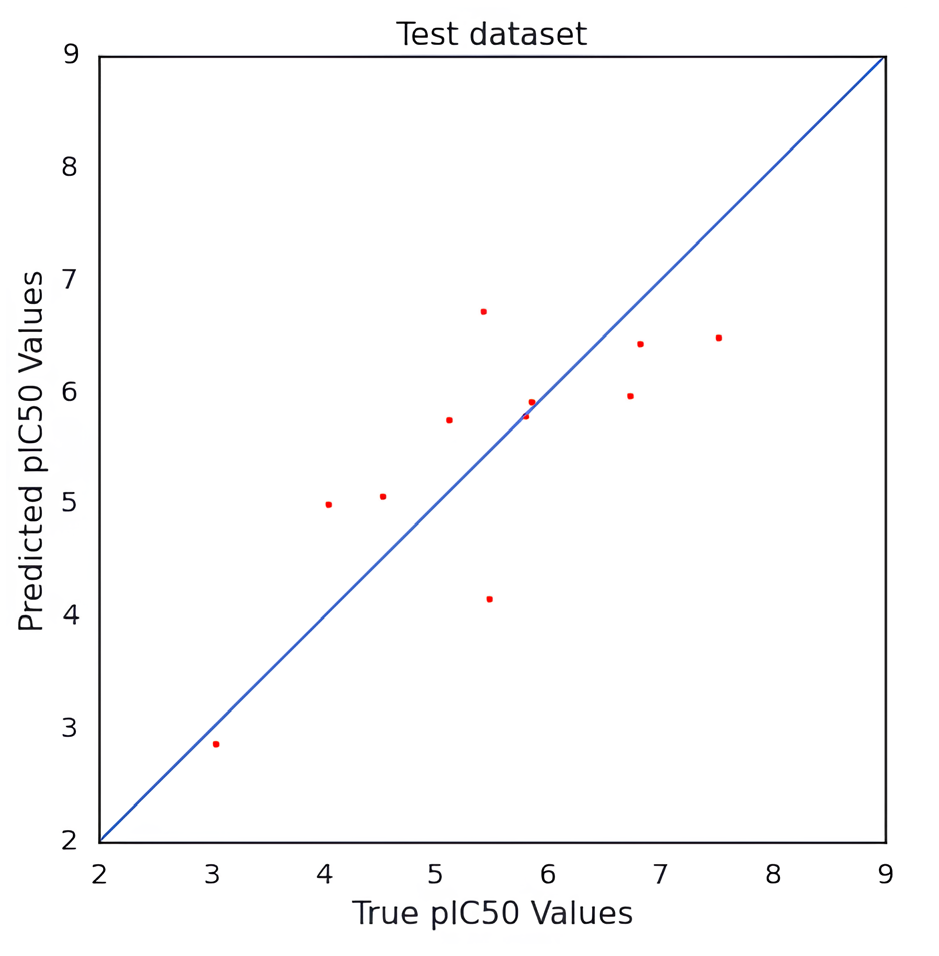
- Scatter plot of actual value versus predicted values of the test dataset of hERG potassium channel blockers for cardiotoxicity prediction.
4. Chemical analysis
We hypothesized that similar structures share similar biological activity. To explore this idea, we collected an experimental bioass9ay dataset of hERG blocker and used PCA for finding important molecular properties; t-SNE for chemical distribution; activity cliff for individual chemical singleton; SALI for fingerprint structure similarity; hierarchical relationship between scaffold defined by Murcko algorithm and ring system atomic number substitution; SOM and core fragment analysis. We then compared the structural neighborhoods of chemicals in different ranges of hERG activity values (pIC50). We have used 40 chemical properties for PCA analysis and t-SNE analysis. Figs. 6(a)-(b) depicts the 2D and 3D PCA analysis, respectively, of the first two PCs, and Fig. 7 illustrates the 2D eigenvalues of 40 properties. Fig. 8 visually represents the 2D t-SNE of hERG blockers with pIC50 values. Each data point represents a chemical compound, and the color indicates pIC50 values range from 3 to 8 (red to blue).
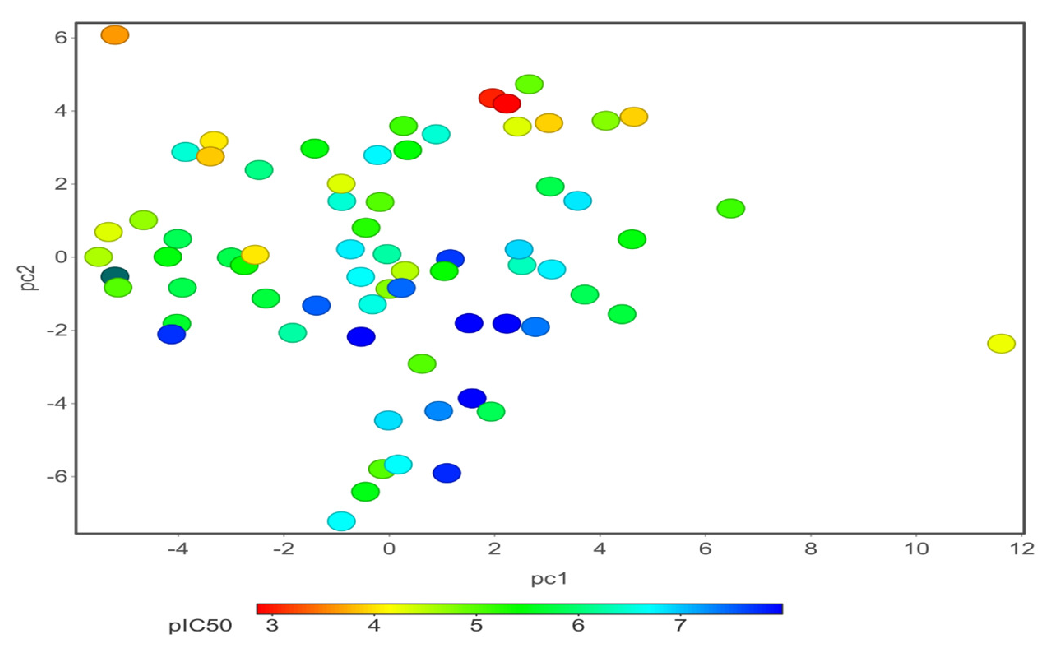
- 2D PCA plots of hERG blockers with biological activity (pIC50) shows 71 chemical structures, and the color indicates pIC50 value range 3 to 8 (from red to blue).
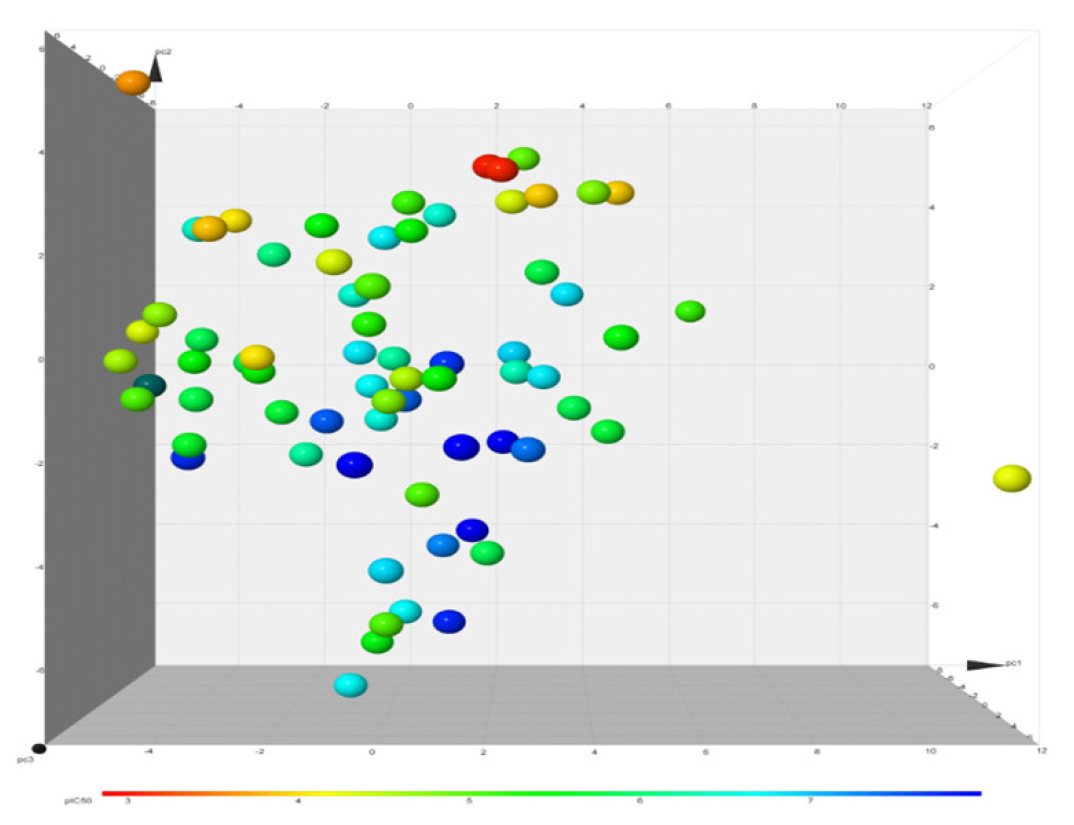
- 3D PCA plots of hERG blockers with biological activity (pIC50) show 71 chemical structures, and the color indicates pIC50 value range 3 to 8 (from red to blue).
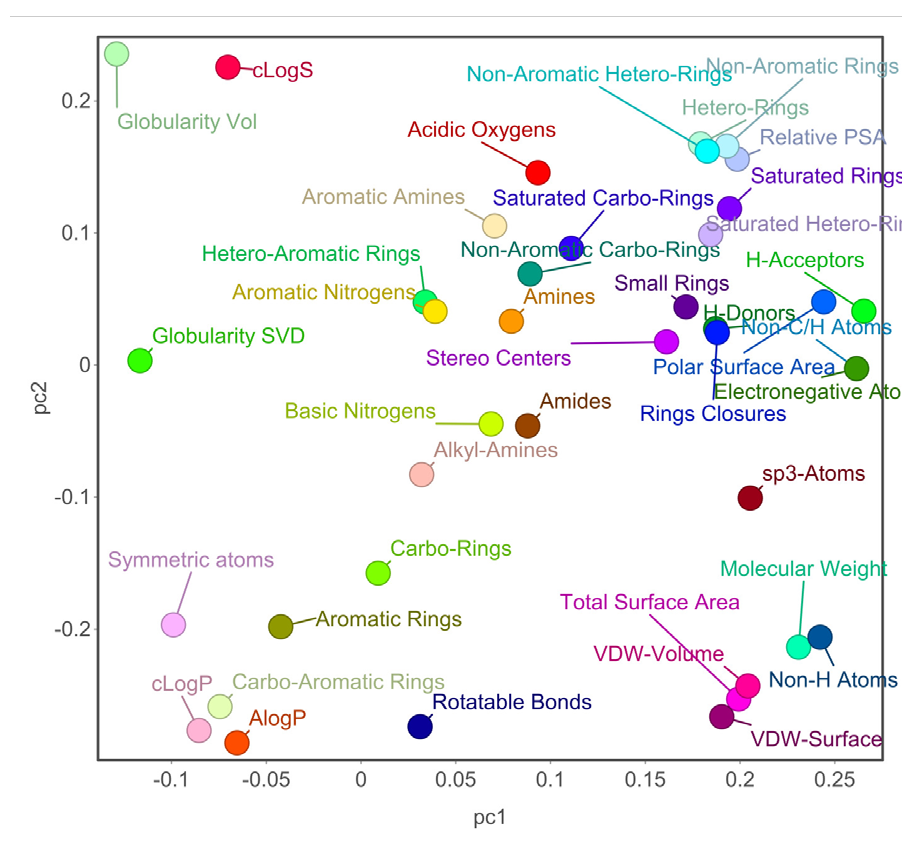
- Visual representation of chemical properties with the first two PCs of hERG potassium channel blockers.
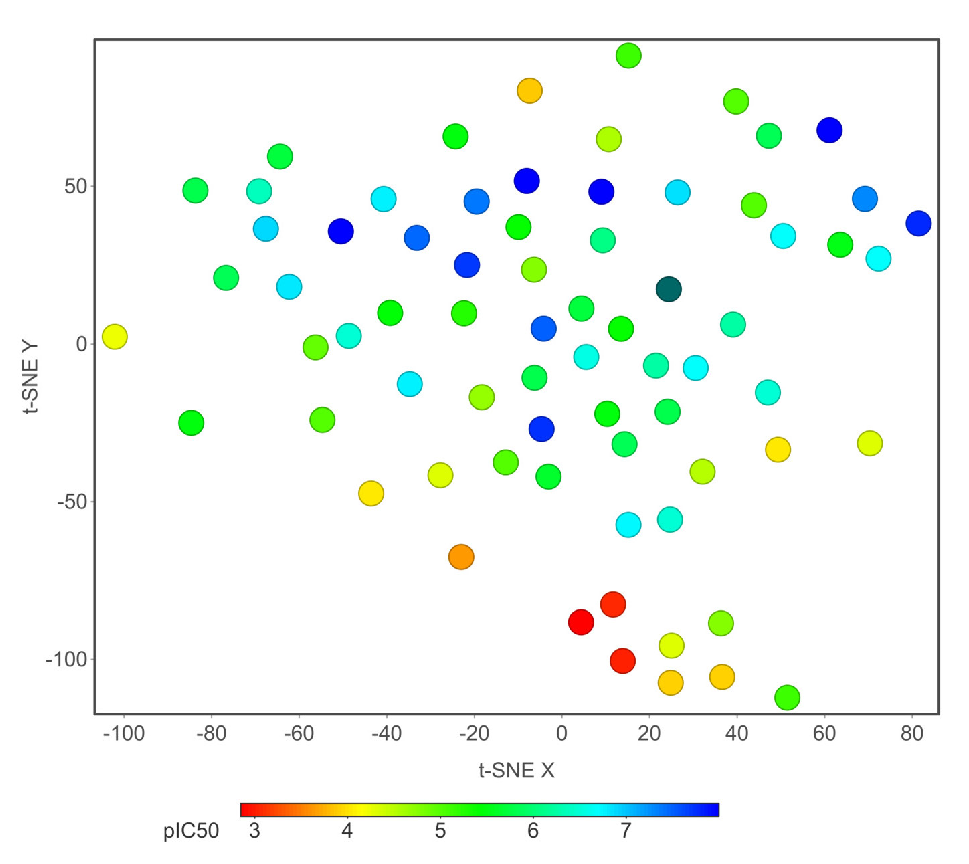
- 2D t-SNE plot of hERG potassium channel blockers with biological activity (pIC50) shows 71 chemical structures, and the color indicates pIC50 value from red (3) to blue (8).
4.1 Activity cliff analysis
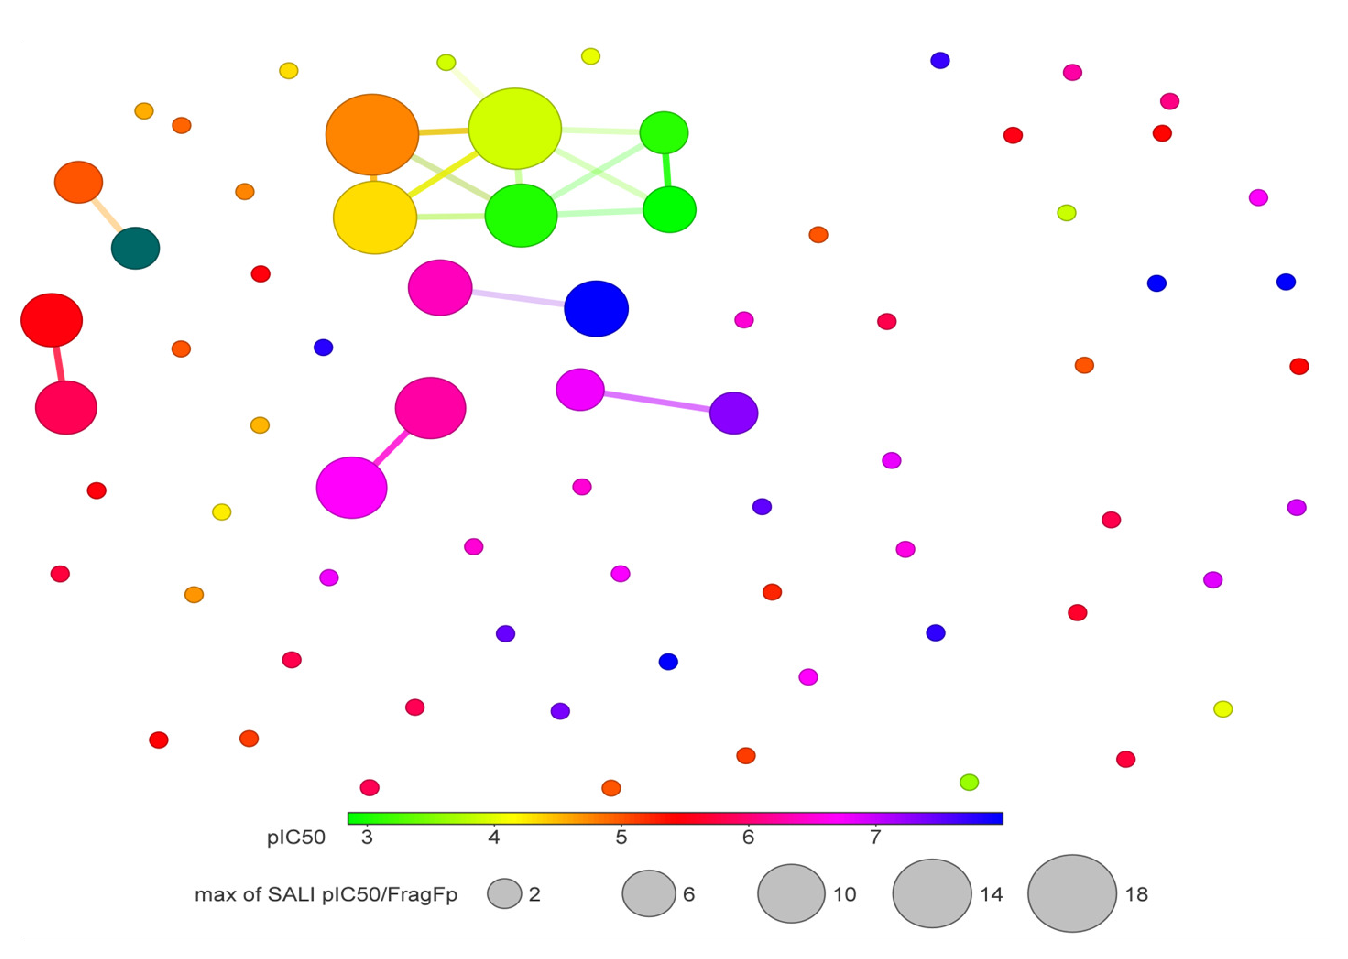
Activity cliffs identify molecular similarity, rich in SAR annotations, with threshold pIC50 values. Figs. 9 and 10 depict constellation maps of neighborhood chemicals that share similar X and Y coordinates in the 2D plot for chemicals with similar structures. The pIC50 value is used to color the data points using a scale from light green (low pIC50 value) to blue (high pIC50 value). The size of data points represents many fragment/fingerprint pairs. Linking lines represent the chemicals that are shared among data points. Fig. 10 demonstrates the quantitative relationship between the fragment-based similarity and the pIC50 value. Activity versus fragment similarities (>80%) show that molecules with equivalent descriptors also have similar chemical structures.
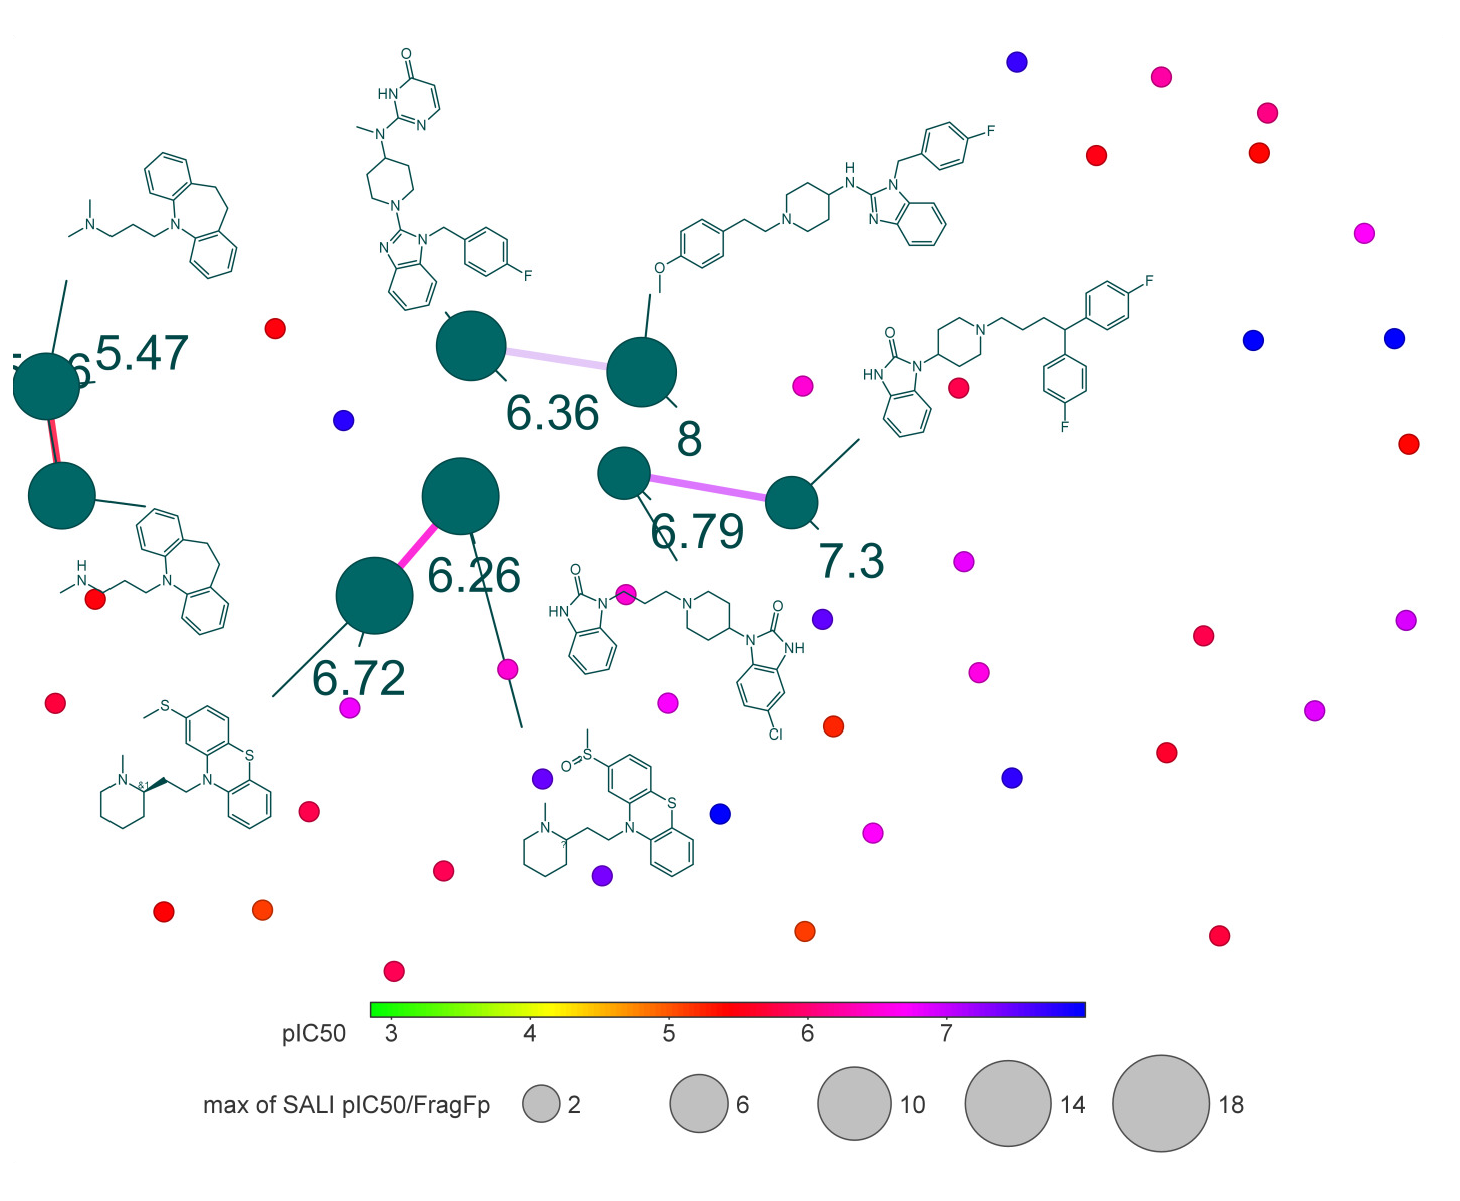
- Constellation plot of the quantitative relationship between pIC50 values and fingerprint similarity of hERG potassium channel blockers.

- SALI of quantitative relationship pIC50 values (more than 5) and fragment-based similarity of hERG potassium channel blockers.
- Quantitative relationship between pIC50 values and fingerprint similarity of hERG potassium channel blockers.
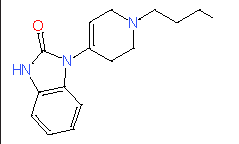
CHEMBL12713, CHEMBL296419, CHEMBL473, and CHEMBL533 had pIC50 values of 8.0. CHEMBL296419 (pIC50 = 8.0) is linked with CHEMBL94454 (pIC50 = 6.36), shown in Fig. 11. The finding of activity cliffs can significantly impact how the QSAR model evolves. The specific fragment pair in a molecule is responsible for hERG block. The chemicals that act as hERG blockers have many structural similarities, as shown in Fig. 10. We identified a QSAR between the fingerprint pairings of similarity for the selected substances.
4.2 Relevance of chemical properties to hERG potassium channel
Chemical properties are important for cardiotoxicity prediction. Here, we thoroughly examined the connections between hERG and seven chemical properties: acidic oxygen, hydrogen-bond acceptors AlogP, clogP, clogS, polar surface area, and total surface area. The distribution of these properties was shown in Figs. 12(a)-(f). We can distinguish these properties between hERG severe blocker, mild blocker, and non-blocker. From Fig. 11, we analyzed that adding acidic oxygen or aliphatic oxygen (hydroxyl group) reduces hERG inhibition and increases clogP (lipophilicity).
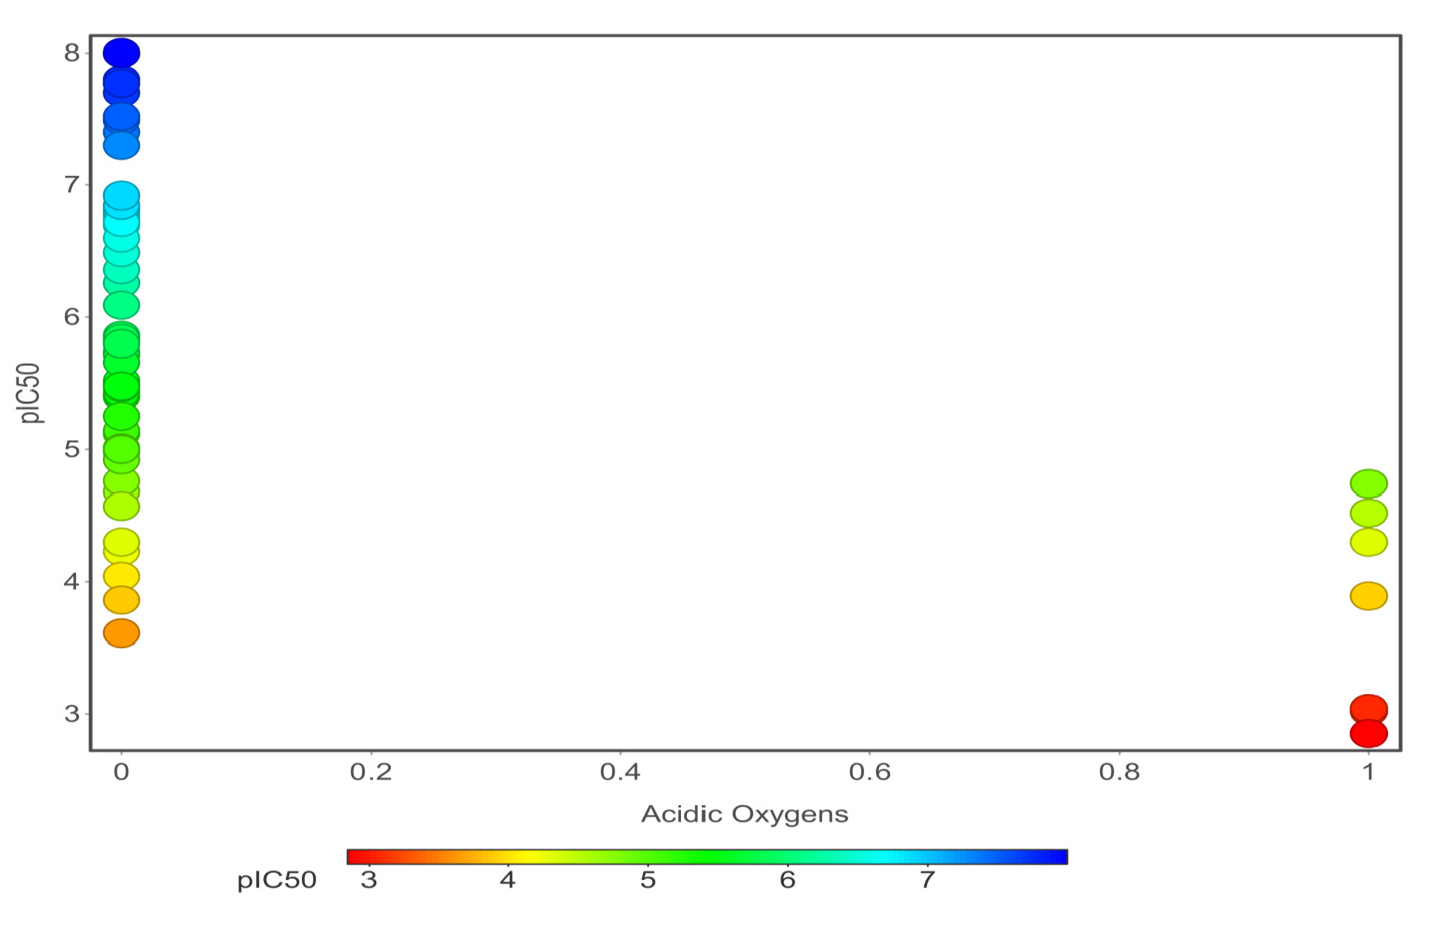
- Correlations of eight representative chemical descriptors acidic oxygen.
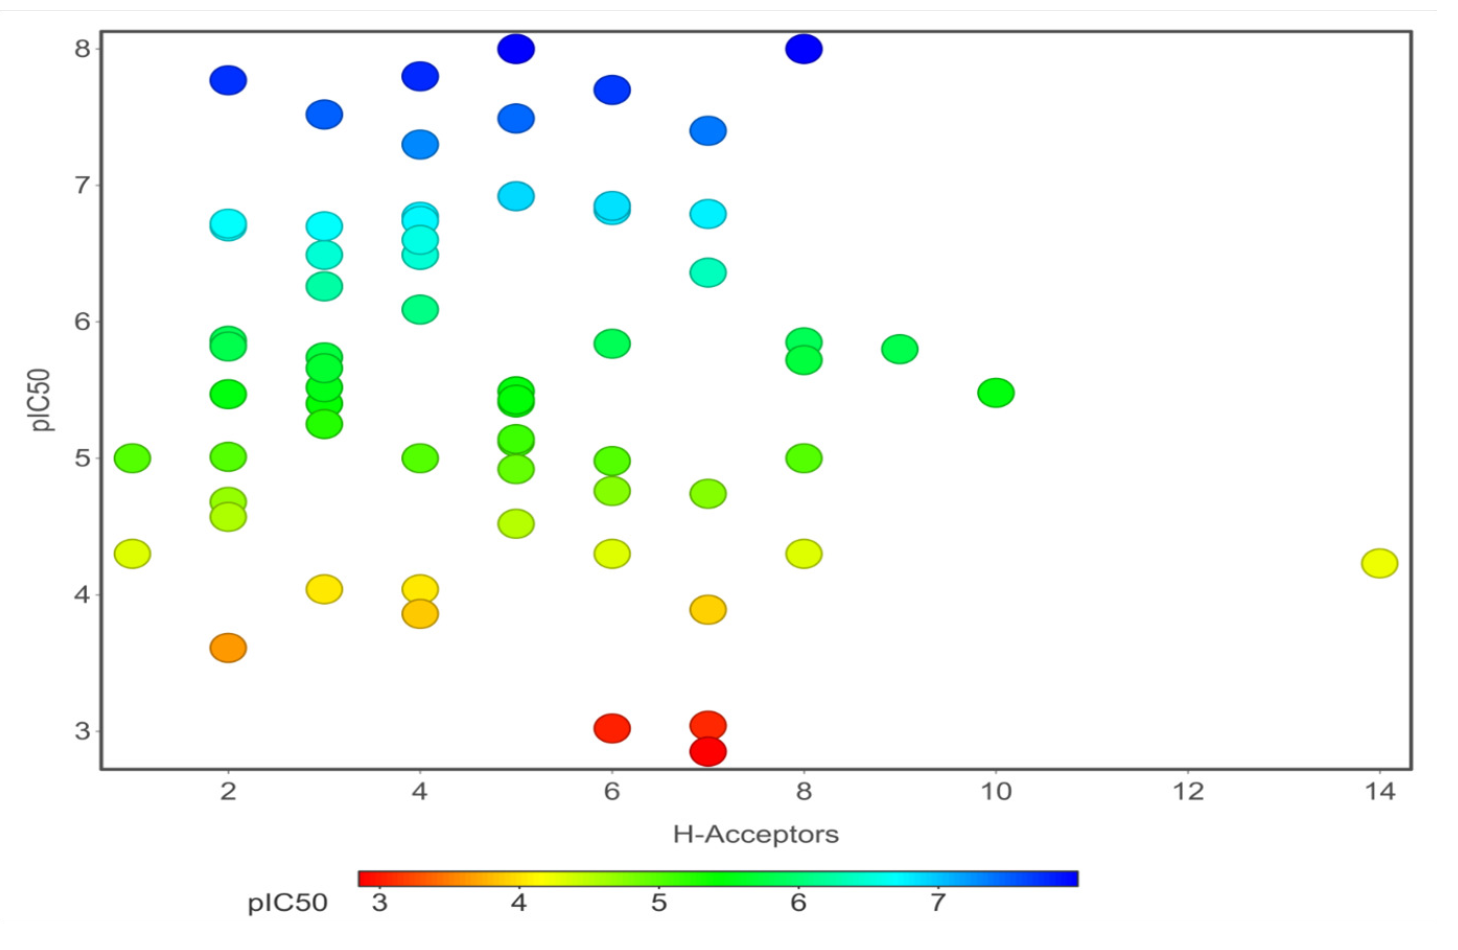
- Hydrogen-bond acceptors, AlogP.
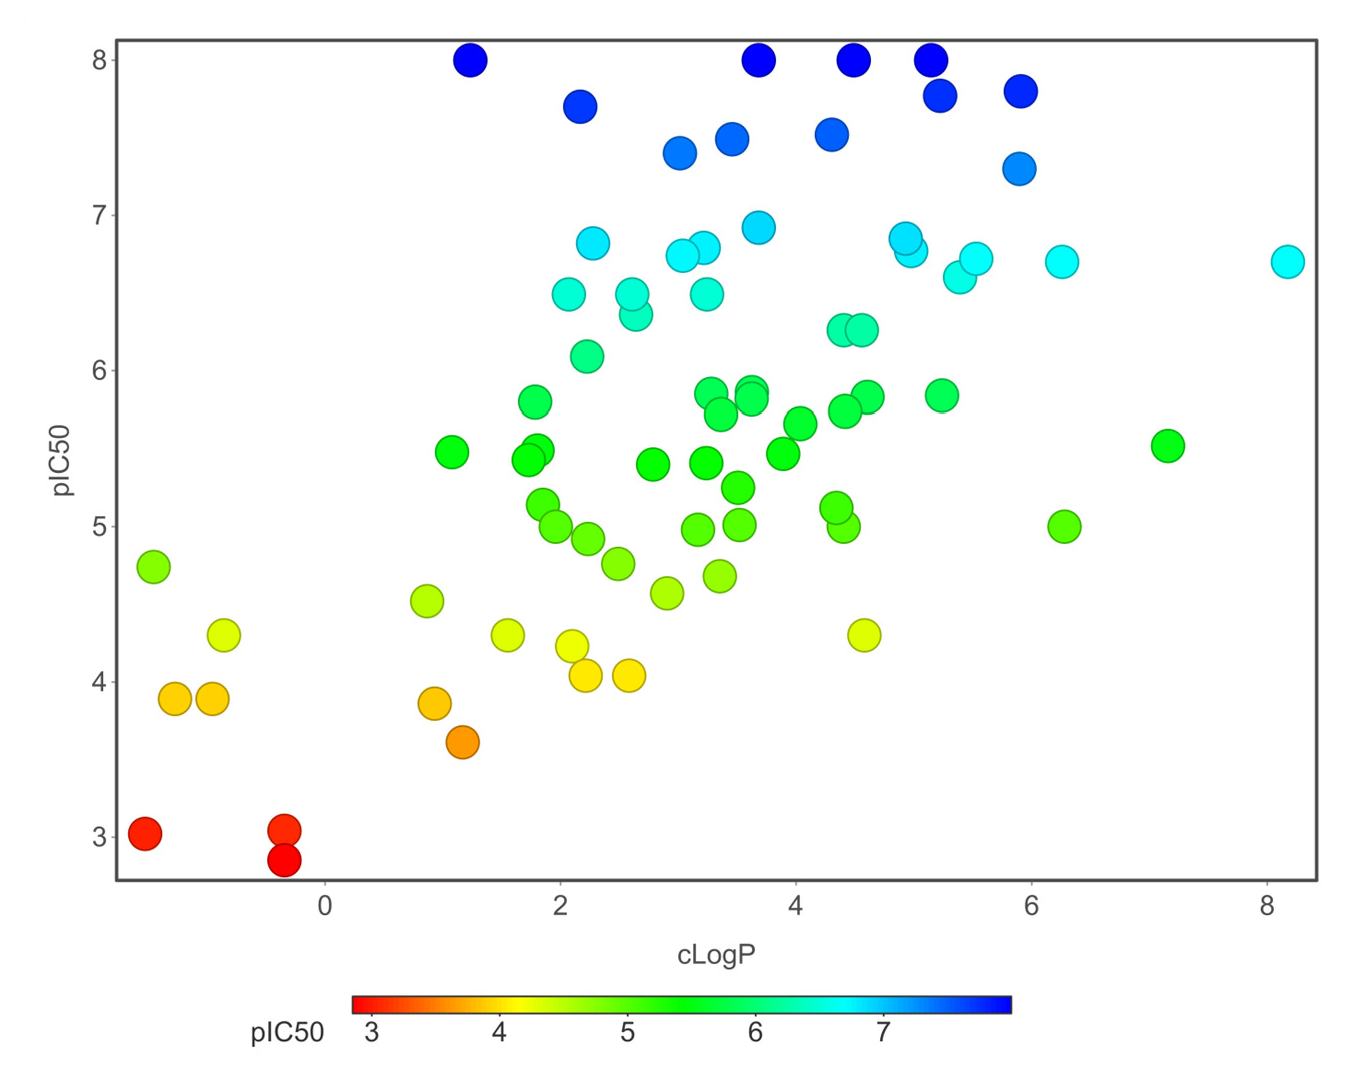
- ClogP.
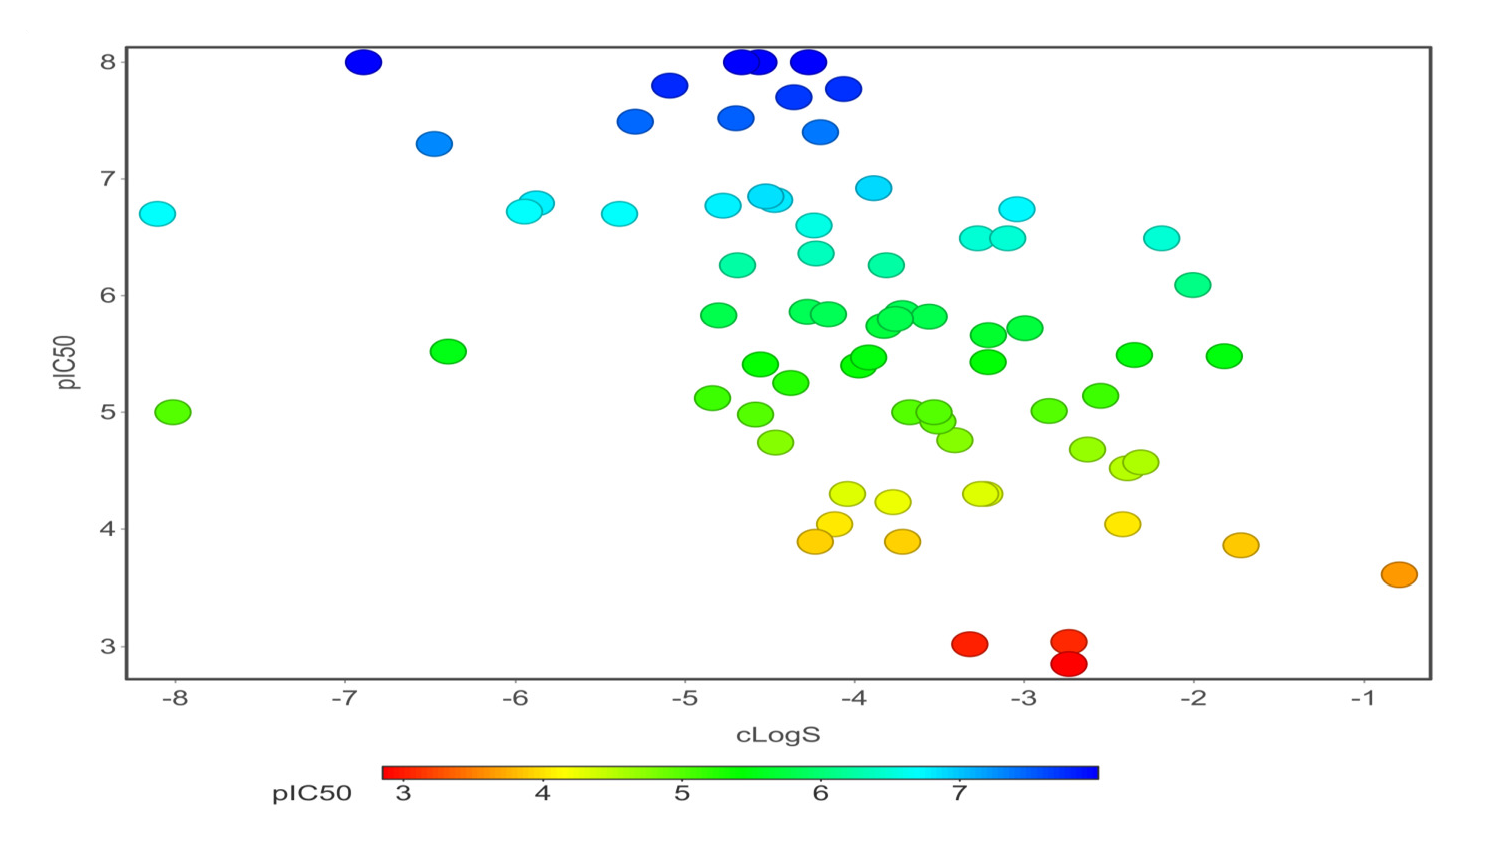
- ClogS.
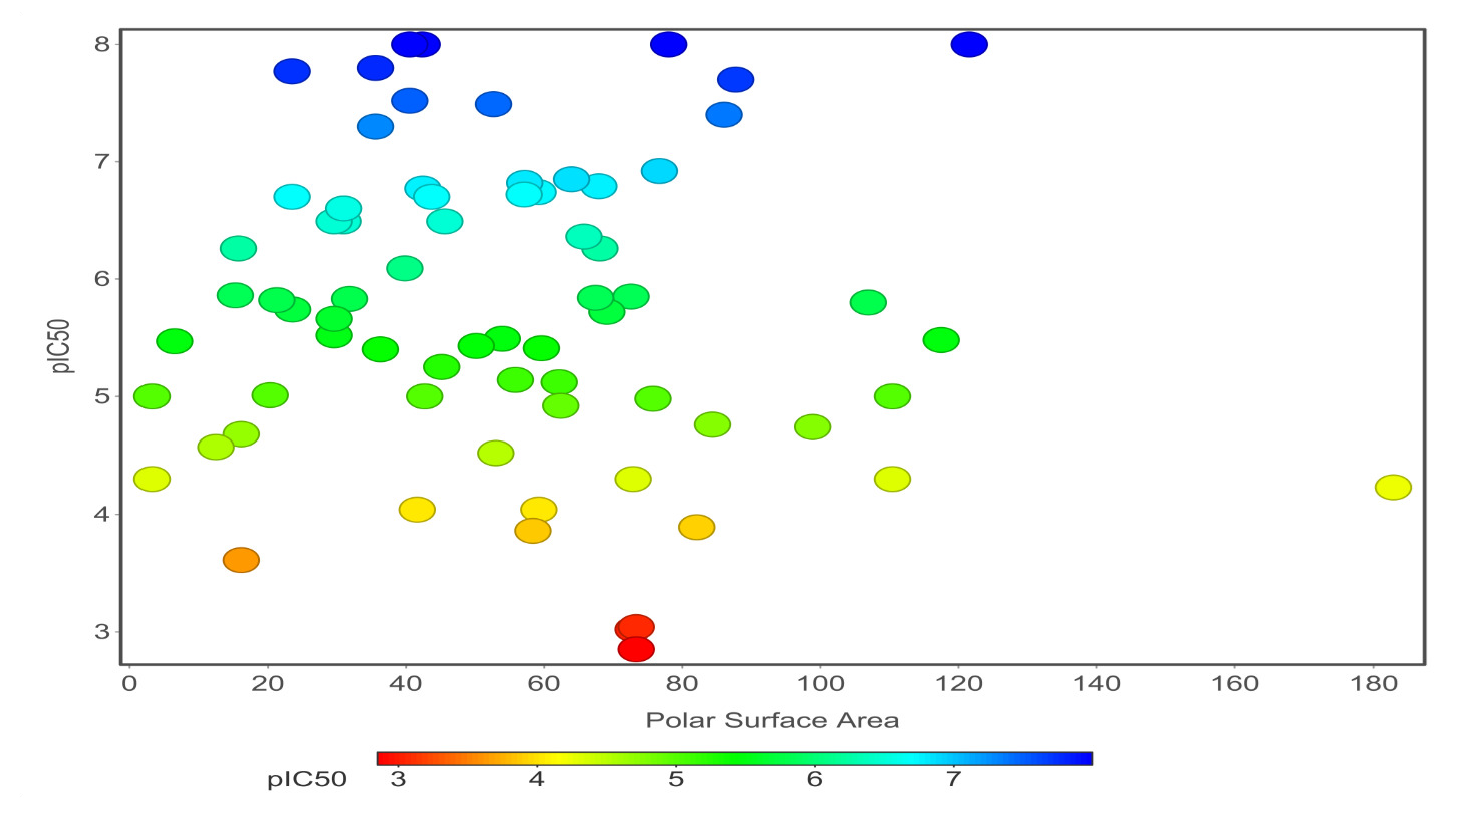
- Polar surface area.
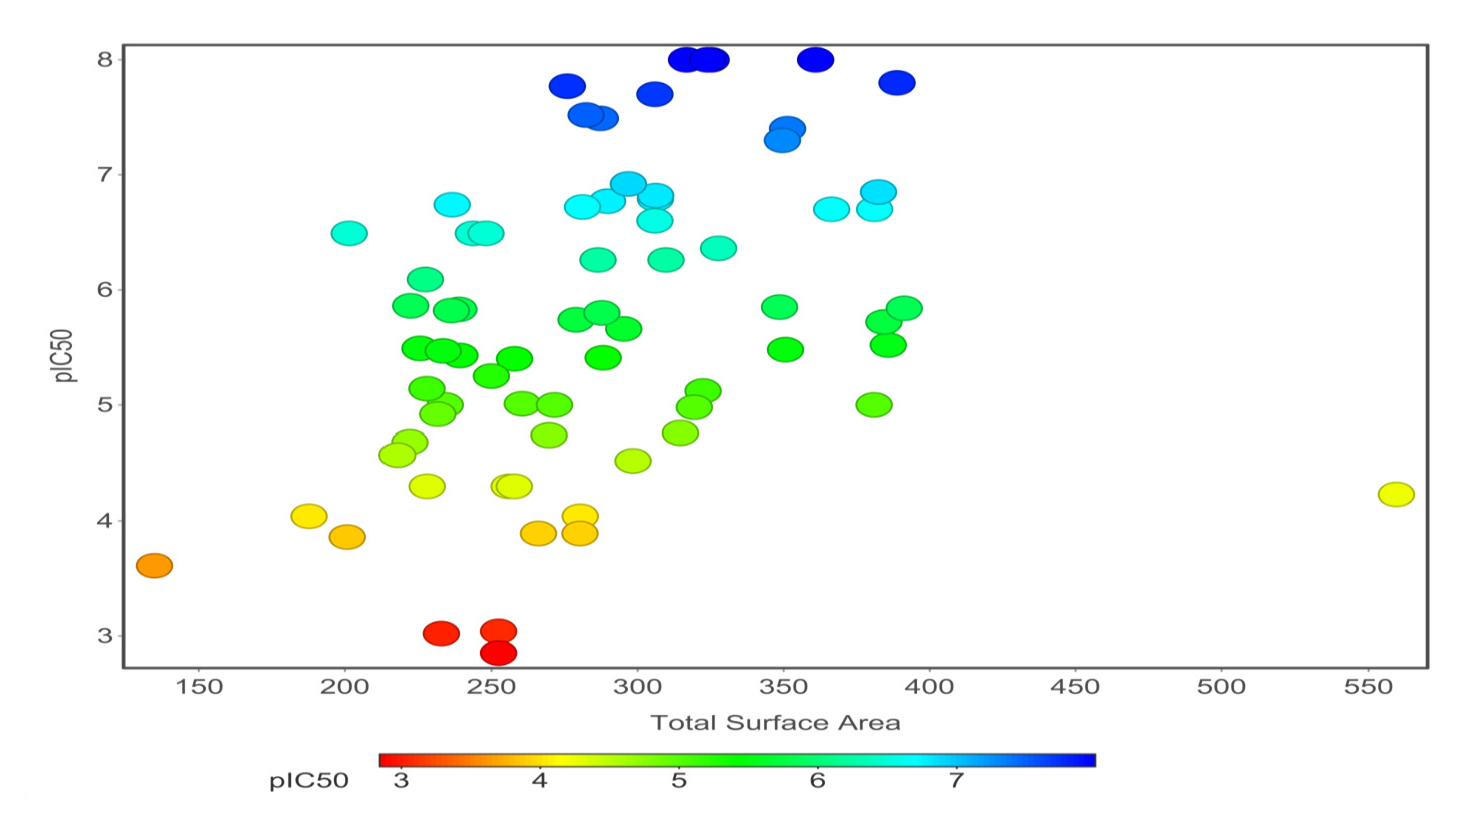
- Total surface area versus pIC50 value of 71 compounds of hERG potassium channel blockers.
4.3 Scaffold analysis
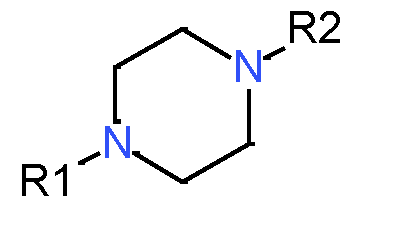
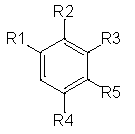
The molecules are divided up into four primary components by scaffold analysis: the ring system, linkers, side chains, and the Murcko framework. We applied the ring system with atomic number substitution scaffold and the most central atom core fragment scaffold to study the compounds.
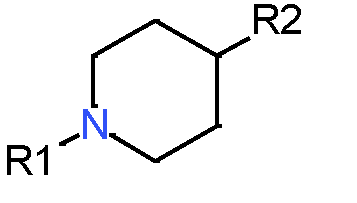
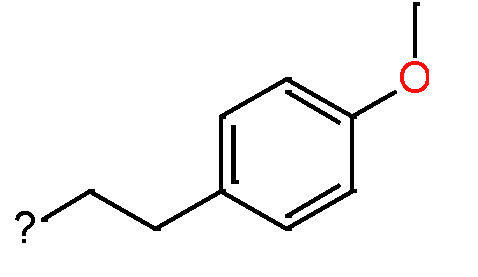
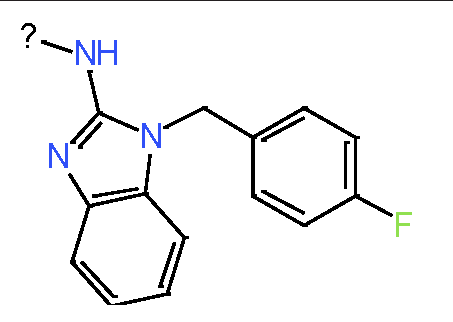
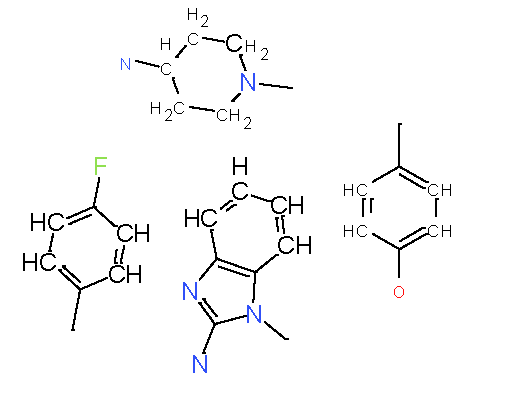
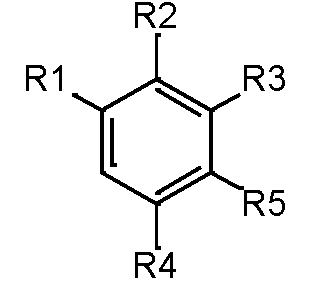
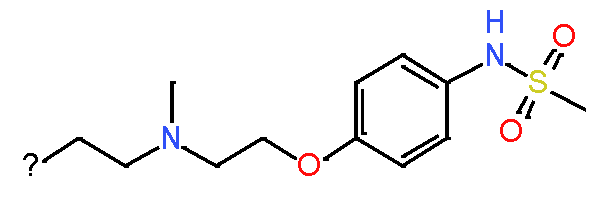
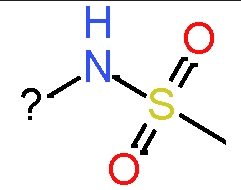
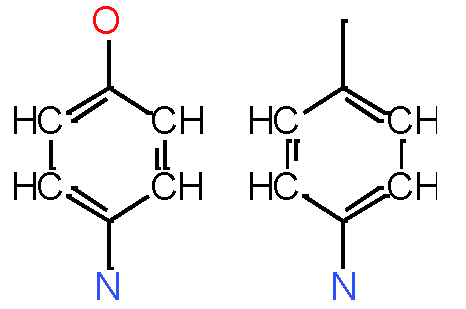
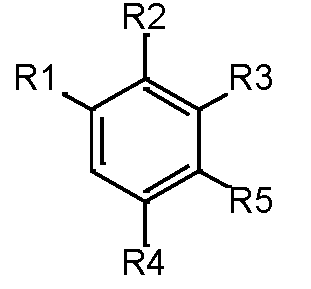
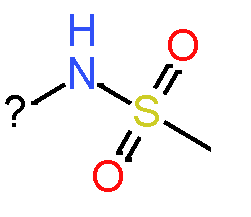
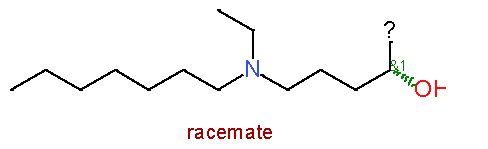
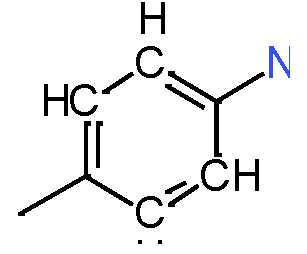
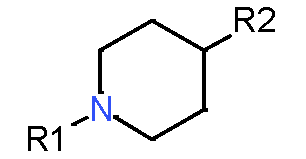
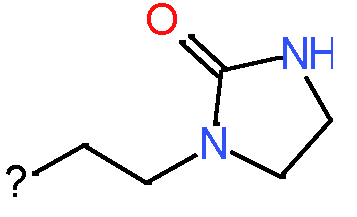
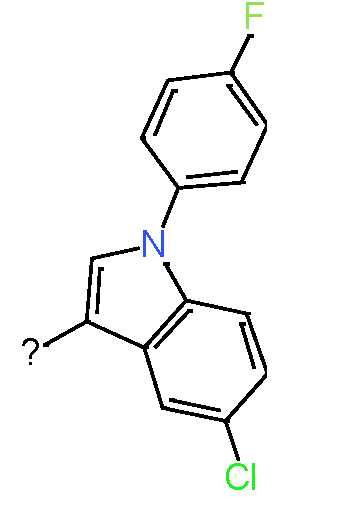
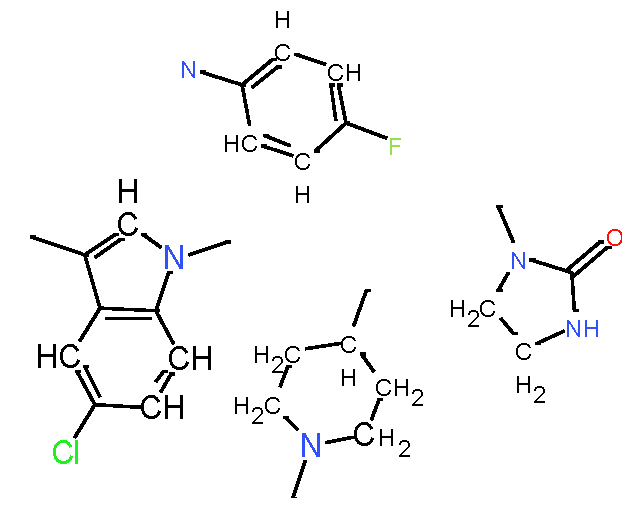
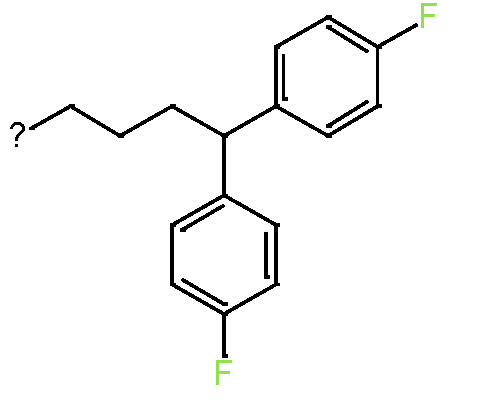
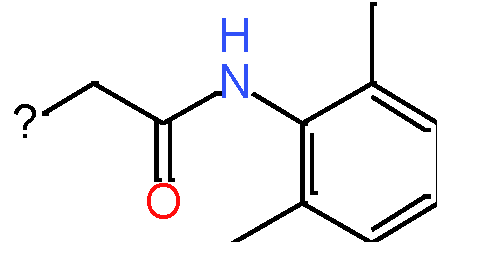
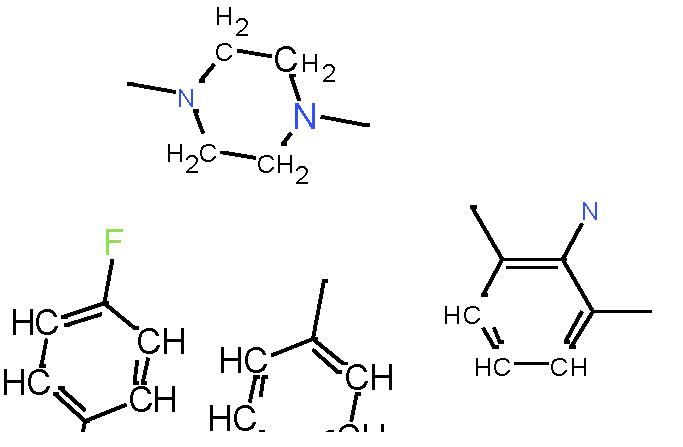
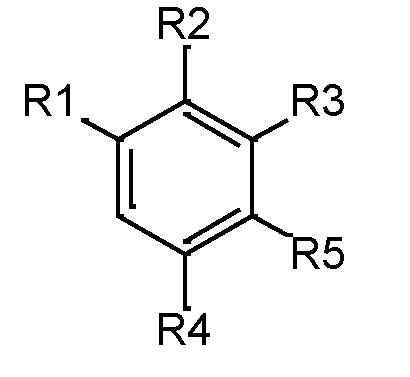
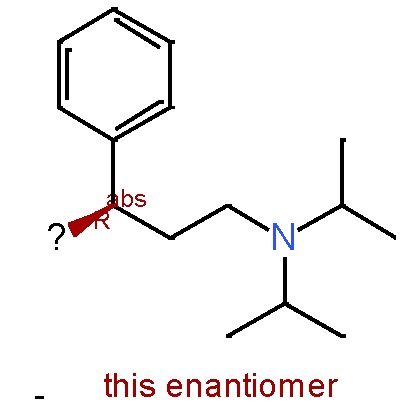
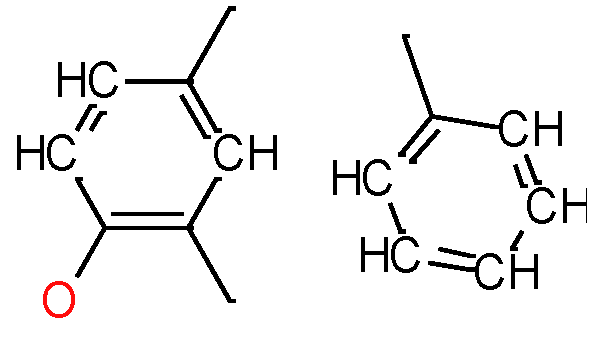
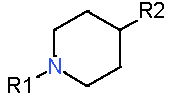
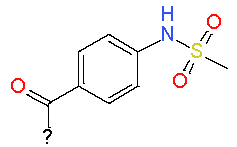
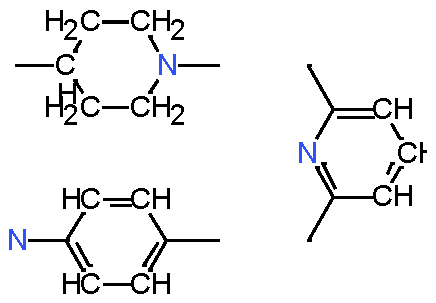
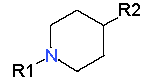
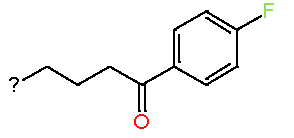
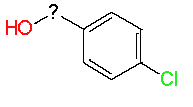
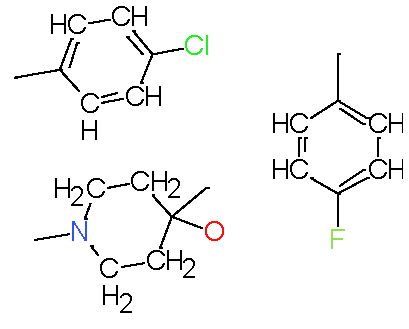
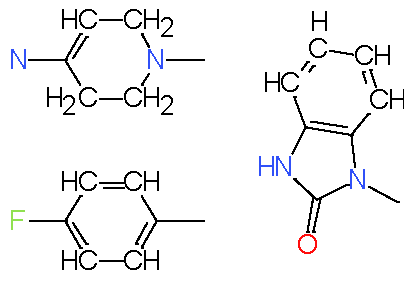
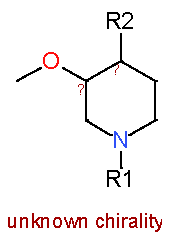
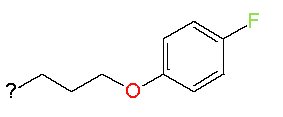
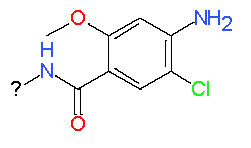
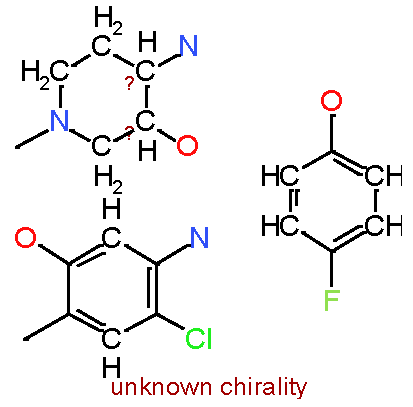
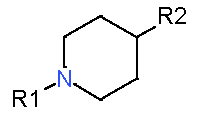
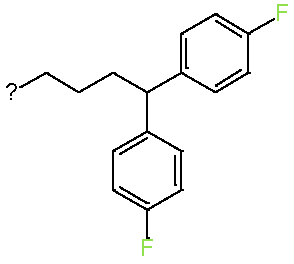
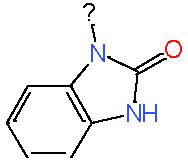
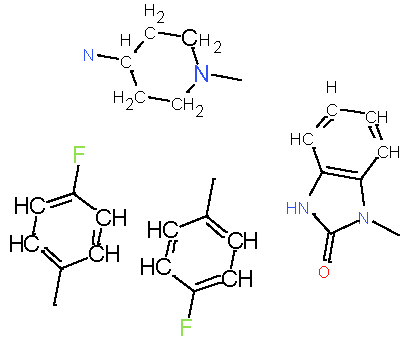
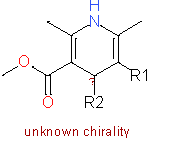
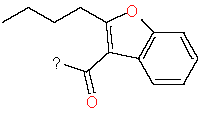
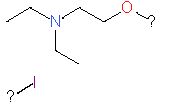
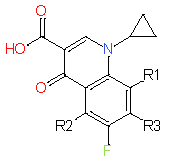
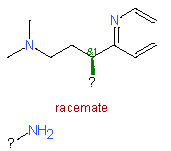
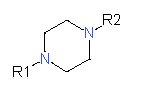
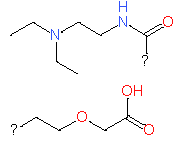
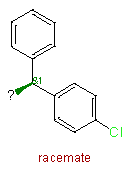
Our analysis reveals that furan, sulfonamide, methanesulfonamide, p-chlorophenyl, p-fluorophenyl, and ethyl(heptyl)amino groups increased hERG risk when added to a molecule, as listed in Table 1 and Figs. 13(a, b, c & d). In Table 2, we listed fragments of molecules that have pIC50 values less than 5. These fragments are not responsible for cardiotoxicity. While in Table 1 lists fragments/fingerprint pairs that affect cardiotoxicity. When these fragments were added to molecules, they increased the pIC50 values, as shown in Fig. 12.
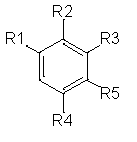
| Most central atom core fragment | R1 | R2 | Scaffold (Ring system with atomic number substitution) | Pic50 | |
|---|---|---|---|---|---|
| 1 |
|
|
|
|
8.00 |
| 2 |
|
|
 Sulfonamide Sulfonamide |
|
8.0 |
| 3 |
|
|
|
|
8.0 |
| 4 |
|
|
|
|
8.0 |
| 5 |
|
|
|
|
7.8 |
| 6 |
|

|
|
|
7.77 |
| 7 |
|

|
|
|
7.7 |
| 8 |
|
|
|
|
7.52 |
| 9 |
|
- | - |
|
7.49 |
| 10 |
|
|
|
|
7.4 |
| 11 |
|
|
|
|
7.3 |
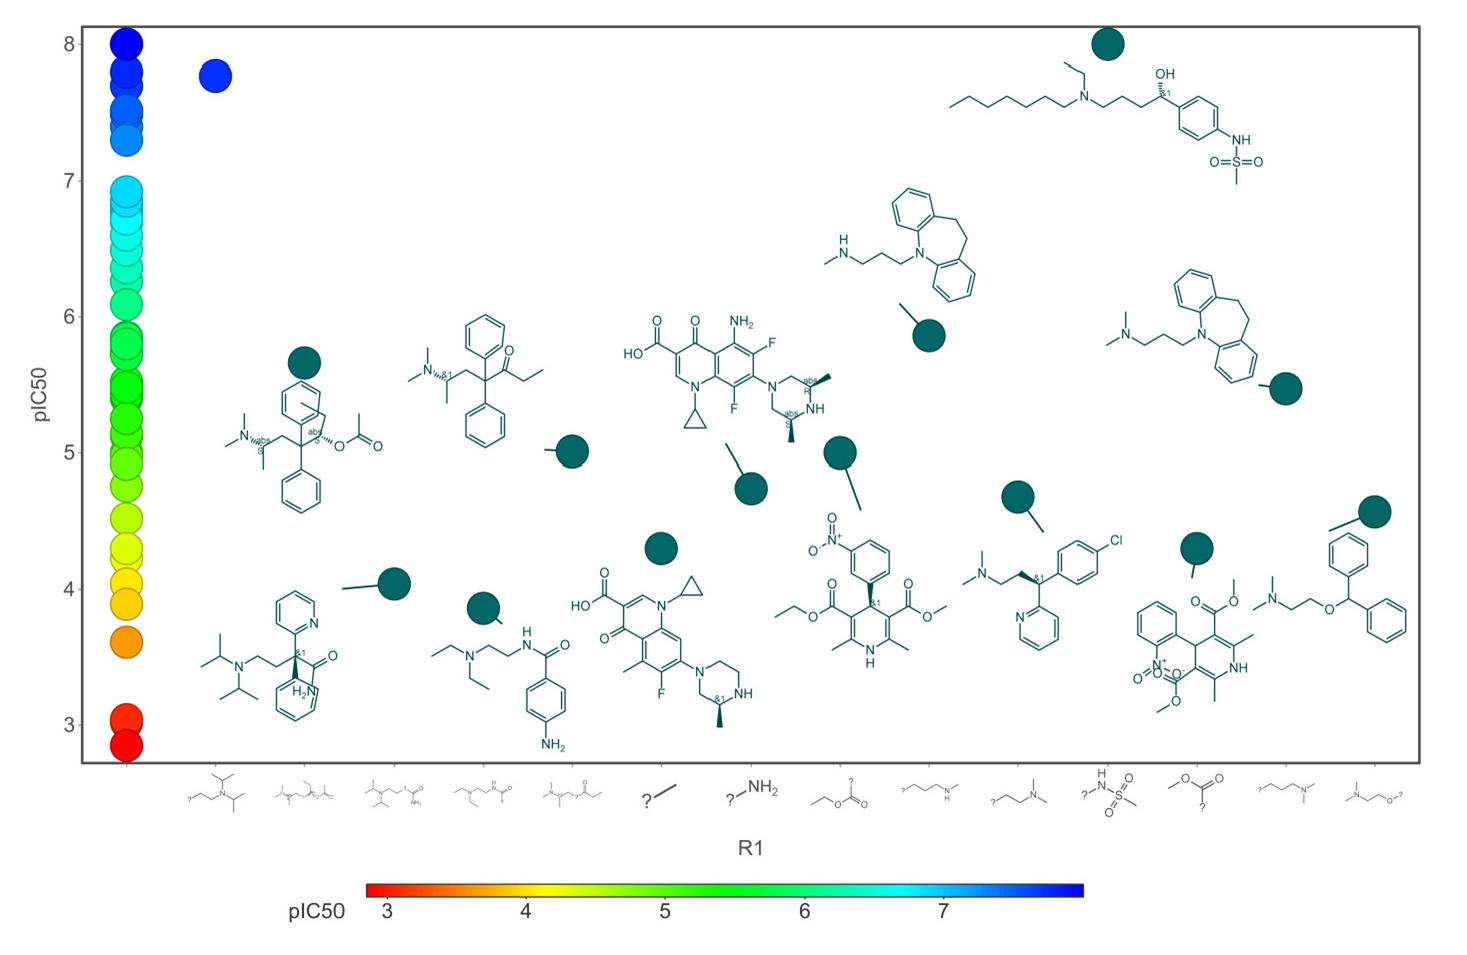
- Core fragments (R1) of hERG potassium channel blocker versus pIC50.
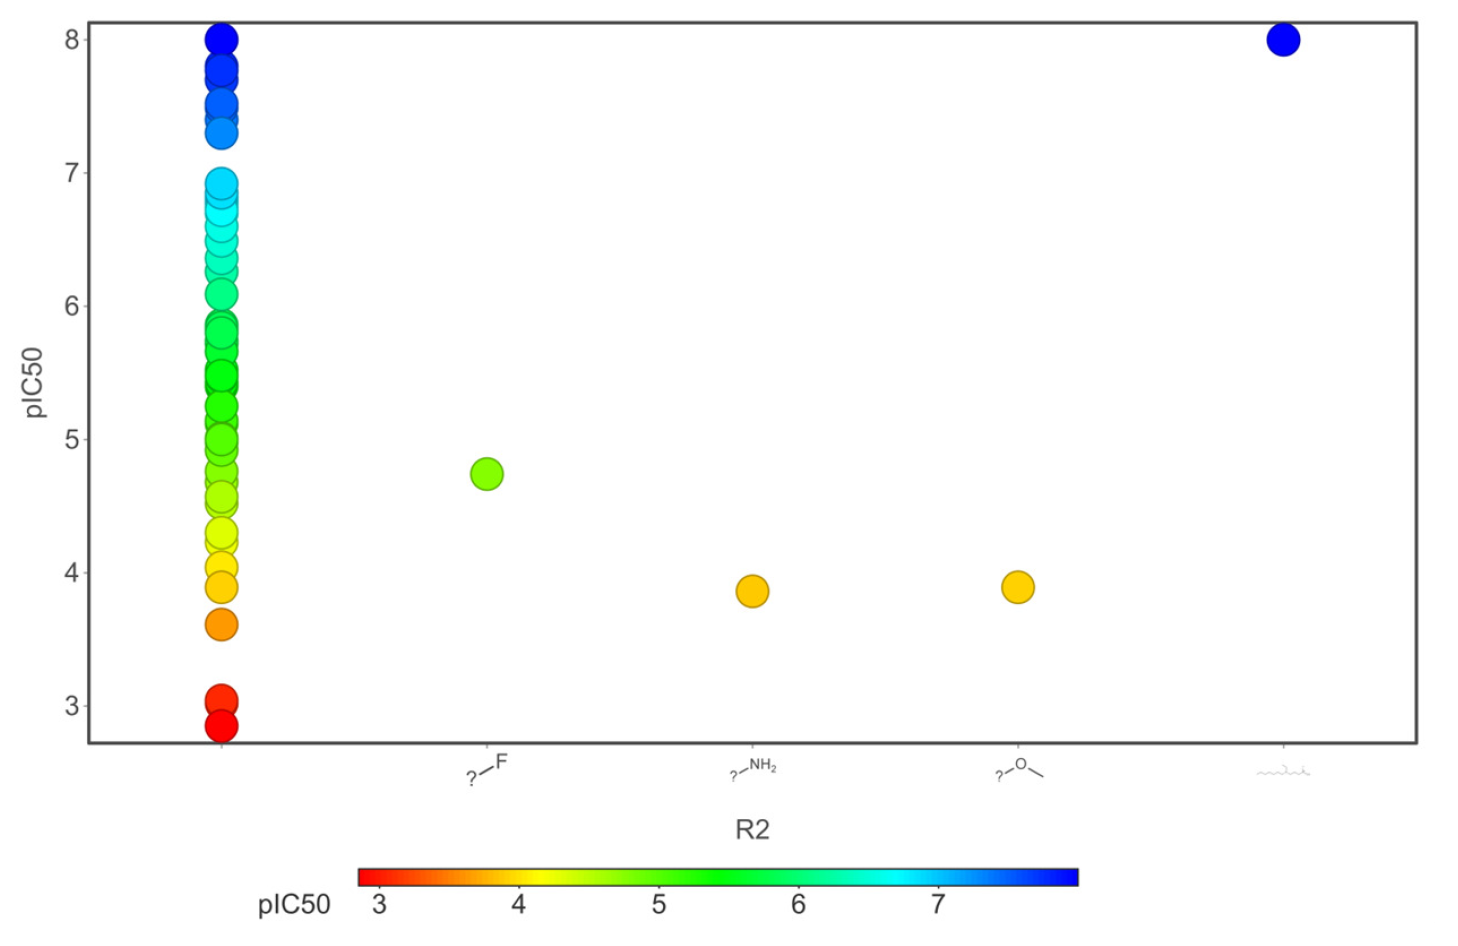
- Core fragments (R2) of hERG potassium channel blocker versus pIC50.
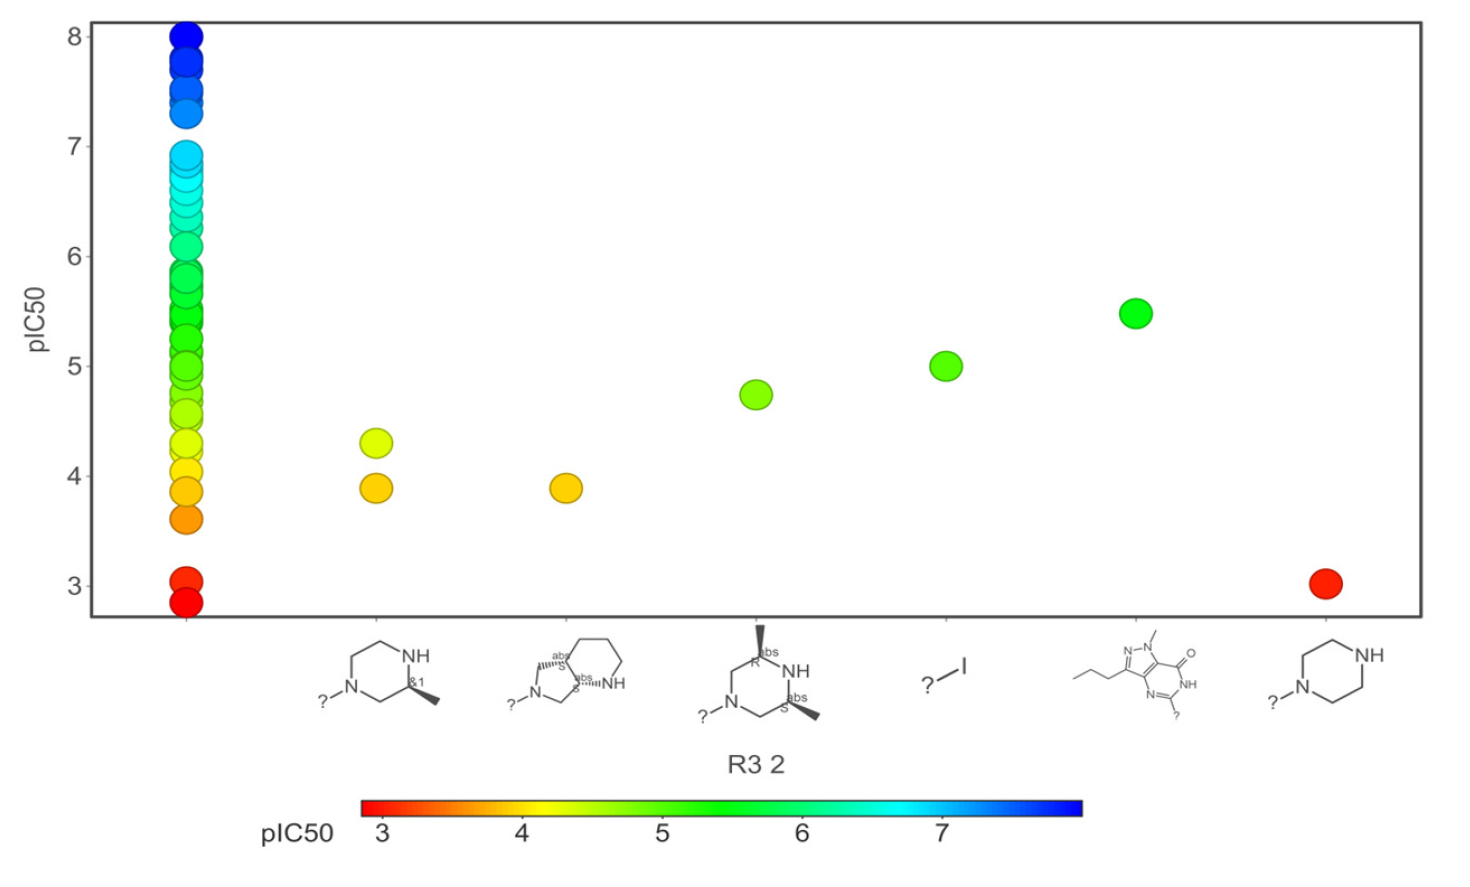
- Core fragments (R3) of hERG potassium channel blocker versus pIC50.
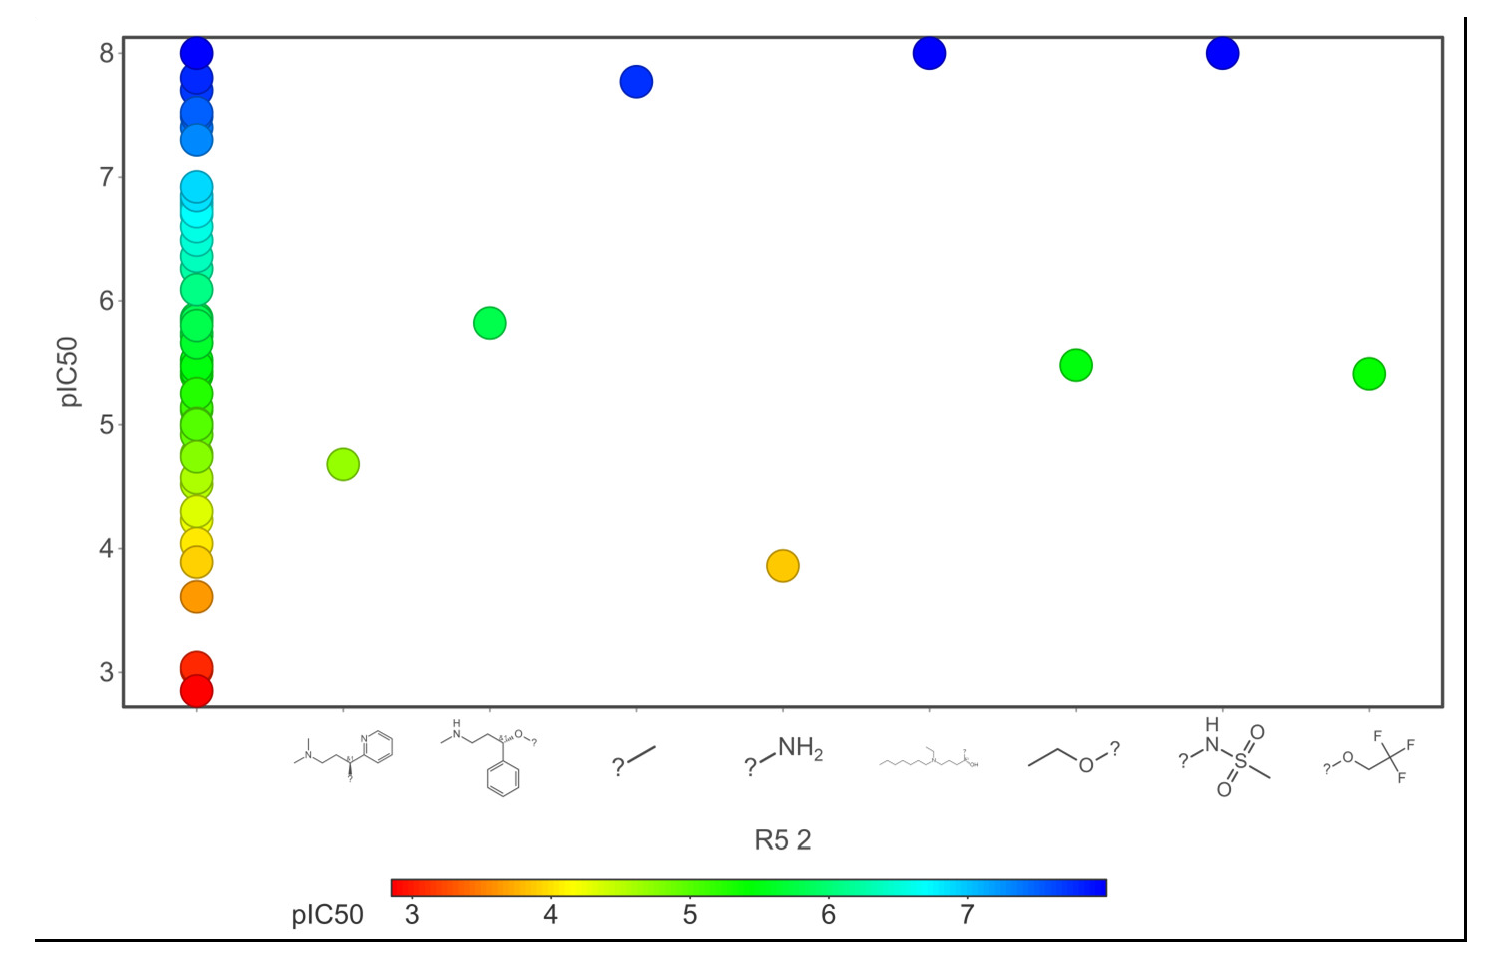
- Core fragments (R5) of hERG potassium channel blocker versus pIC50.
| Fragments | |||
| 1 |
|
|
|
| 2 |
|
|
|
| 3 |
|
|
|
| 4 |
|
|
|
| 5 |
|
|
|
| 6 |
|

|
5. Conclusion
Small chemicals that block the human-ether-a-go-go-related (hERG) potassium channel result in a prolonged QT interval, which can have severe cardiotoxic effects and is a major factor in drug development failures. To develop the drug successfully, quantitative prediction of hERG blockers is essential for designing drug candidates without the risk of cardiotoxicity. In this research work, we built a QSAR model combined with CNN architecture to predict cardiotoxicity effects quantitatively. For model optimization, we reduced 179 descriptors into eight PCs and two t-SNE vectors with 40 physicochemical properties. The statistical results reveal that for the training dataset, the MSE was 0.001, MAE was 0.016, and the Q2 0.99. For the test dataset, the MSE was 0.62, the MAE was 0.65, and the R2 was 0.70. In order to identify structural characteristics related to biological activity (IC50), we also examined chemical space, scaffold, activity cliff, and molecular similarity. The ring system shares similar chemical and biological activity, employing chemical space with atomic number substitution scaffold and the most central atom core fragment scaffold. We analyzed that adding acidic oxygen or aliphatic oxygen (hydroxyl group) reduces hERG inhibition and increases clogP (lipophilicity). The fragments, namely furan, sulfonamide, methanesulfonamide, p-chlorophenyl, p-fluorophenyl, and ethyl(heptyl)amino group, increased the hERG risk. More than 80% of the fragment pairs exhibited commonality. Our analysis reveals that these functional groups increase hERG risk when added to a molecule. Ultimately, we conclude that the QSAR model combined with CNN promises a potentially novel approach to quantitatively predict the cardiotoxicity of the drug candidate.
Availability of data and material
The datasets generated and/or analysed during the current study are available in the cHEMBL repository site (CHEMBL829152), https://www.ebi.ac.uk/chembl/assay_report_card/CHEMBL829152/
CRediT authorship contribution statement
M.K., K.R. worked on Conceptualizations, methodology, formal analysis, and writing—original draft preparation, while A.T.A., A.M.E., S.M., B.L. participated in writing—review and editing, validation, supervision, project administration. All authors have read and agreed to the published version of the manuscript.
Declaration of competing interest
The authors declare that they have no known competing financial interests or personal relationships that could have appeared to influence the work reported in this paper.
Declaration of Generative AI and AI-assisted technologies in the writing process
The authors confirm that there was no use of artificial intelligence (AI)-assisted technology for assisting in the writing or editing of the manuscript and no images were manipulated using AI.
Acknowledgements
The authors extend their appreciation to the Researchers Supporting Project number (RSPD2025R558), King Saud University, Riyadh, Saudi Arabia.
References
- The properties of known drugs. 1. Molecular frameworks. J Med Chem. 1996;39:2887-2893. https://doi.org/10.1021/jm9602928
- [Google Scholar]
- Part one: Scaffolds: identification, representation diversity, and navigation. Chapter 1: Identifying and Representing Scaffolds. In: Scaffold Hopping in Medicinal Chemistry Vol Volume 58. (First Edition). Wiley‐VCH; 2013. p. :3-7.
- [Google Scholar]
- Deep Learning-Based Prediction of Drug-Induced Cardiotoxicity. J. Chem. Inf. Model.. 2019;59:1073-1084. https://doi.org/10.1021/acs.jcim.8b00769
- [Google Scholar]
- The Study on the hERG Blocker Prediction Using Chemical Fingerprint Analysis. Molecules. 2020;25:2615. https://doi.org/10.3390/molecules25112615
- [Google Scholar]
- Structure-Based Prediction of hERG-Related Cardiotoxicity: A Benchmark Study. J. Chem. Inf. Model.. 2021;61:4758-4770. https://doi.org/10.1021/acs.jcim.1c00744
- [Google Scholar]
- Ligand-based prediction of hERG-mediated cardiotoxicity based on the integration of different machine learning techniques. Front. Pharmacol.. 2022;13:951083. https://doi.org/10.3389/fphar.2022.951083
- [Google Scholar]
- Global analysis reveals families of chemical motifs enriched for HERG inhibitors. PLoS One. 2015;10:e0118324. https://doi.org/10.1371/journal.pone.0118324
- [Google Scholar]
- Three-Dimensional Quantitative Structure-Activity Relationship for Inhibition of Human Ether-a-Go-Go-Related Gene Potassium Channel. The Journal of Pharmacology and Experimental Therapeutics. 2002;301:427-434. https://doi.org/10.1124/jpet.301.2.427
- [Google Scholar]
- Structure--activity landscape index: Identifying and quantifying activity cliffs. J. Chem. Inf. Model. 2008;48:646-658. https://doi.org/10.1021/ci7004093
- [Google Scholar]
- Cardiotoxicity prediction Based on integreted hERG database with molecular convolution model. 2019 IEEE International Conference on Bioinformatics and Biomedicine (BIBM) San Diego, CA, USA, pp. 1500-1503. https://doi.org/10.1109/bibm47256.2019.8983163
- Prediction of hERG potassium channel affinity by traditional and hologram qSAR methods. Bioorg. Med. Chem. Lett.. 2003;13:2773-2775. https://doi.org/10.1016/s0960-894x(03)00492-x
- [Google Scholar]
- 3D QSAR, pharmacophore and molecular docking studies of known inhibitors and designing of novel inhibitors for M18 aspartyl aminopeptidase of Plasmodium falciparum. BMC Struct. Biol.. 2016;16 https://doi.org/10.1186/s12900-016-0063-7
- [Google Scholar]
- Physicochemical QSAR analysis of hERG inhibition revisited: Towards a quantitative potency prediction. J. Comput. Aided Mol. Des.. 2022;36:837-849. https://doi.org/10.1007/s10822-022-00483-0
- [Google Scholar]
- Computational determination of hERG-related cardiotoxicity of drug candidates. BMC Bioinformatics. 2019;20:250. https://doi.org/10.1186/s12859-019-2814-5
- [Google Scholar]
- PowerMV: A software environment for molecular viewing, descriptor generation, data analysis and hit evaluation. J. Chem. Inf. Model.. 2005;45:515-522. https://doi.org/10.1021/ci049847v
- [Google Scholar]
- Markush, E. A. U.S. Patent 1,506,316, 1924.
- TSSF-hERG: A machine-learning-based hERG potassium channel-specific scoring function for chemical cardiotoxicity prediction. Toxicology. 2021;464:153018. https://doi.org/10.1016/j.tox.2021.153018
- [Google Scholar]
- Finding Constellations in Chemical Space Through Core Analysis. Front. Chem.. 2019;7 https://doi.org/10.3389/fchem.2019.00510
- [Google Scholar]
- Validation methodologies. In: Predictive Modeling of Drug Sensitivity Predictive Modeling of Drug Sensitivity. Elsevier; 2017. p. :83-107. https://doi.org/10.1016/b978-0-12-805274-7.00004-x
- [Google Scholar]
- DeepHIT: a deep learning framework for prediction of hERG-induced cardiotoxicity. Bioinformatics (Oxford, England). 2020;36:3049-3055. https://doi.org/10.1093/bioinformatics/btaa075
- [Google Scholar]
- Comparison of Automatic Three-Dimensional Model Builders Using 639 X-ray Structures. J. Chem. Inf. Comput. Sci.. 1994;34:1000-1008. https://doi.org/10.1021/ci00020a039
- [Google Scholar]
- A mechanistic link between an inherited and an acquired cardiac arrhythmia: HERG encodes the IKr potassium channel. Cell. 1995;81:299-307. https://doi.org/10.1016/0092-8674(95)90340-2
- [Google Scholar]
- Quantitative prediction of hERG inhibitory activities using support vector regression and the integrated hERG dataset in AMED cardiotoxicity database, Chem-Bio Informatics J. 21 2021:70-80. https://doi.org/10.1273/cbij.21.70
- [Google Scholar]
- Predicting hERG channel blockers with directed message passing neural networks. RSC Adv.. 2022;12:3423-3430. https://doi.org/10.1039/d1ra07956e
- [Google Scholar]
- The Catch-22 of Predicting hERG Blockade Using Publicly Accessible Bioactivity Data. J. Chem. Inf. Model.. 2018;58:1224-1233. https://doi.org/10.1021/acs.jcim.8b00150
- [Google Scholar]
- A fingerprint pair analysis of hERG inhibition data. Chem. Cent. J.. 2013;7:167. https://doi.org/10.1186/1752-153X-7-167
- [Google Scholar]
- Internal and external validation of predictive models: A simulation study of bias and precision in small samples. J. Clin. Epidemiol.. 2003;56:441-447. https://doi.org/10.1016/s0895-4356(03)00047-7
- [Google Scholar]
- A discriminant model constructed by the support vector machine method for HERG potassium channel inhibitors. Bioorg. Med. Chem. Lett.. 2005;15:2886-2890. https://doi.org/10.1016/j.bmcl.2005.03.080
- [Google Scholar]
- In silico prediction of hERG potassium channel blockage by chemical category approaches. Toxicol. Res.. 2016;5:570-582. https://doi.org/10.1039/c5tx00294j
- [Google Scholar]


