

Translate this page into:
Determination of the GC–MS analysis of seed oil and assessment of pharmacokinetics of leaf extract of Camellia sinensis L.
⁎Corresponding authors. saima.rubab@lmdc.edu.pk (Saima Rubab), siraj.bahadur@bs.qau.edu.pk (Saraj Bahadur),
-
Received: ,
Accepted: ,
This article was originally published by Elsevier and was migrated to Scientific Scholar after the change of Publisher.
Peer review under responsibility of King Saud University.
Abstract
Objective
History of the utilization of various parts of Camellia sinensis such as seed oil in different folklore medicaments and plants leaves for preparing green tea is very old. Pharmacokinetics (PK) plays a key role in the drug discovery stage by channelizing the medicinal chemist in the optimization process of chemical sequences and lends a hand to pharmacologists to invent in vivo studies. The objectives of the present study were to elaborate quantitative determination of phytochemicals and nutritional assessment of C. sinensis especially on the composition of seed oil of the local C. sinensis plant and to evaluate the pharmacokinetics of leaves extract in healthy volunteers.
Method
Determination of secondary metabolites and nutritional assessment of C. sinensis were carried out. The composition of seed oil was elaborated with the help of GC–MS analysis for its potential significance and evidence-based household uses as folklore but also for industrial applications. Pharmacokinetics of water extract of C. sinensis leaves was compared in 9 healthy human volunteers and divided into three groups (n = 3, in each) fasting, fed and fed with coke. Plasma concentrations were noted in each group and were quantified using a validated HPLC method.
Results
Phytochemical analysis and proximate analysis of C. sinensis suggests the presence of alkaloids, flavonoids, tannins, saponins sterols; and protein, lipids fiber and carbohydrate respectively. GC–MS of the C. sinensis seed oil shows the presence of linoleic acid 100%, palmitic acid 33.55%, stearic acid 21.96, caffeine 21.72 and vitamin E 14.49%. Pharmacokinetic studies suggest that in the fasting group, higher plasma concentration was found among all the volunteers.
Conclusion
The phytochemical analysis of green tea suggests that it is a good source of secondary metabolites full of important nutrients. GC–MS of seed oil reveals that seed of C. sinensis is a rich source of fatty acid, and can be used to fulfill the pharmaceutical need. Pharmacokinetic studies may help to develop the biomarkers for the green tea utilization and also would help to design the dose and dose frequency for achieving the significant absorption level. PK and PD also help to determine its plasma concentration and therapeutic efficacy.
Keywords
C. sinensis L.
Phytochemical
Pharmacokinetics
Nutritional assessment

1 Introduction
Green tea is made from the leaves extract of C. sinensis, a species of the Theaceae family. According to the manufacturing procedure, three main types of green tea are produced as a result of the difference in the fermentation procedure. The chief components present in the extract of green tea are catechins, polyphenols and caffeine (Kaya-Dagistanli et al., 2013). There are mainly four types of catechins present in the green tea, epigallocatechin gallate (EGCG), epicatechin gallate (EG), epigallocatechin (EGC) and epicatechin (EC). EGCG is the most abundantly found and the most pharmacological active compound. In addition to the catechin it also contains kaempferol, chlorogenic acid, quercetin, caffeic acid, myricetin, p-coumaric acid, quinic acid, and volatile oil like linalool, geraniol, and benzyl alcohol. There is an increasing trend in the utilization of green tea extract (GTE) in fat metabolism, its overall effect on living health and routine workout (Kyari, 2008).
The seed oil Camellia sinensis is one of the important vegetable oil that has been underutilized and exploited in most parts of the world (Yahaya et al., 2011). The quality of C. sinensis seed oil is also affected by the genotype and agronomic circumstances like plant age harvesting time, crop density and photosynthetic capacity. Other factors like light, temperature and pH of soil are of also prime importance (Ma et al., 2011). The tea contents are usually altered by the geographical region (Su et al., 2014). Fundamental components which are helpful for human health are the secondary metabolites present in the tea plant, such as caffeine, amino acid, and polyphenols (Anand et al., 2015). The regional diversity of quality inside the tea growing area can be linked with its gene variability as well as its environment (Sabhapondit et al., 2012).
To investigate the potentially active biochemical, pharmacokinetics provides more significant research methods for novel drug discovery. Market vision for recent research drugs has changed, now we demand not only the therapeutic effect of the drug with the minimal adverse effect but also focus on its good PK values (Su et al., 2014).
Nearly every person in the world takes tea about 120 mL per day (McKay and Blumberg, 2002). Globally, the consumer’s first choice is the black tea 76–78%, after that, green tea is consumed by 20–22% individuals and green tea, and oolong tea is 2% (Kaur et al., 2015). In Europe, North America and North Africa apart from Morocco black tea is used as a drink, whereas in China, Japan, Korea, and Morocco, green tea is mostly consumed in Japan and China oolong tea is the popular drink (Zuo et al., 2002). Approximately 80% of the USA population uses black ice tea. In Pakistan, poor and rich communities are equally getting a source of entertainment by drinking tea (Ahmad et al., 2012).
It is very important to explain the potential method of metabolism of GTE in humans. It is reported in a meta-analysis that the ethnicity greatly affects the GTE in population differences. As 1 g of green tea leaves dissolve in 100 mL of hot water contains 42–102 mg of total catechins and 25–43 mg of caffeine. It is also noted that GTE intake for a shorter period, mainly of EGCG and caffeine (1–2 h after ingestion) may affect prominently the sympathetic nervous system (Teschke et al., 2014).
The present study was aimed to study the effect of green tea leaves extract on the pharmacokinetics of healthy human volunteers, to explain their potential mechanism of GTE in body, to quantify its absorption in the blood after oral administration and to promote the utilization and production of fatty acids present in the seed oil of C. sinensis cultivated in Shinkiari, District Mansehra, Pakistan.
2 Materials and methods
C. sinensis was collected from National Tea & High-Value Crops Research Institute (NTHRI), Shinkiari, Mansehra, Pakistan in, 2018. Different morphological parts of plants like root, stem, leaf and seed (CS-r, CS-s, CS-l and CS-d) were collected. Leaves were collected in March courtesy of NTHRI for their plucking, de-enzyming, tea rolling, sieving and drying processes which are essential steps for making the green tea. Root, stem and seeds were collected in December. They were then kept in shade for 15 days for drying and were pulverized to a fine powder separately. Each powder was passed through sieve # 70 and stored in amber color bottles separately.
2.1 Quantitative determination of phytochemicals present in C. sinensis
2.1.1 Determination of alkaloids
Alkaloids were determined gravimetrically. C. sinensis root stem, leaves and seed powder of 2.5 g quantity were added separately into four 250 mL beakers, 100 mL 10% acetic acid in ethanol was added to each beaker and was incubated for 4 h. After 4 h, the contents of the beakers were filtered. The filtrate was heated on a water bath to concentrate to one-quarter quantity to which, concentrated ammonium hydroxide was added dropwise till the formation of precipitates. After precipitation of alkaloids, the solution was filtered on a pre-weigh filter paper WI and the precipitates were dried and were weighed as WF (Ruiz-Rodriguez et al., 2010).where X = weight of alkaloids (WF -WI), WI = weight of crucible, and WF = weight of crucible + solid residue
2.1.2 Determination of total flavonoids
For the quantitative determination of flavonoids, 10 g of powdered CS-r, CS-s, CS-l and CS-d were taken separately in four separating flasks and were extracted with 100 mL of 80% methanol solution. The contents of the flasks were filtered and were transferred into pre-weighed china crucibles for dryness (Bansode and Salalkar, 2015).where, X = weight of flavonoids (WF-WI), WI = weight of crucible, and WF = weight of crucible + solid residue
2.1.3 Determination of total tannins
Tannins were measured spectrophotometrically, for which 0.5 g samples of CS-r, CS-s, CS-l and CS-d were taken separately in four 50 mL plastic bottles and 50 mL distilled water was added. The contents of the bottles were shaken on a mechanical shaker for 1 h. The solutions were filtered in 50 mL measuring flasks and the volume was made up to the mark. Taken 5 mL filtrate of each sample into a test tube and 2 mL of 0.1 N FeCl3 in 0.1 N HCl and 0.008 M potassium ferrocyanide were added into the test tubes. The absorbance was measured at 120 nm within 10 min (Gul et al., 2017).where, Z = absorbance of the sample
2.1.4 Determination of total saponins
Saponins were determined gravimetrically, for which 20 g of CS-r, CS-s, CS-l and CS-d were added to four 250 mL conical flasks and 100 mL 20% aqueous ethanol was added to each sample flask. The contents of flasks were heated in a water bath for 4 h with continuous stirring at about 55 °C. The contents of the flasks were filtered and re-extracted with 100 mL 20% aqueous ethanol. The mixtures were again filtered and the filtrates were transferred to four separating funnels separately and 20 mL diethyl ether was added to each separating funnel, followed by vigorous shaking. Aqueous layers were recovered with the addition of 60 mL n-butanol and washed with twice of 5% aqueous NaCl. The contents of the aqueous layer were heated on a water bath for evaporation; the concentrated solution was dried in a pre-weigh china crucible as WI and after drying was weighed as WF (Abbas et al., 2015).where, X = weight of Saponins (WF-WI), WI = weight of crucible and WF = weight of crucible + solid residue.
2.1.5 Determination of sterols
For the determination of sterols, 2 g of CS-r, CS-s, CS-l and CS-d were taken separately in four 250 mL beakers, 75 mL distilled water and 35 mL 10% potassium hydroxide was added to convert chlorophyll into water-soluble chlorophyllin. The contents of the beakers were then transferred into four 250 mL separating funnels and sterols were extracted with 75 mL petroleum ether. The ether layer was collected in a pre-weighed beaker and was evaporated to collect sterols (Bashir et al., 2014).where, X = weight of sterols (WF-WI), WI = weight of beaker and WF = weight of beaker + solid residue
The results of the qualitative analysis of phytochemicals present in the samples are described in Fig. 1.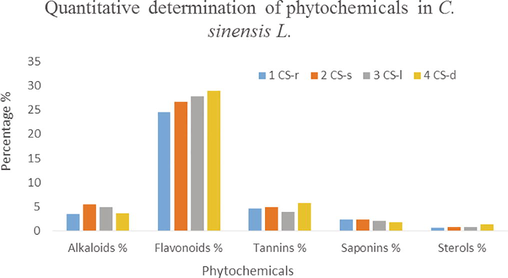
Showing the quantitative determination of phytochemicals of C. sinensis.
2.2 Nutritional assessment of C. sinensis L.
For the validation of nutritional significance, their proximate and nutritional analysis is necessary. Therefore, the proximate analysis of CS-r, CS-s, CS-l, and CS-d of C. sinensis have been carried out (Ruchi and Lalit, 2010; Al-asadiy, 2013).
2.2.1 Determination of moisture
Taken 10 g crushed CS-r, CS-s, CS-l, and CS-d in a pre-weigh china dishes separately and were oven-dried in an oven at 80 °C for 12 hrs. China dishes were removed from the oven, were placed in a desiccator and on cooling were weighed and by weight difference moisture was determined (Gupta and Kumar, 2017).
2.2.2 Determination of crude protein
Protein was determined by the Kjeldahl method on a dry matter basis. Taken 2 g crushed CS-r, CS-s, CS-l, and CS-d separately in digesting tubes and were digested in a mixture of sulfuric acid potassium sulfate, copper sulfate and selenium for 3–4 h. After digestion distillation of digested material for nitrogen was done with boric acid and sodium hydroxide. The ammonium borate the distillate product was titrated with 0.05 N sulfuric acid (Chen et al., 2006; 2008).
2.2.3 Determination of total lipids
The soxhlet extraction procedure was used for oil extraction. Weighed 4 g samples of CS-r, CS-s, CS-l, and CS-d were put in a separate extraction thimble while 200 mL of petroleum ether was used as a solvent. According to the post-extraction practice, oil was extracted persistently for 8 h at temperature 60–80 °C. The solvent was then evaporated by drying the extract at 103 °C to remove the remaining solvent. It was then cooled in the desiccator for 3 min and weighed again.
2.2.4 Determination of fiber
Boiled first, 1 g powdered CS-r, CS-s, CS-l, and CS-d of C. sinensis were with 1.25% 100 mL sulfuric acid and then with 1.25% 100 mL sodium hydroxide solution. The contents were filtered and washed with distilled water and were dried in the oven and ashed in the furnace at 550 °C for 1 h. By weight different percent fiber was calculated (Olszewska et al., 2001).
2.2.5 Ash determination
Taken 1 g of each sample CS-r, CS-s, CS-l, and CS-d in a crucible and was ashed at 600 °C in a furnace for 1 hr (Makkar et al., 1993).
2.2.6 Carbohydrate measurement
Carbohydrates = 100 – (Protein + Fat + Ash + Moisture)
The results of the proximate analysis of C. sinensis illustrated in (Table 1).
Nutrients
CS-r
CS-s
CS-l
CS-d
Proteins %
3.63
4.56
14.32
10.23
Lipid %
0.43
0.37
0.99
26.34
Fiber %
57.98
58.35
49.36
15.36
Ash %
3.16
3.63
5.02
4.67
Moisture%
5.45
6.47
5.43
5.94
Carbohydrates %
88.19
85.5
74.24
52.82
2.3 Extraction of C. sinensis of seed oil
The soxhlet extraction procedure was used for oil extraction. Green tea seeds were dried in shade for 7 days, and further dried in a hot air oven for 6 h to remove the excess of moisture. After drying seeds were crushed with the help of grinder. Place 10 g of the tea seeds powdered sample in the extraction thimble while 300 mL of petroleum ether was used as a solvent (Karthickeyan, 2019). According to the post-extraction practice, oil was extracted persistently for 6 h at temperature 50–55 °C. The solvent was then evaporated by drying the extract at 60 °C to remove the remaining solvent. C. sinensis seed oil (CS-o) was then cooled in the desiccator for 30 min and weighed again (Karthickeyan, 2019). Fig. 2 shows the GC–MS spectrum of seed oil of C. sinensis.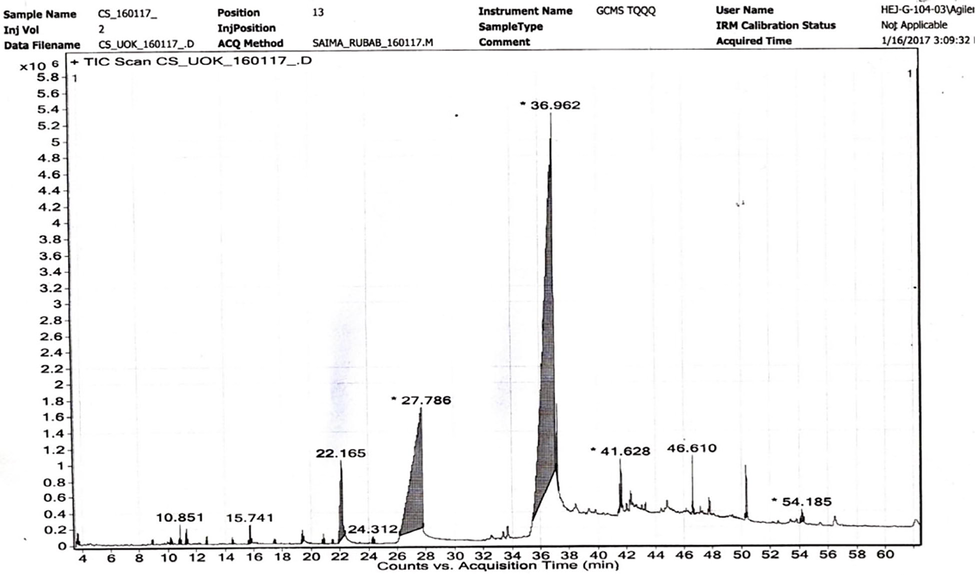
Showing the GCMS spectrum of C. sinensis seed oil.
2.4 Extraction of green tea leaves
Processed green tea leaves were crushed with help of mortar and pastel and passed through the sieve number 70. The extracted 250 g of powdered leaves were taken with 2.5L of distilled water at 95 °C. After filtration, the extract was condensed to thick consistency by heating. The dried extract was packed in the form 1 g dose in a clean dry container and placed in the refrigerator.
The protocol for the study was approved by the Human Ethical Committee; University of Karachi. All the procedure of blood sampling, centrifugation and mixing of enzymes and incubation was performed in the Pathology laboratory of Lahore Medical and Dental College with the help of phlebotomists and medical physician after taking the necessary permission. Nine healthy volunteers were between 20 and 35 years of age and weight about 50-85Kg was selected for the pharmacokinetics study. None of the volunteers was using medication such as antidiabetic, antihypertension and antiulcer and were not using alcohol or tobacco.
The demographics of each volunteer, such as the name, gender, age, and body weight was noted. The liver and renal profile of all individuals was recorded before the study. The volunteers were instructed not to take coffee, tea cola 2 days before the experiment. Before experimentation, they were kept fasted overnight, only they could have drunk water before. They were given a single dose of 1 g of a dried extract with 200 mL of water between 8 and 9 a.m.
2.5 Collection of blood and plasma
For determination of pharmacokinetics of green tea leave blood samples were collected from healthy human volunteers in heparinized tubes and centrifuged at 5000 rpm for 10 min at 4 °C. After centrifugation plasma samples were transferred to new tubes.
2.6 Construction of calibration curve for EGCG
HPLC was used for the quantitative analysis of EGCG. Before HPLC analysis, Spectrophotometric analysis (Agilent, UV/Visible Spectrophotometer) was done to confirm the presence of EGCG in the tea infusions. Maximum absorbance at 273 nm confirmed the presence of EGCG in the tea infusions.
For the HPLC analysis, the stock solution of EGCG was prepared in the mobile phase and the standard calibration curve was constructed using standard solutions in the working range i.e. 0.0039 mg/mL to 0.5 mg/mL. The actual concentration of the test method is 0.02 mg/ml. For the HPLC analysis, the quantitation was done at the maximum absorbance in the UV detector (273 nm). Here the correlation coefficient is 1 with the regression equation of y = 1979.8x + 18.262 (Ideal linearity). The results of repeatability (n = 6) demonstrated the intraday repeatability of the test method. The % CV for retention time, % peak purity and peak area met the required acceptance criteria of USP for repeatability <5%. In an accuracy-test, three different concentrations of samples run on the system, 80%, 100% and 120%. The accuracy response showed the results which are well in the specified limits.
2.7 Analysis of samples
Samples were analyzed through high-performance liquid chromatography (HPLC).
2.8 Testing method
The HPLC testing method was performed for its linearity, repeatability, precision, robustness and accuracy. Limit of detection (LOD) and limit of quantitation (LOQ) were also found (Oritani et al., 2013). HPLC Column Conditions were mentioned in Table 2. Results were mentioned in Tables 3–7. The mobile phase was prepared by mixing of buffer solution and acetonitrile in the ratio of 90:10 V/V. For standard preparation, EGCG was dissolved in methanol and then was mixed a diazomethane ether solution. For sample preparation, 50 μL of each plasma was mixed with 5 μL of β-D Glucuronidase, 5 μL of sulfatase and 20 μL of water followed by incubation at 37 °C for 45 min in EDTA tubes. Fig. 3a, b and c showed the graphical representation of data computed pharmacokinetics by non-compartmental approach, using PK-Solver (Zhang et al., 2010).
Parameters
Conditions
Column material
Di-isobutyl n-octadeceyl silane supported by porous silica
Dimension
ZorbexXDB– C8, 150 x4.6 mm (5 µm)
Flow rate
1.5 min/ml
Detector
UV at 240 nm
Injection volume
5 µL
Mobile phase
Acetonitrile: phosphoric acid containing 0.1 mM EDTA
Column temp
40 °C
Applied potential
600 mV
Target Conc. (mg/mL)
Load (µg)
Peak Area
%Peak Purity
0.0039
0.039
79.84
100
0.0078
0.078
161.68
100
0.0156
0.156
319.36
100
0.0313
0.313
630.72
100
0.0625
0.625
1265.44
100
0.125
1.25
2531.88
100
0.25
2.5
4973.76
100
0.5
5
9904.52
100
Injection
Retention time
% Peak Purity
Peak Area
1
1.682
100
451.54
2
1.686
100
450.94
3
1.684
100
451.15
4
1.701
100
453.68
5
1.682
100
450.14
6
1.681
100
449.97
Average
1.686
100
451.24
SD
0.008
0.000
1.339
%CV
0.45
0.00
0.30
Days
Peak Area
Inter Day
Inter Samples
Inject 1
Inject 2
Inject 3
Mean
Mean
SD
% CV
Mean
SD
% CV
1.
460
461
462
461
454.11
5.82
1.28
455.39
5.38
1.18
2.
452
452
455
453
3.
450
450
445
448
1.
462
466
459
462
456.67
4.90
1.07
2.
456
455
456
456
3.
452
451
453
452
Concentration Percentage
Standard Peak Area
Sample Peak Area
Standard Peak Area
80%
N/A
368.19
369.22
370.1580.22%
100%
460.52
459.00
461.15461.12
460.22
459.1599.99%
120%
N/A
552.26
553.15
552.05120.05%
Injection
“Used” Column
“New” Column
Mean
%CV
Peak Area
1
356
357
354.50
1.11
2
352
359
3
348
355
% Peak Purity
1
100
100
100
0.00
2
100
100
3
100
100
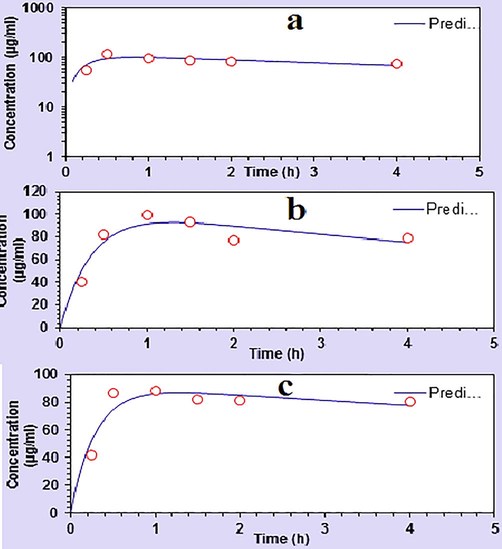
a). Showing the graphical representation of statistical plasma concentration for fasting group. b) Showing the graphical representation of statistical plasma concentration for fed group I. c) Showing the graphical representation of statistical plasma concentration for fed group II.
3 Results and discussion
The quantitative analysis of phytochemicals of CS-r, Cs-s, CS-l and CS-d revealed that flavonoids were present in maximum quantity in all parts while sterol was present in a very negligible amount, also confirmed from literature (Kaya-Dagistanli et al., 2013). Table 1 showed that CS-l and Cs-d have a high content of protein, Cs-d is a rich source of lipids and fiber content is high in all the parts. All the tests were performed on a dry matter basis and the quantities of nutrients were according to the literature (He et al., 2011).
. GC–MS study is used to evaluate the occurrence of fatty acid and esters in the sample (Wang et al., 2020). CS-o consists of a major amount of unsaturated fatty acids which are helpful for its absorption and digestion. Unsaturated fatty acid composition of its oil contents fulfills the international nutritional standards of omega meals. GC–MS analysis is also helpful for the determination of the chemical composition of the samples (Ishtiaq et al., 2020; Rubab et al., 2020) as shown in Fig. 2. Linoleic acid is a chief fatty acid from omega-three, have a vital role in the physiology of human, growth of the nervous system, essential component of cell membrane which is linked with neurotransmission, cognitive function and key role in the synthesis of hemoglobin by transferring the O2 to the blood plasma. Seed oil can be used in many pharmaceutical and industrial products like soap, lubricants, paints, margarine, hair oil and rust proofing. CS-o can be used for nutritional, pharmaceutical and therapeutic purposes (Lee et al., 2002). The results showed that collection time, geographical and environmental differences play a key role in fatty acid composition despite the method of extraction the structures were confirmed from literature a well (Ruchi and Lalit, 2010).
There is no strong evidence of determining the comparative absorption of green tea in fasting, fed and fed with coke group before. In Asian countries especially of the subcontinent, there is an increasing trend for the utilization of green tea either in an empty stomach. Usually, after a heavy protein diet, people tend to take green tea. Many people use coke with their food but still in the end they cheer the green tea. Keeping in view the above in mind, we mimic the above conditions and bioavailability of green tea is monitored in the fasting group, a fed group without coke and fed group with coke is determined (with heavy protein diet in later two groups). Generally, the methylation of the hydroxyl group increases the absorption of the hydrophobicity and hence improved the absorption of flavonoids (Wen and Walle, 2006). Metabolic flexibility which is the ability to respond to the signals (fasting and fed state) involving the in the change of metabolism of healthy individuals are fast and complete (Hodgson et al., 2013). According to the previous data, the absorption of green tea is not so high due to enzymatic hydrolysis (Oritani et al., 2009). The enhanced efficiency and decreased toxicity of a patient’s drug therapy is the principal objective of clinical pharmacokinetics (Li et al., 2016). The plasma concentration of the green tea was higher in the fasting group, lower in fed without coke group and least in the fed with coke group (120.56 μg/mL, 99.59 μg/mL and 88.14 μg/mL), respectively. Tmax for fasting group was brief while Tmax for fed without coke group and fed with coke not only the same but also was high (0.50 h, 1.0 h and 1.0 h) respectively. Half-life is the fasting group was intermediate and short in fed without coke group while fed with coke group had prolonged half-life (11.11 h, 10.29 h and 67.97 h), respectively. Similarly mean residence time of fasting group was intermediate and short in fed without coke group while in fed with coke group drug prolonged for longer period of time (16.12 h, 15.32 h and 98.23 h). It indicated that cock has increased the absorption and sustained the concentration in the body for the longer period of time, may be by reducing the clearance. Similarly volume of distribution of the drug in the groups was in the same trend as that of the half-life and MRT as (10.43 mL, 9.95mLand 12.02 mL) respectively. Clearance of the drug was intermediate in fasting group and was high in fed without coke group while brief in fed with coke group (0.65 mL/h, 0.67 mL/h and 0.12 mL/h), respectively.
These results showed that in the fasting group high plasma concentration was achieved and maintained for a long time with intermediate half-life. Similarly, the mean residence time, volume of distribution and clearance was also intermediate in the fasting group. While in the fed group without coke plasma concentration was lower than the fasting group with high Tmax. Half-life was also lower than fasting but drug stayed for lesser time (MRT) in the body with a brief volume of distribution and short half-life. The half-life of the drug was maximum and drug retained for the maximum period (MRT) in this group with a high volume of distribution and brief clearance. Further, taxonomic (Ali et al., 2020; Amina et al., 2020; Bahadur et al., 2020) studies of this plant are also recommended.
4 Conclusion
The phytochemical analysis of green tea suggests that it is a good source of secondary metabolites full of important nutrients. GC–MS of seed oil reveals that the seed of C. sinensis is a rich source of fatty acid, and can be used to fulfill the pharmaceutical need. Absorption of the green tea leaves extract is observed in all three groups however fasting group suggests more absorption as compared with other groups. Further investigations are recommended, to explain the effect of green tea in fasting, fed and fed with coke to determine its possible underlying mechanism.
Acknowledgment
We are thankful to Prof. Dr. Nadeem Irfan Bukhari for facilitating the Pharmacokinetics analysis of green tea leaves.
Funding
This research project was not supported by any grant.
Declaration of Competing Interest
The authors declare that they have no known competing financial interests or personal relationships that could have appeared to influence the work reported in this paper.
References
- Pharmacognostic evaluation of Musa paradisiaca L. bract, flower, trachea and tracheal fluid. World J. Phar. Pharm. Sci.. 2015;4:1461-1475.
- [Google Scholar]
- Effect of diffferent covering materials and storage durations on the field performance of tea stump seedlings. Sarhad J. Agric. 2012;28(2):201-205.
- [Google Scholar]
- Catechin extraction and purification of green tea (Camellia sinensis) and using it in treatment the candida albicans. AOAS. 2013;2(19):1-10.
- [Google Scholar]
- Foliar epidermal micromorphology and its taxonomic significance in Polygonatum (Asparagaceae) using scanning electron microscopy. Microsc Res Tech.. 2020;1–10
- [CrossRef] [Google Scholar]
- Microscopic investigation of pollen morphology of Brassicaceae from Central Punjab‐Pakistan. Microsc. Res. Tech.. 2020;83(4):446-454.
- [Google Scholar]
- Biochemical characterization and pharmacognostic evaluation of purified catechins in green tea (Camellia sinensis) cultivars of India. 3 Biotech. 2015;5(3):285-294.
- [Google Scholar]
- Phytochemical analysis of some selected Indian medicinal plants. Int J Pharm Bio Sci.. 2015;6(1):550-556.
- [Google Scholar]
- Taxonomic study of one generic and two new species record to the flora of Pakistan using multiple microscopic techniques. Microsc. Res. Tech.. 2020;83(4):345-353.
- [Google Scholar]
- Assessment of bioautography and spot screening of TLC of green tea (Camellia) plant extracts as antibacterial and antioxidant agents. Indian J. Pharm. Sci.. 2014;76(4):364.
- [Google Scholar]
- Simultaneous determination of total polyphenols and caffeine contents of green tea by near-infrared reflectance spectroscopy. Microchem. J.. 2006;83(1):42-47.
- [Google Scholar]
- Nondestructive identification of tea (Camellia sinensis L.) varieties using FT-NIR spectroscopy and pattern recognitionNondestructive identification of tea (Camellia sinensis L.) varieties using FT-NIR spectroscopy and pattern recognition. Czech J. Food Sci.. 2008;26(No. 5):360-367.
- [Google Scholar]
- Preliminary phytochemical screening, quantitative analysis of alkaloids, and antioxidant activity of crude plant extracts from ephedra intermedia indigenous to Balochistan. Sci. World J.. 2017;2017:1-7.
- [Google Scholar]
- Evaluation of in vitro antimicrobial potential and GC–MS analysis of Camellia sinensis and Terminalia arjuna. Biotechnol. Rep,. 2017;13:19-25.
- [Google Scholar]
- Research progress on the health function of tea oil. J. Med. Plant Res.. 2011;5(4):485-489.
- [Google Scholar]
- The effect of green tea extract on fat oxidation at rest and during exercise: evidence of efficacy and proposed mechanisms. Adv. Nutr.. 2013;4(2):129-140.
- [Google Scholar]
- Antioxidant potential and chemical characterization of bioactive compounds from a medicinal plant Colebrokea oppositifolia Sm. An Acad Bras Cienc.. 2020;92(2):e20190387
- [CrossRef] [Google Scholar]
- Effect of combustion chamber bowl geometry modification on engine performance, combustion and emission characteristics of biodiesel fuelled diesel engine with its energy and exergy analysis. Energy. 2019;176:830-852.
- [Google Scholar]
- Estimation and comparison of total phenolic and total antioxidants in green tea and black tea. GJBB. 2015;4(1):116-120.
- [Google Scholar]
- The effects of alpha lipoic acid on liver cells damages and apoptosis induced by polyunsaturated fatty acids. Food Chem. Toxicol.. 2013;53:84-93.
- [Google Scholar]
- Pharmacokinetics of tea catechins after ingestion of green tea and (−)-epigallocatechin-3-gallate by humans: formation of different metabolites and individual variability. Cancer Epidem. Biomar.. 2002;11(10):1025-1032.
- [Google Scholar]
- Pharmacokinetics applications of traditional Chinese medicines. World J. Trad. Chin. Med.. 2016;2(1):42-47.
- [Google Scholar]
- Fatty acid composition of Camellia oleifera oil. J. Verbr. Lebensm.. 2011;6(1):9-12.
- [Google Scholar]
- Gravimetric determination of tannins and their correlations with chemical and protein precipitation methods. J. Sci. Food Agric.. 1993;61(2):161-165.
- [Google Scholar]
- Quantitative determination of flavonoids in the flowers. Acta Pol. Pharm.. 2001;58(3):199-203.
- [Google Scholar]
- Mechanism of anti-obese effects of 'benifuuki' green tea. J. Japan. Soc. Food Sci. Technol.. 2009;56(7):412-418.
- [Google Scholar]
- Comparison of (−)-epigallocatechin-3-O-gallate (EGCG) and O-methyl EGCG bioavailability in rats. Biological ^|^ Pharmaceut. Bull.. 2013;36(10):1577-1582.
- [Google Scholar]
- Neuropharmacological potential of various morphological parts of Camellia sinensis L. Saudi J. Biol. Sci.. 2020;27(1):567-573.
- [Google Scholar]
- Characterization of caffeine isolated from Camellia sinensis leaves of Sikkim Himalayan Region. J. Chem. Pharm. Res.. 2010;2(4):194-198.
- [Google Scholar]
- Recent trends in the advanced analysis of bioactive fatty acids. J. Pharm. Biomed. Anal.. 2010;51(2):305-326.
- [Google Scholar]
- Diversity of catechin in Northeast Indian Tea Cultivars. Sci. World J.. 2012;2012:1-8.
- [Google Scholar]
- Chemical composition of seed oils in native Taiwanese Camellia species. Food Chem.. 2014;156:369-373.
- [Google Scholar]
- Green tea extract and the risk of drug-induced liver injury. Expert Opin. Drug Metab. Toxicol.. 2014;10(12):1663-1676.
- [Google Scholar]
- Experimental investigation on pumpkin seed oil methyl ester blend in diesel engine with various injection pressure, injection timing and compression ratio. Fuel. 2020;264:116868.
- [Google Scholar]
- Methylated flavonoids have greatly improved intestinal absorption and metabolic stability. Drug Metab. Dispos.. 2006;34(10):1786-1792.
- [Google Scholar]
- Compositional analysis of tea (Camellia sinensis) seed oil and its application. Res. J. Chem. Environ. 2011;1(2):153-158.
- [Google Scholar]
- PKSolver: an add-in program for pharmacokinetic and pharmacodynamic data analysis in Microsoft Excel. Comput. Methods Programs Biomed.. 2010;99(3):306-314.
- [Google Scholar]
- Simultaneous determination of catechins, caffeine and gallic acids in green, Oolong, black and pu-erh teas using HPLC with a photodiode array detector. Talanta. 2002;57(2):307-316.
- [Google Scholar]


