

Translate this page into:
Detecting hydrocarbon micro-seepage and related contamination, probable prospect areas, deduced from a comparative analysis of multispectral and hyperspectral satellite images
⁎Corresponding author. falshehria@ksu.edu.sa (Fahad Alshehri),
-
Received: ,
Accepted: ,
This article was originally published by Elsevier and was migrated to Scientific Scholar after the change of Publisher.
Peer review under responsibility of King Saud University.
Abstract
Detecting mineralogical alteration by hydrocarbon micro-seepage from trap to surface across the deformed structure, through Comparative analysis study of hyperspectral image (EO-1, Hyperion), and multispectral (landsat7 and Advanced land imager (Ali) to map soil alteration by petroleum seepage with applying remote sensing techniques as (band ratios, supervised, SAM classification, and hydrocarbon detection and index (HD and HI) calculation to detect the potentiality of hydrocarbon seepage in the area. The type of spectral resolution accuracy available for each space imaging platform can be used to choose which is best in determining the target and whether exploration yields oil. Hyperspectral remote sensing data are integrated with a GIS framework Weighted Sum (Spatial Analyst) classified hydrocarbon seepage prospects into five potential zones very good, good, intermediate, poor, and very poor probable potentiality. The spatial lithologic carbonaceous alteration appears closely coincident along reactivated leaking faults that cause hydrocarbon micro-seepage and altered surface lithology and mineralogical cement. The hyperspectral images have proven their worth in identifying and studying hydrocarbon leaks and the resulting environmental pollution and mineral alteration, as well as use micro-seeps as a pathfinder to locations of new oil explorations discoveries that can use as a pre-drill prediction of hydrocarbon occurrence and detected a prospect area for hydrocarbon drill.
Keywords
Remote sensing
Soil alteration
Micro-seepage
Hydrocarbon potentiality
Leaking fault
Hyperspectral

1 Introduction
Hydrocarbons migrate upward from hydrocarbon structure traps as micro-seepage to the surface causing lithological alteration and environmental pollution. Many oil companies tried to discover areas where hydrocarbons were leaking, hundreds of years ago in order to obtain petroleum. Hydrocarbon exploration is expensive and time-consuming, requiring the employment of numerous kinds of exploration such as geophysical surveys, geological interpretation, and geochemical analyses. Recently, researchers have attempted to employ alternate, less expensive, and faster approaches to provide early data that advise the presence of new exploration locations, Garain et al. (2019). Many researchers investigated the influence of hydrocarbon seepage on various land cover types such as plant change caused by microbiological anomalies, and soil alterations distinguishable from nearby soil/rock. Based on an aircraft remote sensing image studied such as Asadzadeh and de Souza Filho (2017), studied the spectral response for hydrocarbon seepage, Schimmelmann et al. (2018) in Midwest USA hydrocarbon seepage, Garain et al (2019), Huang et al. (2019) studied the hydrocarbon micro seepage on the plant using a hyperspectral image, De la Rosa et al. (2021) also Tveit et al. (2021), (Tian, 2012) and Ellis (2002)studied hydrocarbon seepage reflectance Also, Shu-Fang et al. (2008), studied Spectral indicators of oil seepage on vegetation, Kühn et al. (2004) using hydrocarbon index for oil indicator, Kruse et al.(2003) compare the hyperspectral data for mineral mapping, and Schumacher (1996) studied the hydrocarbon soil alteration. There are no studies in the study area or in Egypt that follow the same strategy as this research.
The present work presents a new approach in geo-remote sensing by integrating subsurface geology from seismic data and wells with remote sensing and GIS techniques to determine the possibility to reach the possible places of exploration by studying the mineral change of the rocks affected by the leak, by mapping and identifying some minerals that are considered the evidence and accompanying the oil leak. Using remote sensing techniques such as (band ratio, SAM classification, PCA, Hydrocarbon detection calculation, and GIS Weighted sum method) trying to link the results together and then determine the success of this technology in achieving the goal or not.
The geological structures of the study area act as petroleum traps were studied using seismic and oil wells data, which proved the presence of leakage through structural deformation of some wells through subsurface study, El-Hadidy et al. (2016) which led to thinking about completing the research, focusing on dry wells with traces of oil. So, instead of spending a lot of time and money on traditional geophysical methods, try to get the best remote sensing data you can and then use Geographic information systems (GIS) to link and integrate the results.
The mineral change of the surface rocks affected by the hydrocarbons leaks detects by remote sensing applications and techniques by using comparative analysis for spectral signature and radiometric calibration for hyperspectral (EO-1) image with 220 spectral bands <10 nm bandwidth and multispectral image (ALI) with 10 spectral bands and Landsat7 ETM+ with 7bands of 60–120 nm bandwidth.
Hydrocarbon leakage is associated with subsurface deformed structure, especially the open fault that acts as corridors through which oil escapes to the surface. This research utilizes multispectral images Landsat, Ali, and hyperspectral images for mapping, evaluating, and detecting the leaking potentiality of hydrocarbon and studying the mineral associated with rock alteration accompanying this leak.
1.1 Study area
The study area located in the Western Desert of Egypt, the north-eastern part of Sallum, at the Mediterranean Sea coast, bounded by longitudes 25° 40′ and 26° 15′E, latitudes 31° 5′ and 31° 40′N, consider a part of Matruh Basin with high hydrocarbon accumulation, contain many exploration wells (Fig. 1).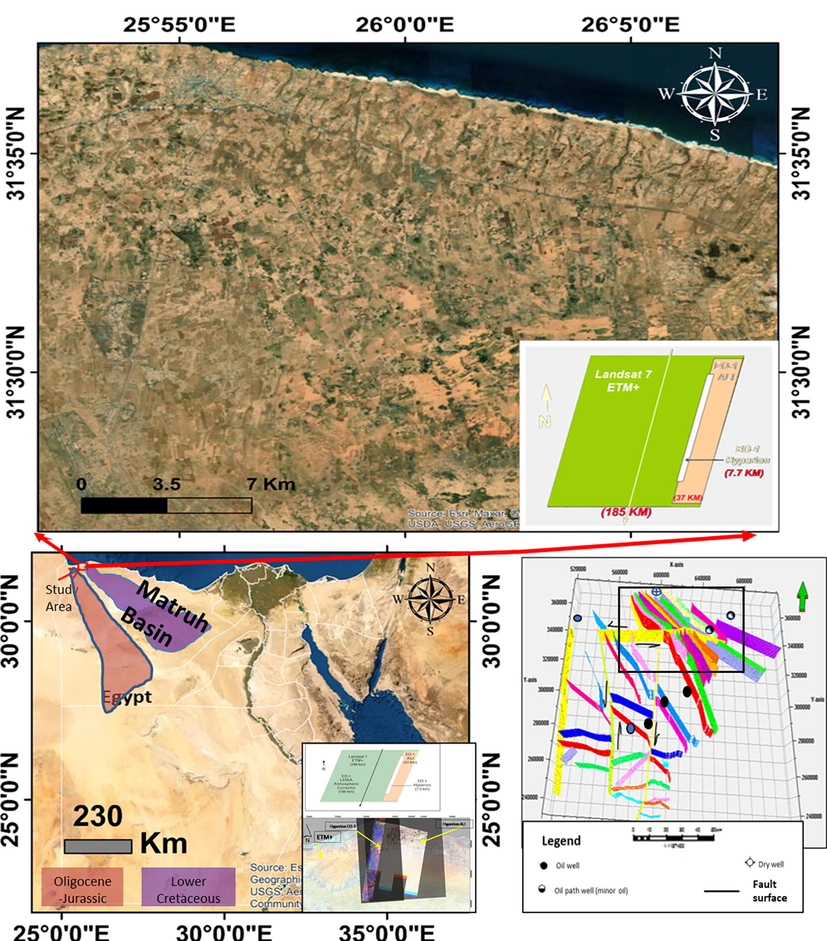
Location map of the study area and spatial relationship between different satellite images used, 3D subsurface fault map with well locations (after El-hadidy et al., 2016).
The northern Western Desert is a plateau covered with Neogene sediments, a Marmarican Homoclinal plateau extending between Alexandria and El-Sallum with an area of about 216,000 km2, with different lithological units and structures reflecting various environmental conditions, play a significant role in the oil accumulation. The study area was subjected to various tectonic regimes over varying time intervals, which had an effect on the hydrocarbon accumulations affected by the Syrian arc system, which began in the Cretaceous and progressed through the Tertiary and Quaternary periods, with structure trends NW-SE and NE-SW, (Shata, 1955). Late Cretaceous-Eocene is considering the main kitchen for hydrocarbon, many tectonic deformations and structure control cause the accumulation of hydrocarbons formed high potential reservoirs – Cretaceous deposits (Abu El Naga, 1984). The research region was tectonically paleo-active, folded, and divided into blocks by intersecting normal faults extending in various trends (NNW-SSE orientations with right-lateral strike-slip movement), and NE-SW (ENE-WSW left-lateral strike-slip fault). There are multiple notable NW-SE, ENE-WSW, WNW-ESE, and N-S fault trends based on the examination of the two-way time (TWT) structural contour maps of the Cretaceous and Tertiary rock units, El-Hadidy et al. (2016).
2 Data and method
Used satellite images downloaded from the USGS website (https://earthexplorer.usgs.gov), with Path = 180, Row = 38, (Fig. 1). Hyperion (EO-1) satellite-enabled the work high image detailed, and (Aster DEM with 30 m resolution) data which was used for the detailed processing and verification of Landsat processing results. Characteristics of satellite images used for this analysis are summarized in Table 1.
Attribute Sensors
EO-1 (HYPERION)
EO-1 (ALI)
Landsat-7
Sensor type
hyperspectral
multispectral
multispectral
Acquisition date
2015-08-16
2015-08-16
2015-07-26
No. of bands
242
10
8
VNIR Range
Bands.(8–57)
(436 nm–926 nm)Bands.1–6
(0.433–0.890 nm)Bands.(1–4)
(0.450–0.890 nm)
SWIR Range
Bands.(8–57)
(932 nm–2395 nm)Bands.(7–9)
(1.200 nm–2.350 nm)Bands.(5–7)
(1.550 nm–2.350 nm)
Bands for “HD and HI” calculation
B115, B116, B117, B156, 158 and 159
B5-B7
B5-B7
overlapping and inactive bands were removed
bands (1–7, 58–78, and 225–242, after 31)
Subset bands
B86, B115, B116, B117, B126, B154, B156, B158, B159, B175, B195, B205, B214
B216, B218
Spectral resolution and range
426–2395 nm
(10 nm)433–2350 nm (variable)
441–2345 nm (variable)
Spatial resolution
30 m
30 m
30 m
Swath width
7.6 km
36 km
185 km
Spectral coverage
Continuous
Discrete
Discrete
PAN band resolution
N/A
10 m
13 × 15 m
To achieve the Main objectives, analyze the spectral signature of hydrocarbon seeps and possible associated carbonaceous minerals as a pathfinder for leaking by detailed classified mapping and different band math calculations to detect the altered minerals act as good indicators for the presence of micro-seepages. Finally, mapping the potential hydrocarbon using multispectral and hyperspectral images, linking the lithological change to the geological structures in the area (faults) by Gis, and knowing whether the leakage through the faults can be known in advance by using remote sensing images and achieve the objective of the study.
Surface geology of the study area extracted from DEM image by directional filter technique, analysis of the linear features extracted from these data will help to interpret and understand the surface geologic structures (faults) in the area by GIS.
Digital image processing for remotely sensed data including, enhancement and visualization of false-color composite images, classification method using minimum noise fraction (MNF) and (SAM), band rating, principal components analysis (PCAs) to produce a detailed classified mineralogical and structure maps and extract spectral information that is difficult or impossible to see from the raw data.
All images processed with ENVI 5.1., spectral library database (USGS spectral or JPL spectral) to compare the spectral signature, then used ArcGIS used to link results and maps to reach the best comparisons and zoning the hydrocarbon probable potentialities. The work flowchart for the present investigation illustrated in Fig. 2.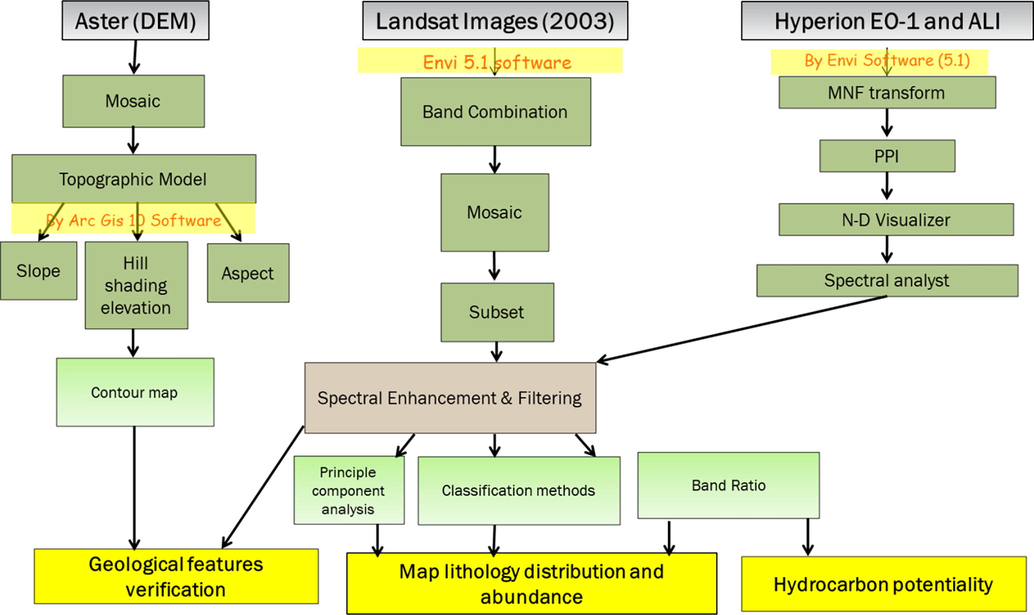
Flow chart for the applied satellite image processing procedures.
2.1 Image enhancement
Image enhancement techniques improve and clarify raw data of interest by introducing subtle differences in spectral characteristics and data signatures, making the features easier to study and comprehend. Various enhancement procedures were applied to the remote sensed image, Contrast enhancement, Histogram equalization, Linear stretch, ….Sh.M. El-Hadidy(2020).
2.2 Principal component analysis (PCA):
PCA aims to focus and compress the image's spectral information with different units from n spectral bands to a definite number of bands, particularly the first four, which contain the image's high contrast differences data, calculate and convert to a new coordinate system to improve the display units (Sabins, 1997). This method is very useful in focusing on the contrasts in the image and enhancing it (e.g. Farag et al., 2019; Abdelmalik, 2020), Especially the hyperspectral images that consist of many bands (220 bands), focusing and separating them into a few bands to facilitate the study.
2.3 Band ratio and band algebra
This is a method based on calculating the spectral value (DN) in one band with high reflectance and dividing it by the qualitative value in the corresponding band, to show one of the phenomena as one of the value minerals from the rest of the image's components, mineral separated and evaluated from the image, (Sabins, 1997). Band algebra can apply mathematical equations that combine more than one band and put the output in R, different output in G, and another calculated output in B instead of using a single band. Discriminate different geologic rock units better than when separate bands are used in the RGB color combination images (Abdelmalik and Abd-Allah, 2018; Fowler et al., 2020).
The following ratios are most widely used, mineral indices calculated clay mineral (B5/B7), ferrous iron minerals (B3/B1), and iron oxide (B4/B2) to identify possible spectral anomalies related to hydrocarbon-induced soil alteration in the Landsat-7 image analysis, hydrocarbon concentration in the soil by the following ratio [(B2/B3), (B4/B3), ((B2/B3- B4)/B3)) in RGB, This indexes connected to feature attributes can lead to the identification of regions with anomalous readings and locations with higher hydrocarbon content. band ratio (B195/B220), and (B205/B218) for Hyperion data.
Hydrocarbon contamination and alteration were detected by two principal computations of band algebra: (HD), (HI) calculation. A band ratio (index) created from each spectral signature using average reflectance of two bands, one covering the spectral range from 2.211 to 2.223 µm and another including the spectral region between 2.309 and 2.346 µm, hydrocarbon-bearing substance absorption features peaks centered at 1732 and 2310 nm, Fig. 4. “Multispectral index”, two bands were used to create an index of SWIR7/SWIR5, also used [(B2/B3), (B4/B3), ((B2/B3) - B4)) / B3)) in RGB] in ETM+ for hydrocarbon detection anomalies and for (Ali) apply the following ratio [(B9/B8), (B7/B5), ((B3/B4) – (B5/B4))] in RGB. The hydrocarbon index is calculated upon the formula of (Kühn et al. 2004), and Cloutis (1989) “Hyperspectral index”, based on the ratio.
When HD > 1 indicates potential hydrocarbon (after NASA, 2006).
2.4 Weighted Sum (spatial analyst)
Weighted Sum works by multiplying the set weight by the chosen field values for each input raster. It then sums (adds) all of the input rasters (hyperspectral classified image, HI, HD, alteration minerals result from band algebra) to produce an output raster (probable potentiality of the prospect area).
2.5 Data classification
The supervised classification process is used to digitally map the land cover classes.
2.5.1 Spectral hourglass processing scheme including (The spectral Angle Mapper (SAM)):
Classify the image based on evaluation of the variance and covariance of endmember spectral patterns, and evaluate the unknown pixel. The most accurate classification method depends on statistical calculations, including many steps such as (Minimum Noise Fraction) which compress the raw data and decorrelate the data to a new coordinate dimension to reduce the raw data to a definite number of bands, and Pixel Purity Index-Mapping (PPI) which determine the purest pixel to detect and extract the n- endmember using the n-Dimensional-Visualizer tool, then classified endmember compared with reference signature from the spectral libraries, then subset the compressed data from MNF and inverse MNF with few bands which used in classification, (Research Systems, Inc., 2005).
The (SAM) classifies image pixels by using the PPI index, mapping the specific targets using the previous various minerals or rocks with different spectral characteristics in the spectral range from 400 to 2500 nm, the SWIR spectral range (2000–2500 nm) covers several important spectral features of minerals; we focus on this range of which the Hyperion has 40 bands.
2.6 Lineament extraction
Lineament extraction and interpretation from satellite images were done manually or automatically. The mapping of slope and aspect has been determined for the detection of faults by using several hill shading and directional filtering techniques with different angles (45-60-90-180-270- and 360).
2.6.1 Edge enhancement
Edge enhancement, as well as directed filters in various orientations 90 and 180° with low pass and high pass, emphasizes signatures, identifying linear characteristics such as faults and joints (El-Hadidy, 2021).
3 Result and discussion
Band ratio results enable to discriminate different soil alterations. The Landsat ETM+ ratio (B3/ B1), (B5/B7) and (B3/B5) in (RGB) respectively, (B4/B5), (B5/B7) and (B3/B1), (Fig. 3) has a color variation show more geologic contrast between units to discrimination lithological unit than a visual false-color image. (B4/B5) dominate silicate and hydroxyl bearing rocks brighter related to surrounding, the grayscale (B3/B1) detects iron-bearing rocks with high reflectance in 600 µm related to other rock types which appear brighter than surrounding rock.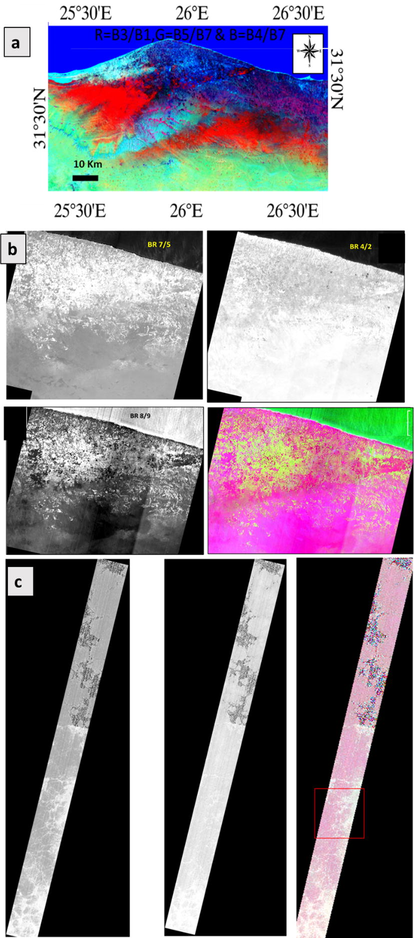
Band ratio applied in the different remote sensing data for lithological discrimination, a) Landsat TM+, b) ALI c) hyperspectral.
For mineral mapping band ratio of (B7/B4) dominated carbonate-bearing lithologic units with high reflectance in 2300 µm show brighter than other units. (B5/B7) appears clay-bearing rock with high reflectance in 2200 µm will and can be separated(Fig. 4).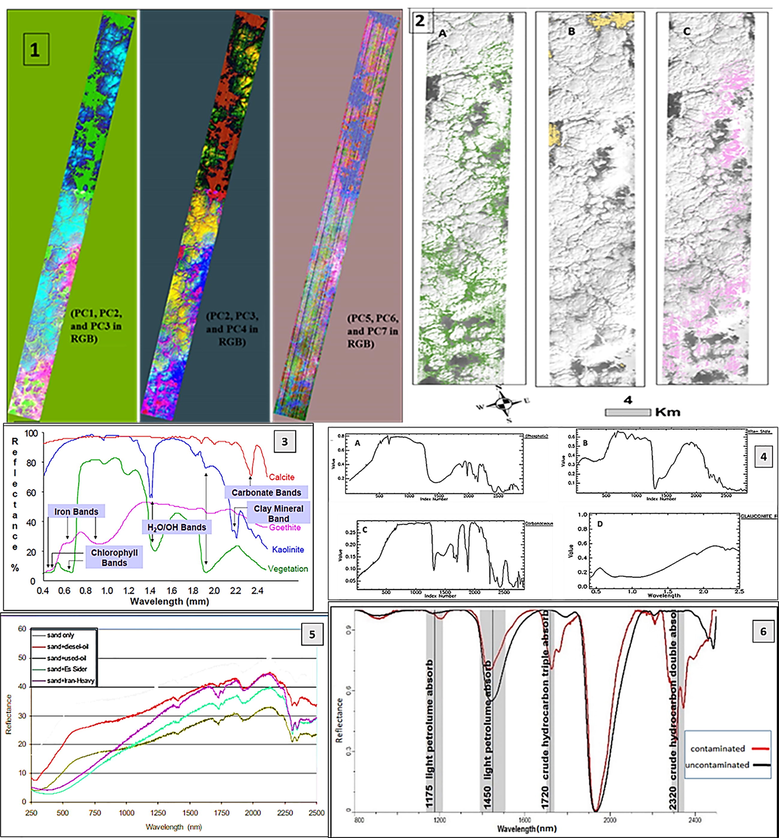
1) False-color composite principal component analysis image. 2)-Hyperion EO-1 lithological alteration overlay. A) Glauconitic overlay, B) Ferrous overlay, C) Phosphatic overlay. 3) Spectral signatures of different target rocks and minerals (Andreoli et al., 2007). 4) spectral reflectance behavior of A) phosphatic sand, B) illite shale, C) Carbonaceous shale, and D)Glauconitic sand. 5) Contaminated and uncontaminated soil reflectance and spectral signature after (Andreoli et al., 2007) and (Rangzan et al., 2020).
(B195/B220) of hyperspectral data for silica discrimination, while (B205/B218) for carbonate discrimination, (B207/B220) for clay discrimination which appears as bright in the image, (Fig. 3).
Various applied techniques and visual interpretations show the principal component images highlighting the different lithologies' boundaries (Fig. 4). The PCA1 contains the main topography criteria not used to decrease the topographic effects, PCA 2,3,4 shows the main data in the image giving high contrast of image information enabling to separate lithological units, and the PCA bands above 4 show noise data, not used in the study. The PCA 1 to 3 considering the higher Eigenvalues, often contain higher spectral information content, whereas weak values suggest non-distinguishing differences that may be ignored. The generated PCA maps provide the best-selected spectra for determining the mineral alteration caused by the oil spill. The Spectral Angle Mapper (SAM) is considered one of the best classification methods to map the lithological units and detect altered and unaltered zone. The resulted ETM+ is classified into main six dominant classes: seawater, sandstone, limestone, iron as cement, shale, and siltstone (Fig. 5), results obtained are poor, with restricted separation can separate vegetation, red-weathered sandstone, and carbonate classes although the incomplete separation between detrital and nondetrital alteration minerals.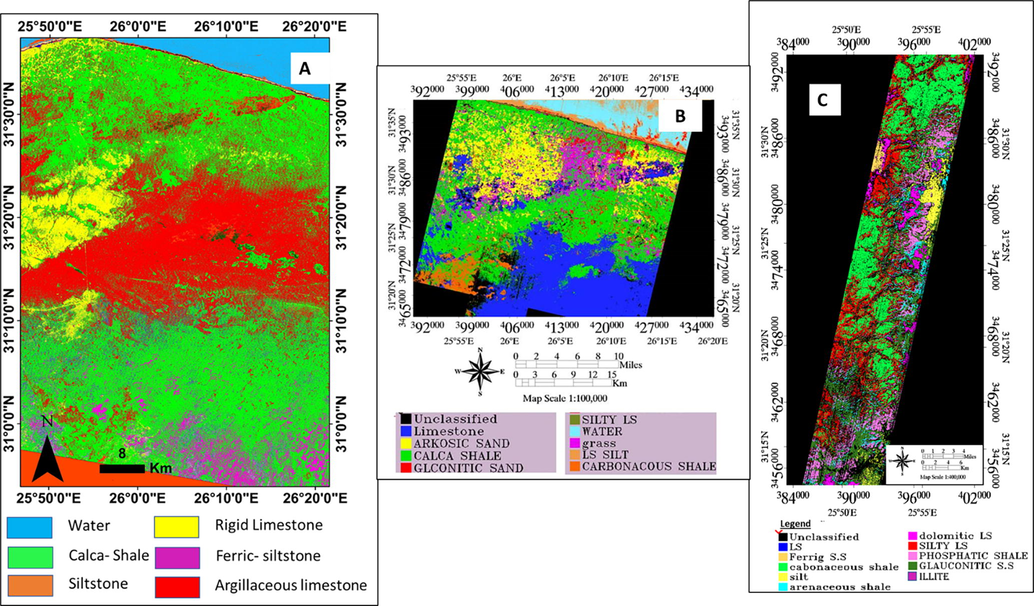
Supervised classification image for study area. A) Landsat ETM+ B) (ALI) image C)EO-1Hyperion.
The classified map of (ALI), (Fig. 5), gives nine different classes with more separation for lithological alteration, separating the general basic units into more detailed classes, where the secondary components that appeared show the alteration as Glauconitic sand and carbonaceous shale, considering evidence of hydrocarbon seepage, than the landsat7 that show the separation on broad categories.
Hyperspectral has greater discrimination capability for mapping minerals, which were split into twelve different classes: limestone, dolomite, carbonaceous shale, illite, Glauconite, and ferrous mineral, which are important in identifying hydrocarbon seepage. Accuracy was determined by comparing the signatures of collecting end-members to the signature of the USGS spectral library. Hyperion EO-1(hyperspectral and Ali) classification are mostly similar with an overall accuracy of over 90 percent and kappa coefficients of 0.85. Because the presence of more SWIR reflectance bands leads to better discrimination and lithologic mapping than ETM+ (Fig. 5).
The area is dissected by various fractures and faults that serve as structural traps for oil accumulation in the area (NNE, NNW, E-W, and ENE) directions formed from rejuvenations of deformed structures overtime to reach the surface with varying stress trends, and hydrocarbon leakage through them is visible (Fig. 6). The integration of the results maps using GIS reveals that high hydrocarbon occurrence with high soil contamination is localized around faults that cut the oil well, with fault numbers (1, 2, and 3) indicating leaky faults (Fig. 7). The HD and HI calculation results from (EO-1) data, including ALI multispectral and hyperspectral data, show a good result for detecting hydrocarbon seeps, allowing us to infer the places of alteration that occur from them (Fig. 8). Hydrocarbon potentiality is created by overlays of multiplying rasters by their assigned weight according to criteria importance and adding them together using Weighted Sum (Spatial Analyst). The number of reclassified that can be utilised is limited to five categories in terms of five potential zones very good, good, intermediate, poor, and very poor probable prospecting zones) (Fig. 8). Unlike Hyperion, which provides reliable data, Landsat7 does not indicate hydrocarbon seepage concentrations. The Landsat classification results show that the lithology around these faults is shale and clay, but the Hyperion results with the hyper bands and 10 nm spectral resolution show that the shale around these faults is carbonaceous with an abundance of illite, ferrous, phosphates, and kaolinite minerals due to hydrocarbon seeps across these faults to the earth's surface, and the wells drilled in the area to the east are oil shows. The HD and HI calculations confirm the hydrocarbon value increased around the rejuvenated leaking faults which seep the oil from the trap, (Fig. 9).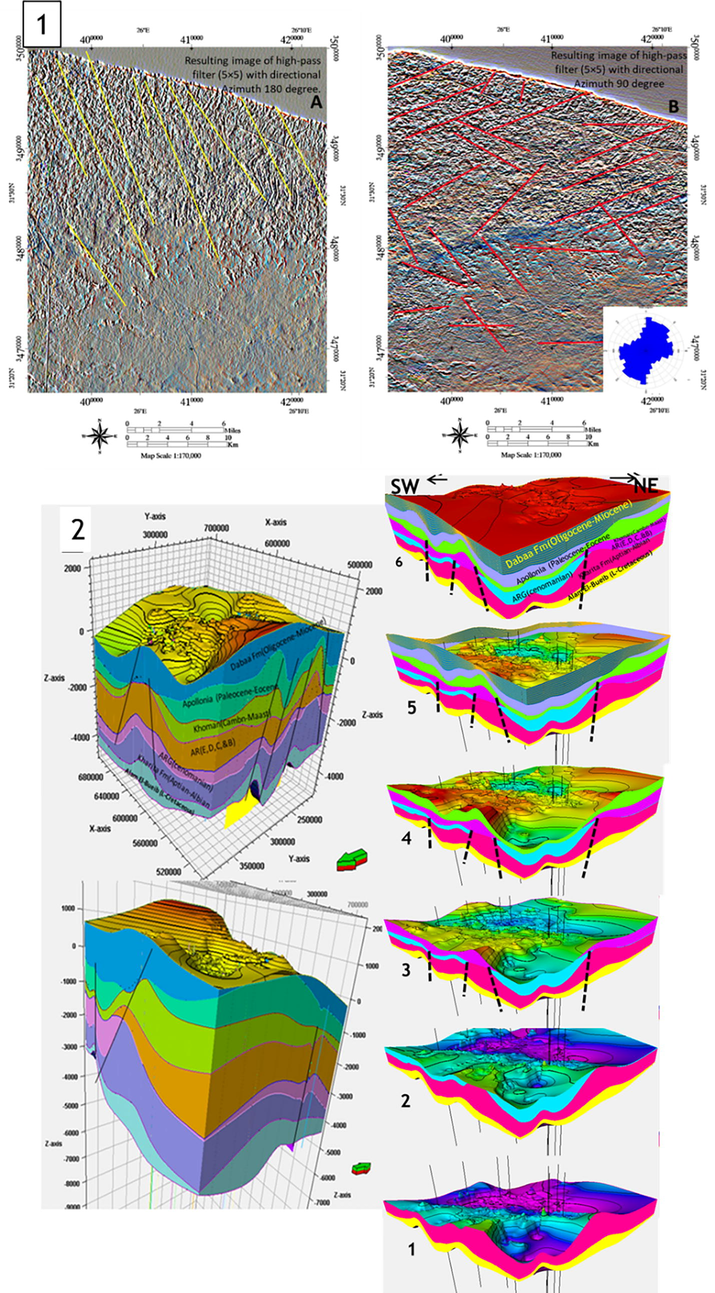
1) Surface faults and lineament from satellite images. The resulting image of a high-pass filter (5 × 5) with directional Azimuth A) 180°, and B) 90°. 2) A)Sub-Surface block model with faults B) sub-surfce TWT map of modeled tops (Modified after El-Hadidy et al., 2016).
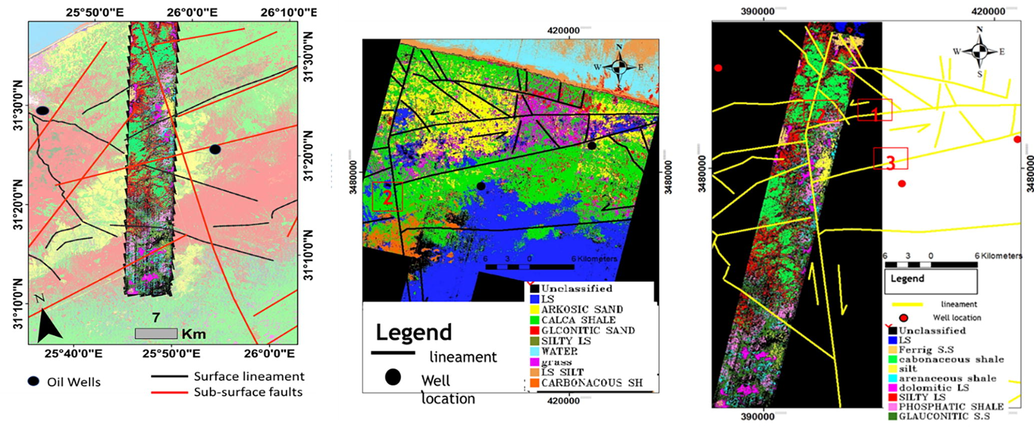
Comparison of the EO-1 Hyperion, and Landsat ETM supervised classification maps with overlaid sub-surface faults from seismic data and identified surface faults from satellite images.
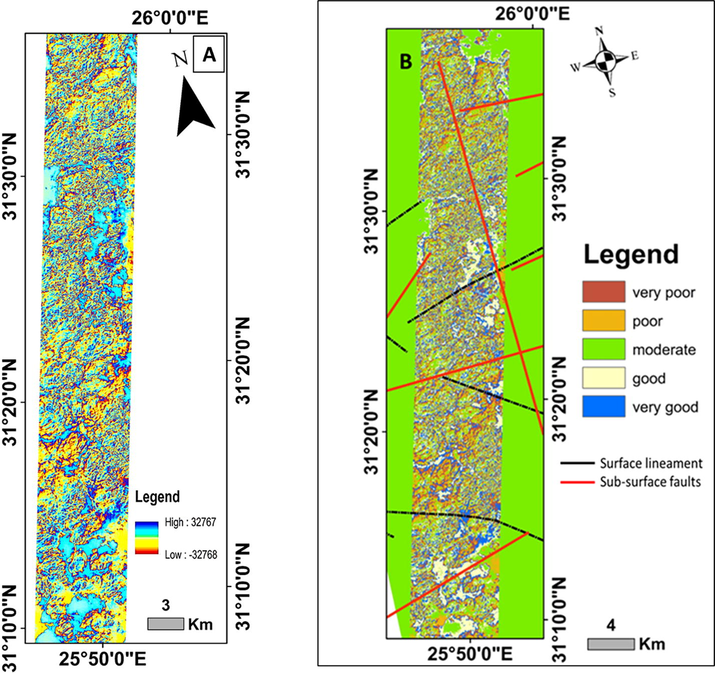
The hyperspectral remote sensing-derived HD and HI ratio indices, B)micro-seepage Hydrocarbon potentialities map result from GIS weighted sum method.
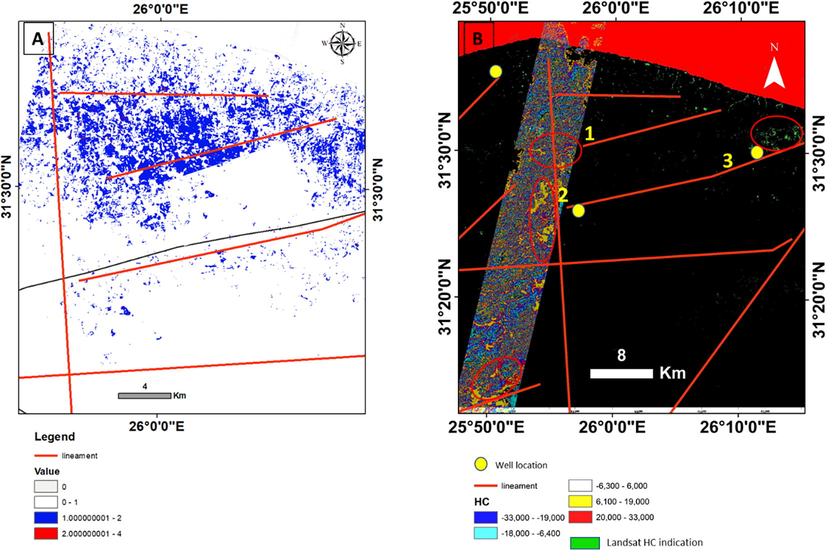
A) The remote sensing-derived hydrocarbon detection result of ALI image. B) hydrocarbon detection of Hyperion EO1-image overlaid on the hydrocarbon ratio result for Landsat image in the background.
From all results, Hyperion images provide accurate results in mapping mineral alteration, and the (HD and HI) equation precisely reveals oil seeps and lithological pollution, followed by multispectral images of EO-1 (ALI), and the least successful is Landsat7. Recommendations of this research possibility of studying oil leakage and its environmental pollution as well as in petroleum exploration operations to detect new exploratory places by Hyperion, consider more efficient in time, money, and effort.
4 Conclusion
The maps produced by various processes and techniques (PCA, supervised classification, different band ratios for mineralogical separation and HI, HD computation of Hyperion EO-1 (hyperspectral and Ali images) and landsat7 ETM+) show good, detailed maps detecting lithological alteration contamination by hydrocarbon seeps and deformed geological structures that cause the hydrocarbon spill.
Landsat ETM 7+ cannot separate rock and its mineral alteration completely or accurately due to the limited number of reflected spectral bands, which causes some conflict, in contrast to hyperspectral of high and narrow spectral resolution and more SWIR bands, which enables complete and accurate separation between different rocks and metallic alteration.
Mineralogical alterations (Glauconite, carbonaceous, abundance of illite, phosphate, iron, and kaolinite) are concentrated near reactivated faults, and wells were drilled in the area to the east with oil showing indicating the faults were leaking.
Calculation results of HD and HI from EO-1 (ALI multispectral and hyperspectral data), show a good result that can detect the hydrocarbon seeps occurrence, It is reasonable to conclude that the higher the index value, the higher the hydrocarbon content. Nonetheless, the assessment of oil abundance is qualitative rather than quantitative.
The hydrocarbon potentiality map is classified as very poor, poor, moderate, good, and very good prospecting zones.
Hydrocarbon micro-seepage in the study area is spatially closed due to reactivated faults causing upward migration from trap to surface, alteration not visible with sealed faults, seepage from faults 1,2, and 3 to surface, which is interpreted as potential oil-contaminated soil with a high hydrocarbon index value.
According to research, high-resolution spectral remote sensing images may be employed in petroleum reconnaissance operations with good results, saving time, money, and effort.
Acknowledgement
The authors extend their appreciation to the Abdullah Alrushaid Chair for Earth Science Remote Sensing Research for funding.
Declaration of Competing Interest
The authors declare that they have no known competing financial interests or personal relationships that could have appeared to influence the work reported in this paper.
References
- Landsat 8: utilizing sensitive response bands concept for image processing and mapping of basalts. Egypt. J. Remote Sens. Space. Sci.. 2020;23(3):263-274.
- [CrossRef] [Google Scholar]
- Integration of remote sensing technique and field data in geologic mapping of an ophiolitic suture zone in western Arabian Shield. J. Afr. Earth Sc.. 2018;146:180-190.
- [CrossRef] [Google Scholar]
- Northwestern desert stratigraphic summary: A conoco’s chart compiled from different official sources. Unpublished internal charts; 1984.
- Hyperspectral analysis of oil and oil-impacted soils for remote sensing purposes. European Commission Joint Research Centre. 2007
- [Google Scholar]
- Spectral remote sensing for onshore seepage characterization: Acritical overview. Earth Sci. Rev.. 2017;168:48-72.
- [Google Scholar]
- Cloutis, E.A., 1989. Spectral reflectance properties of hydrocarbons: remote-sensing implications Science, 165-168, 10.1126/science.245.4914.165, 245.
- The surface expression of hydrocarbon seeps characterized by satellite image spectral analysis and rock magnetic data (Falcon basin, western Venezuela) J. S. Am. Earth Sci.. 2021;106
- [Google Scholar]
- Monitoring shoreline changes and aeolian sand encroachment, Nasser Lake, Egypt, using remote sensing and GIS techniques. Arabian J. Geosci.. 2020;13:1285.
- [Google Scholar]
- The relationship between urban heat islands and geological hazards in Mokattam plateau, Cairo, Egypt. Egypt. J. Remote Sensing Space Sci. V. 24, 3. Part. 2021;24(3):547-557.
- [Google Scholar]
- Detecting Onshore Oil Seeps with Hyperspectral Imagery. In: Airborne Remote Sensing Conference Proceedings. 2002.
- [Google Scholar]
- Farag K. S. I., Howari F. M., Abdelmalik K. W., (2019). Imaging of Hydrothermal Altered Zones in Wadi Al-Bana, in Southern Yemen, Using Very Low Frequency–Electromagnetic and Remote Sensing Data. Arabian Journal of Geosciences. 2019, 12(18), 554. https://doi.org/10.1007/s12517-019-4702-8.
- Remote sensing-guided stratigraphic dissection of an Ediacaran terrestrial molasse basin (Kareim basin, Egypt), with implications for sedimentary evolution. Precambr. Res.. 2020;338:105589
- [CrossRef] [Google Scholar]
- Detection of hydrocarbon microseepage–induced anomalies by spectral enhancements of Landsat 7 ETM+ images in part of Assam-Arakan Fold Belt, India. J. Petrol. Expl. Prod. Technol.. 2019;9:2573-2582.
- [Google Scholar]
- Hydrocarbon micro-seepage detection from airborne hyper-spectral images by plant stress spectra based on the PROSPECT model. Int. J. Appl. Earth Obs. Geoinformation. 2019;74:180-190.
- [Google Scholar]
- Comparison of airborne hyperspectral data and EO-1 Hyperion for mineral mapping. IEEE Trans. Geosci. Remote Sens.. 2003;41:1388-1400. 6 PART I
- [Google Scholar]
- Hydrocarbon Index–an algorithm for hyperspectral detection of hydrocarbons. Int. J. Remote Sens.. 2004;25:2467-2473.
- [Google Scholar]
- NASA, “Remote Sensing Tutorial”. Principal Author: Nicholas M. Short, NASA Official: J. Bolton, (2006). Website Curator: Laura Rocchio, site last update May 19.
- Reflectance spectroscopy and ASTER imagery applied to unravel mineral assemblage as surface indicators of hydrocarbon micro-seepage in the region of Khuzestan oilfields, Iran. Egypt. J. Remote Sensing Space Sci. 2020;24:361-372.
- [Google Scholar]
- Research Systems Inc (RSI, ENVI User’s Guide). (2005). P.948.
- Remote Sensing: Principles and Interpretation (3rd ed.). N.Y.: W. H. Freeman and Co.; 1997. p. :494.
- Natural geological seepage of hydrocarbon gas in the Appalachian Basin and Midwest USA in relation to shale tectonic fracturing and past industrial hydrocarbon production. Sci. Total Environ.. 2018;644:982-993.
- [Google Scholar]
- Hydrocarbon-induced alteration of soils and sediments. In: Article in AAPG Memoir. 1996.
- [Google Scholar]
- An introductory note on the geology of the northern portion of the Western Desert of Egypt. BullInst Desert. 1955;5(2):96-106.
- [Google Scholar]
- Shu-Fang, T., Jian-Ping, C., et al., 2008. The Information of Oil and Gas Micro-seepage in Dongsheng Region on Inner Mongolia Extration Based on the Airborne Hyperspectral Remote Sensing Image. Remote Sensing of the Environment: 16th National Symposium on Remote Sensing of China 7123 (1230K-1): 8.
- Tian, Q., 2012. Study on Oil-Gas Reservoir Detecting Methods using Hyperspectral Remote Sensing. International Archives of the Photogrammetry, Remote Sensing and Spatial Information Sciences XXXIX-B7.
- The fate of hydrocarbon leaks from plugged and abandoned wells by means of natural seepages. J. Petrol. Sci. Eng.. 2021;196:108004.
- [Google Scholar]


