

Translate this page into:
Design, statistical optimization, and characterization of Esculin-loaded transliposome nanogel for topical delivery: In-vitro, ex vivo study and dermatokinetic evaluation
-
Received: ,
Accepted: ,
This article was originally published by Elsevier and was migrated to Scientific Scholar after the change of Publisher.
Abstract
The purpose of this study was to prepare and optimise an Esculin-loaded transliposome (ECL-TL) for the dermal administration of ECL for skin cancer treatment. The ECL-TL formulation effectively produced closed lamellar vesicles with in-vitro drug release of 81.28 ± 2.82 % and ex-vivo penetration studies showed that had a 2.2-part intensified permeability compared to the conventional preparation. The CLSM data of skin visibly displayed intense permeation of ECL-TL formulated with rhodamine B, equating to the rhodamine B hydroalcoholic solution. The dermatokinetic study suggested that TLs enhance the permeability of the delivery system when topically applied. According to the data, the developed ECL-TL could be an effective drug nano-carrier for the dermal delivery of ECL in treating skin cancer.
Keywords
Esculin
Transliposomes
Gel
Dermal
Dermatokinetic

1 Introduction
Skin cancer originates from the abnormal growth of cells. This abnormal cell growth primarily results from unrepaired DNA damage in skin cells, which leads to the development of mutations. The delivery systems like, ethosomes, liposomes, niosomes, and nano emulsions are examples of nano-carriers that contain drugs. Through the resolution of several problems, such as drug solubility and instability, dermal delivery reduces drug toxicity and enhances medication efficacy (Verma et al., 2013).
Esculin (ECL) is a herbal drug and one of the Cortex Fraxini's main active ingredients, can serve as a promising medication to prevent inflammatory conditions in humans (Niu et al., 2015). The structure of ECL showed in the Fig. 1. This suggests that ECL can potentially treat several inflammatory and oxidative damage-related disorders. The anti-diabetic action of ECL is intimately associated with the amelioration of pancreatic damage, promotion of insulin production and improvement of glucose homeostasis (Li et al., 2022; Kaneko et al., 2003). Furthermore, in 2007, Zhao et al. demonstrated that ECL efficiently inhibited dopamine-induced caspase-3 cleavage, preventing cell death, using the dopamine-induced cytotoxicity model in human neuroblastoma SH-SY5Y cells. Furthermore, this study demonstrated ECL's capability to counteract the over-production of reactive oxygen species, prevent morphological changes in cell nuclei and protect antioxidant enzymes from damage (Zhao et al., 2007). In rat livers, ECL has been shown to scavenge hydroxyl radicals and prevent lipid (LP) peroxidation (Kaneko et al., 2003). ECL exhibits anti-inflammatory properties in mouse models, specifically in zymosan and carrageenan-induced paw oedema cases (Stefanova et al., 1995).
Chemical structure of Esculin.
According to Brar et al., 2018, Nanoparticles containing esculin were developed using a method called ionic gelation with a combination of chitosan and okra gum. When administered, these nanoparticles showed approximately twice the brain targeting capability compared to esculin administered as a plain solution.
The field of transdermal delivery has witnessed a revolutionary breakthrough with the advent of transliposomes. Their robust structure ensures sustained release profiles, enhancing both drug efficacy and patient convenience. The ability to maintain therapeutic levels over extended periods contributes significantly to improved patient adherence and treatment outcomes.
The study aimed to develop a nanogel formulation for treating skin cancer due to the challenges associated with the short half-life, limited therapeutic range, and poor water solubility and absorption of esculin. The formulation optimization process used the Box-Behnken design (BBD) (Jawad, Ali H., et al 2022, Jawad, Ali H., et al 2022).
2 Material and method
2.1 Materials
ECL, cholesterol (CLT) and triethanolamine were sourced from “Sigma-Aldrich” whereas Lipoid GmbH provided Lipoid S100. “Sodium cholate (SC) was obtained from Thomas Baker in the United States” and “Carbopol 940 and PEG 400 were acquired from Merck”. Additionally, various other compounds were obtained from “Merck in the United States”.
2.2 Formulation of ECL-TL
For the preparation of ECL-TL formulation, specific quantities of LP, CLT, SC and ECL (1 mg/mL) were mixed in a chloroform and ethanol in a ratio of 2:1 v/v in a flask. This mixture was exposed to diluent evaporation using the rotary evaporator for 4 h. Subsequently, the dehydrated thin film of the LP layer was rehydrated by spinning at 120 revolutions per minute in a pH 7.4 solution for an hour at room temperature. The obtained dispersions were subjected to a 3 min sonication process using a probe sonicator.
2.3 ECL-TL formulation optimisation utilising BBD software
The ECL-TL formulation was optimized with the use of BBD software. According to the QbD software, 17 ECL-TL preparations were obtained and analysed. LP (X1), CLT (X2) and SC (X3) were chosen as independent variables, however, the dependent variables that selected were “droplet size (Y1), entrapment efficiency (Y2), and in-vitro release (Y3) (Table 1A)”. mg = Milligram, nm = Nanometer, % = Percentage.
Variables
Used Levels
Low
(-1)
Medium
(0)
High
(+1)
Independent variables
X1 = Lipoid S100 (mg)
80
100
120
X2 = Cholesterol (mg)
10
15
20
X3 = Sodium cholate (mg)
5
10
15
Dependent variables
Y1 = Vesicles size (nm)
Y2 = Entrapment efficient (%)
Y3 = In vitro release (%)
2.4 TL droplet size and polydispersity index (PDI)
ECL-TL's droplet dimension and PDI were measured using an instrument Zetasizer “(Malvern Zetasizer, Nano ZS, UK)” at 25 °C ± 1 °C. The formulations used in this study were diluted appropriately with saline solution (pH 7.4), and the studies were conducted in triplicate.
2.5 Encapsulated content efficiency
The %EE of the TLs preparation was determined using ultracentrifugation. The free ECL was isolated by centrifugation of 2 ml of ECL-TL at 25000 rpm for 1 h at 4 °C. The amount of ECL was determined by UV/Vis spectroscopy at 338 nm using buffer solution (pH 7.4) after the recovered supernatant was diluted and filtered (Rehman et al., 2015).
2.6 Assessment of in-vitro parameters
The final selected proportion of ECL-TLs was introduced into a dialysis pouch, which was subsequently immersed in 50 ml of phosphate buffer (pH 7.4), all at room temperature. At interval of 0.25, 0.5, 1, 2, 4, 6, 12 and 24 h, One milliliter of the solution was extracted and substituted with an equivalent amount of dissolving medium. A UV spectrophotometer “(UV-1601, Shimadzu, Japan)” was utilized to quantify the content of ECL at 338 nm. (Halayqa & Domańska, 2014; Rehman et al., 2015). The in-vitro parameters were assessed using a variety of models (Ahad et al., 2016).
2.7 Morphology of ECL-TL
TEM “(CM 200, Philips Briarcliff Manor, NY, USA)” was used to conduct the morphological study of the ECL-TL preparation. The diluted sample was taken on a copper-grid as a tiny droplet, allowed to dry, and then stained using a 1 % weight-based PPTA (phosphotungstic acid) solution (Ahad et al., 2018a; Ahad et al., 2018b; Siddiqui et al., 2022).
2.8 Antioxidant properties
Briefly, 0.5 ml of ECL-TL was dissolved with 0.3 ml of the ethanolic DPPH solution and 3 ml of ethanol. This mixture was let to rest for one hundred minutes in a dark atmosphere. At 517 nm, a spectroscopic analysis was performed to check the colour shift. 0.3 ml of the DPPH solution and 3.5 ml of 70 % ethanol made up the control solution. The following equation was used to determine the sample's antioxidant activity (Gupta et al., 2020):
2.9 Preparation of ECL-TL gel
The carbopol 934 (1 % w/w) gel was prepared by dispersing in HPLC grade water to ensure an even dispersion. The mixture was left until night to allow carbopol 934 to fully swell. After treating the mixture with 0.1 % chlorocresol and 15 % w/w PEG 400, triethanolamine was added to adjust the pH. Finally, to create a homogeneous gel formulation, the tailored ECL-TL was added dropwise to the prepared gel while continuously mixing (Ahad et al., 2014; Zakir et al., 2020).
2.10 Determination of gel pH and texture
The composition of the ECL-TL gel was measured for pH using a pH meter. A texture analyzer was then employed to evaluate the gel composition's consistency. One hundred milliliter glass beaker containing fifty grams of ECL-TL carbopol-gel was gently filled with the gel, making sure there were no air bubbles and the surface was smooth. The obtained texture data was examined in order to determine its hardness, consistency, cohesion, and viscosity index (Gupta et al., 2020).
2.11 Extrudability
About 20 g of gel were packed tightly into a collapsible tube, which had a clamp attached to prevent retraction. After removing the cap, the gel was squeezed out. The quantity of gel that was squeezed out was gathered and weighed in order to determine the amount that was effectively dispensed.
2.12 Spreadability
During the experiment, two batches of standard-sized glass slides were readied. The improved topical gel formulations was placed on one of the slides. The second slide was then positioned atop the gel, effectively sandwiching the gel layer between the two slides, covering a length of 7.5 cm. To establish a thin, uniform layer between the slides, accurately weighed (100 g) of gel was put to the upper slide and spread evenly. The extra gel was carefully removed, and both slides were firmly mounted on a stand to cause the least amount of disruption possible. Carefully, a 20 g weight was placed to the upper slide. The time required for the upper slide to travel 7.5 cm before disengaging from the bottom slide as a result of the weight increase was carefully recorded.
2.13 Stability study of ECL-TL gel
The main goal of stability testing was to assess the changes in the quality of a drug as time passed, particularly concerning variations in temperature and relative humidity. In the case of the topical gel preparation, a comprehensive stability investigation was conducted over six months, adhering to the recommendations outlined by the ICH. ECL-TLs were subjected to different conditions, including a humidity room at 30 °C/75 % RH and 40 °C/75 % RH. Samples were taken in the 1, 2, 3, and 6 months of the study, and they were examined for changes in pH, homogeneity, color, odor, and viscosity.
2.14 Skin permeation analysis
The membrane in this investigation was produced from excised rat skin, and 1 g of ECL-TL gel was put non-occlusively at the upper (donor) compartment. Phosphate buffer (pH 7.4) was added to the lower (receiver) and continuously shaken at 600 rpm and 37 ± 1 °C during the experiment (Mura et al., 2009). At various time intervals (0.25, 0.5, 1, 2, 4, 6 and 12 h), 1 ml sample was withdrawn from the lower compartment through the sampling point and substituted with 1 ml of a fresh solution at each time point. The ECL content was quantified at wavelength 338 nm using UV spectroscopy using buffer solution (pH 7.4) as a medium (Chen et al., 2013; Gupta et al., 2020).
2.15 Assessment of deepness permeation
The confocal laser scanning microscopy (CLSM) was used to assess the formulations' penetration depth. Rat skin was excised and mounted on two separate FDC, served as the substrate for this analysis. After evenly applying ECL-TL gel and a hydroalcoholic solution containing rhodamine B to the skin and the gels were incubated for 8 h at 37 °C. After study, HPLC grade water was used to rinsed to remove any remaining gel from the skin treated with the hydroalcoholic solution and ECL-TL gel containing rhodamine B. After rinsing, the skin was meticulously sectioned into smaller parts and transferred to a microscope slide, ensuring that the stratum corneum side was facing upward. These prepared samples were then examined using CLSM (Moolakkadath et al., 2018).
2.16 Dermatokinetic study
Consistent with the in-vitro skin permeation experiment, the drug concentration within various layers of rat skin was examined by applying the ECL-TL gel to the skin layer that is housed inside the FDC device. However, in this particular experiment, the whole section of skin was detached from the apparatus at different time intervals (Kumar et al., 2023). After cleaning the skin with a saline solution (pH 7.4), it was placed in hot water and left there for two to four minutes to remove any remaining formulation from the skin. Subsequently, both layers (epidermis and dermis) were meticulously detached using forceps. These detached layers were finely sliced into small parts and placed in a methanol solution (5 ml) for 24 h to facilitate the extraction of ECL. Subsequently, the resultant methanolic solution was filtered and ECL concentration was quantified using HPLC (Chen et al., 2013).
3 Results
3.1 Optimisation of ECL-TL by BBD
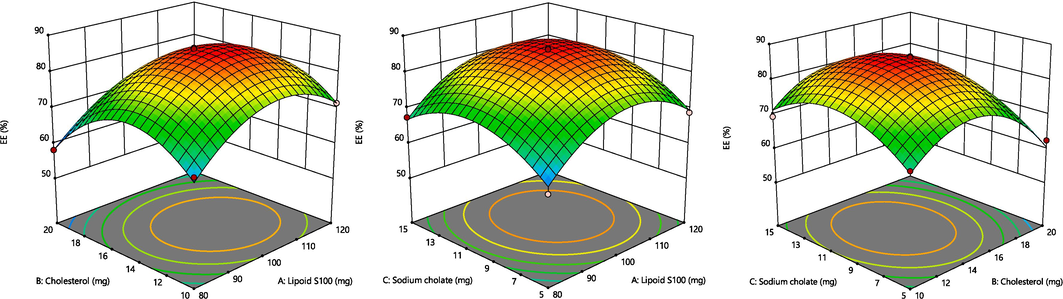
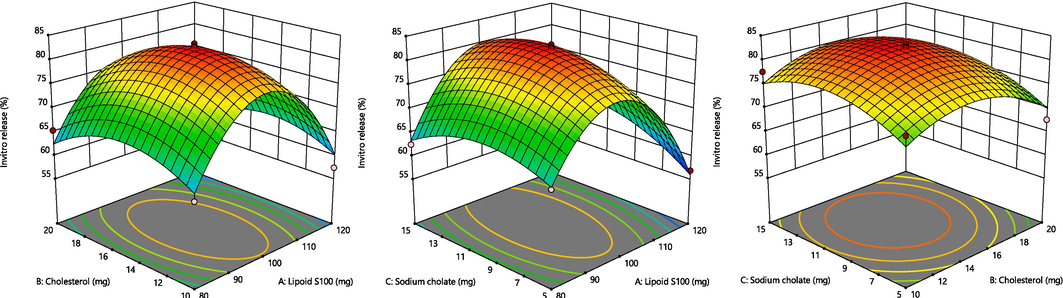
The BBD program generated 17 experimental runs, including three-centre-point preparations. Among these runs, the quadratic polynomial technique was identified as the utmost suitable technique that effectively represented the outcomes. The R2 (coefficient of determination), standard deviation (SD) and coefficient of variation (%CV) values of these three responses have been presented in Table 1B. The influence of these chosen parameters has been visually signified in the 3D graph displayed in Fig. 2. Additionally, Fig. 3 presents a measurable assessment through the investigational values of the responses and the expected standards. X1 = Lipoid S100 (mg), X2 = Cholesterol (mg), X3 = Sodium cholate (mg), Y1 = Vesicles size (nm), Y2 = Entrapment efficient (%) and Y3 = In vitro release (%).
Formulations
Independent variables
Dependent variables
X1
X2
X3
Y1
Y2
Y3
1
120
10
10
185.2 ± 3.2
71.47 ± 1.13
57.35 ± 4.55
2
100
15
10
155.5 ± 2.2
85.28 ± 1.35
83.29 ± 2.44
3
100
15
10
155.8 ± 2.8
86.55 ± 2.31
82.81 ± 2.64
4
100
15
10
156.2 ± 3.0
85.95 ± 1.44
81.28 ± 2.52
5
100
20
15
179.2 ± 1.3
63.67 ± 1.24
72.38 ± 3.55
6
100
15
10
156.2 ± 3.2
85.86 ± 1.55
82.55 ± 2.62
7
80
15
15
168.4 ± 3.8
67.48 ± 0.93
62.47 ± 2.44
8
80
20
10
176.8 ± 2.9
58.18 ± 1.43
65.37 ± 3.15
9
100
10
15
171.2 ± 2.6
69.45 ± 1.45
77.59 ± 2.45
10
120
15
15
192.3 ± 3.8
75.14 ± 2.51
65.07 ± 2.66
11
80
15
5
171.5 ± 3.1
61.43 ± 0.33
64.67 ± 1.96
12
100
10
5
178.2 ± 2.8
68.51 ± 1.43
74.52 ± 1.55
13
120
15
5
198.7 ± 3.1
68.84 ± 1.53
56.82 ± 2.76
14
80
10
10
165.2 ± 1.2
65.78 ± 0.59
62.29 ± 2.35
15
100
20
5
188.5 ± 3.0
62.53 ± 0.84
67.61 ± 1.56
16
120
20
10
204.5 ± 2.1
62.27 ± 1.52
59.75 ± 2.86
17
100
15
10
156.4 ± 2.2
86.28 ± 1.52
82.59 ± 2.52
Quadratic model
R2
Adjusted R2
Predicted R2
SD
%CV
Response (Y1)
0.9931
0.9842
0.8916
1.99
1.14
Response (Y2)
0.9873
0.9709
0.8046
1.72
2.39
Response (Y3)
0.9701
0.9316
0.8164
2.53
3.59
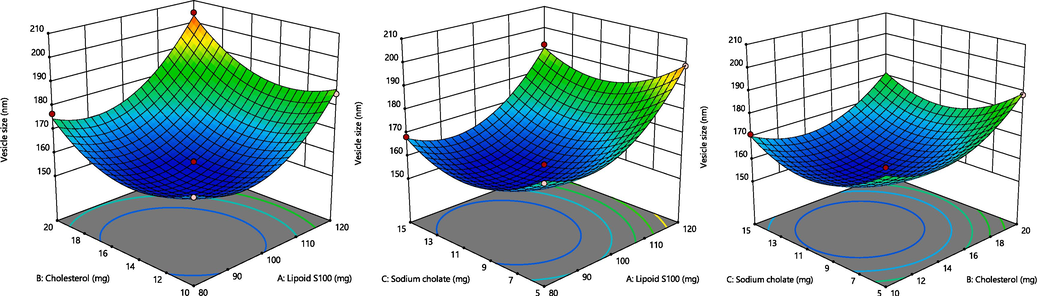
A. Representation of 3D surface plot on the effect of independent variables on vesicle size. Fig. 2B. Representation of 3D surface plot on the effect of independent variables on entrapment efficiency. Fig. 2C. Representation of 3D surface plot on the effect of independent variables on in vitro release characteristics.
A. Representation of 3D surface plot on the effect of independent variables on vesicle size. Fig. 2B. Representation of 3D surface plot on the effect of independent variables on entrapment efficiency. Fig. 2C. Representation of 3D surface plot on the effect of independent variables on in vitro release characteristics.
A. Representation of 3D surface plot on the effect of independent variables on vesicle size. Fig. 2B. Representation of 3D surface plot on the effect of independent variables on entrapment efficiency. Fig. 2C. Representation of 3D surface plot on the effect of independent variables on in vitro release characteristics.
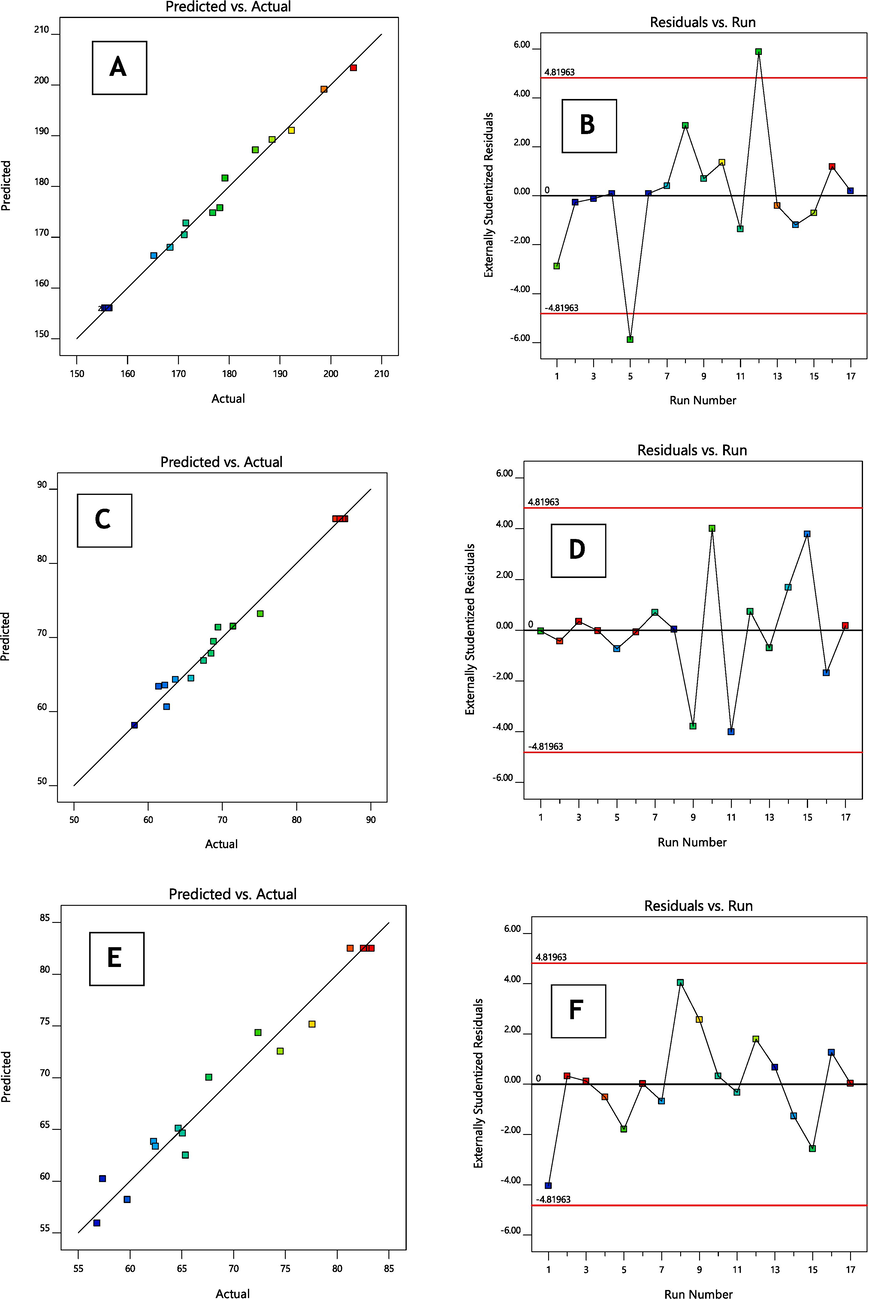
(A–F): The linear correlation plots (A, C, E) between actual predicted vs actual values and corresponding residual plots (B, D, F) for responses vesicle size and entrapment efficiency and in vitro release of optimised formulation.
3.2 Response (Y1): Variable influence on the droplet size
The mean vesicle size throughout all 17 tests was 168.56 nm (ranging from 155.5 to 204.5 nm) (as shown in Table 1B).
Vesicle size = +156.02 + 12.35 X1 + 6.15 X2 – 3.22 X3 + 1.92 X1X2 – 0.8250 X1X3 – 0.5750 X2X3 + 15.18 X12 + 11.73 X22 + 11.53 X32
The concentration of surfactant had a significant effect on the size of the droplet (p < 0.0001), followed by the concentration of the lipid (p < 0.0002). The equation mentioned above demonstrates that the two independent responses, LP and CLT, benefit droplet dimensions. Thus, upsurges in the amount of LP and CLT led to a rise in the vesicle size (Mohammed et al., 2013). Accordingly, the SC amount is essential for droplet production, as an increase in the SC amount from 5 to 15 mg decreased the dimension of ECL-TL droplets.
3.3 Response (Y2): Variable influence on the %EE
The %EE across all 17 tests was 80.14 % (ranging from 58.18 to 86.55 %), as indicated in Table 1B.
Entrapment efficiency = +85.98 + 3.11 X1 – 3.57 X2 + 1.80 X3 – 0.4000X1X2 + 0.0625 X1X3 + 0.0500 X2X3 – 9.69 X12 – 11.87 X22 – 8.07 X32
LP and SC played important roles in influencing the EE. The concentration of surfactant had a significant effect on the size of the droplet (p < 0.0001), followed by the concentration of the lipid (p < 0.0001). As per the equation above, a positive relationship existed between the quantities of LP and SC and the EE of ECL in TL droplets. Similarly, increasing the LP quantities from 80 to 120 mg improved the EE. This enhancement is primarily attributed to the development of a greater number of TL vesicles, which resulted in larger vesicular domains that provided more space for drug entrapment (Zakir et al., 2020).
CLT was added to the ECL-TLs to enhance vesicle stability by preventing leakage (Ahad et al., 2018a; Ahad et al., 2018b). However, according to the equation mentioned above, CLT had an adverse effect on entrapment efficiency. This observation aligns with previous findings (Gilani et al., 2019). The bilayer structure of vesicular membranes can be damaged by high CLT levels, which could due to drug loss (Mohammed et al., 2013).
3.4 Response (Y3): Variable influence on the in-vitro parameter
The in-vitro parameter ranged from 56.82 to 83.29 % across all 17 formulations, averaging 76.41 % (as shown in Table 1B).
In-vitro drug release = +82.50 – 1.98 X1 – 0.8300 X2 + 1.74 X3 – 0.1700 X1X2 + 2.61 X1X3 + 0.4250 X2X3 – 16.04 X12 – 5.27 X22 – 4.21 X32
According to the equation above, SC positively influenced in-vitro release. In contrast, LPs and CLT had a detrimental impact on in-vitro parameters. The concentration of surfactant had a significant effect on the size of the droplet (p < 0.001), followed by the concentration of the lipid (p < 0.0003).
ECL-TL containing LP (100 mg), CLT (15 mg) and SC (10 mg) satisfied the formulation requirement. The improved ECL-TL preparation demonstrated a droplet dimension of 155.5 ± 2.42 nm (Fig. 4A), and the zeta potential (Fig. 4C) value of the optimised formulation was found to be −27.95 mV, entrapment efficiency was determined to be 85.95 ± 2.75 %, and an in vitro release was ascertained to be 81.28 ± 2.82 %. The results provided by the Design-Expert program in terms of droplet size (156.02 nm), %EE (85.98 %) and in vitro release (82.50 %) were close to the projected values. Furthermore, the improved formulation had a PDI value of 0.271.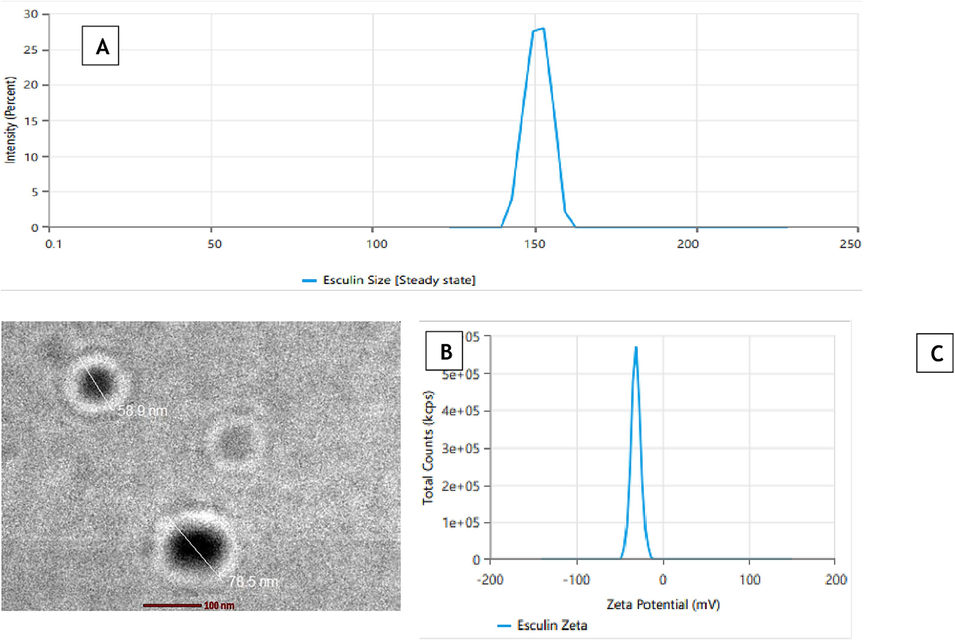
(A) Average vesicle size using zetasizer, (B) Transmission electron micrograph, (C) Zeta Potential of optimised formulation.
3.5 Morphology of ECL-TL
The prepared droplets had a well-defined, spherical, and uniformly sized structure, according to the TEM image of the improved ECL-TL preparation (Fig. 4B). The vesicle size, as assessed by the Zetasizer device using the DLS technique, exhibited a similar size distribution to that shown in Fig. 4A.
3.6 In-vitro parameters
The results revealed that optimised ECL-CF exhibited a lower percentage of drug release (42.43 ± 1.42 %) compared to optimised ECL-TL (88.24 ± 1.82 %), as depicted in Fig. 5A. It demonstrated controlled drug release over a 24-hour period, which closely resembled the release pattern reported in the scientific literature for ECL delivered through liposomes (Elsewedy et al., 2021; Li & Wang, 2017). In contrast, the release pattern of ECL from ECL-CF in an aqueous condition was significantly lower than the confines of the experimental model (42.43 ± 1.42 %). The parameter with the maximum correlation coefficient (R2) was favoured for determining the release mechanism. The Higuchi model exhibited the highest correlation coefficient (R2 = 0.8592), followed by the first-order model (R2 = 0.7862) and the zero-order model (R2 = 0.6628). The results were found to be statistically significant (p > 0.001). Furthermore, the release behaviour of ECL from the optimised ECL-TL was evaluated using the Korsmeyer-Peppas model, resulting in an R2 value of 0.9329 and an n value of 0.25. These release of ECL from the optimised ECL-TL follows Fickian-diffusion (Khan et al., 2023).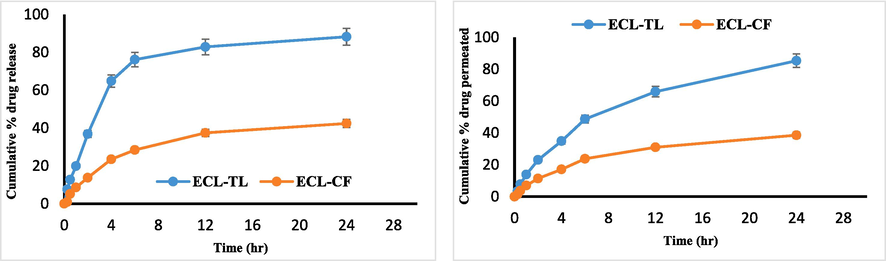
(A) In vitro drug release graphs showing cumulative % drug release from ECL- TL and ECL-CF at pH 7.4. (B) Ex vivo graphs show cumulative amount of ECL permeated through rat skin using ECL-TL gel and ECL-CF gel.
3.7 Antioxidant parameters
Researchers have already shown that ECL has antioxidant properties by successfully preventing LP peroxidation and reducing the generation of free radicals (Saraswati et al., 2013). This study compared the enhanced ECL-TL preparation's antioxidant efficacy to that of an ascorbic acid solution. The ascorbic acid solution exhibited an antioxidant impact of 91.14 ± 2.43 %, whereas the optimised ECL-TL preparation displayed an antioxidant effect of 74.2 ± 2.72 %. The results were found to be statistically significant (p > 0.001). Furthermore, it was found that the sustained antioxidant effectiveness of ECL simultaneously boosted cellular catalase levels, superoxide dismutase action and glutathione peroxidase, contributing to the inhibition of tumour development (Saraswati et al., 2013).
3.8 Extrudability, spreadability, texture and pH of the ECL-TL gel
The gel formulations with good extrudability and spreadability were outperformed by a gel made with carbopol 934 as the gelling agent. It is important to consider the pH of the ECL-TL before applying it topically, particularly if the goal is to treat cancer. However, malignant areas can be identified by their slightly acidic pH (Carvalho et al., 2018). Consequently, the ECL-TL gel preparation's measured pH of 6.2 ± 0.4 meant that it could be applied topically to treat skin cancer. As determined by texture analysis, the ECL-TL gel has a firmness of 101.51 g, a consistency of 650.98 g s, a cohesiveness of −71.05 g and a viscosity index of −298.31 g s. Based on the findings, it can be said that the ECL-TL gel preparation has a consistent appearance and texture because there are no lumps in the formulation and it has a smooth consistency (Moolakkadath et al., 2019).
3.9 Stability testing
The F2 formulation (made with Carbopol 934) underwent stability studies in accordance with ICH regulations because it had superior quality features and was meant to guarantee the drug's quality, safety, and efficacy throughout its shelf life. The topical gel's colour, odour, homogeneity, pH and viscosity did not change after stability testing at 0, 1, 2, 3 and 6 months (Table 2).
Parameter
30 °C ± 2 °C/75 % ± RH 5 % RH
(Months)
40 °C ± 2 °C/75 % RH ± 5 % RH
(Months)
0
1
2
3
6
0
1
2
3
6
Colour
Clear
Clear
Clear
Clear
Clear
Clear
Clear
Clear
Clear
Clear
Homogeneity
Good
Good
Good
Good
Good
Good
Good
Good
Good
Good
pH
6.2
6.2
6.4
6.3
6.1
6.2
6.1
6.1
6.0
6.2
Viscosity
Good
Good
Good
Good
Good
Good
Good
Good
Good
Good
3.10 Skin permeation study
In the 24-hour timeframe, the cumulative ECL permeation from the ECL-CF was only 38.57 ± 2.32 %, whereas it increased to 85.32 ± 3.35 % from the optimised ECL-TL gel (Fig. 5B). The results were found to be statistically significant (p > 0.001). The increase in skin penetration can be ascribed to the compression of TL via the stratum corneum. In order to enable this kind of penetration, edge activators are essential. The variation in force among the two sides of the skin is susceptible to this type of permeation due to the formation of hydrotaxis. The flexibility of the vesicle shape allows for reversible modifications in the membrane's fluidity, facilitating the movement of vesicles through openings (Bisht et al., 2017).
3.11 Skin permeation using CLSM
CLSM analysis revealed that the hydroalcoholic mixture of rhodamine B primarily remained in the upper parts of the skin at a depth of 15 µm (Fig. 6A). The inclusion of rhodamine B in the ECL-TL gel resulted in significant absorption and deeper penetration, reaching a depth of 25 µm (Fig. 6B). The extremely high fluorescence intensity seen in the skin's central region suggests that the gel formulation avoided the outer layers and instead went deeper into the lower epidermis. In summary, the formulated ECL-TL gel effectively delivered rhodamine B dye into the inner parts of the skin. This phenomenon could be explained by flaws in the way animal skin packs its LP in the subcutaneous area, which the ECL-TL can take advantage of when it penetrates the skin (Bisht et al., 2017). When applied topically, this designed vesicular LP particle can transdermally transport the encapsulated medication to the subcutaneous region.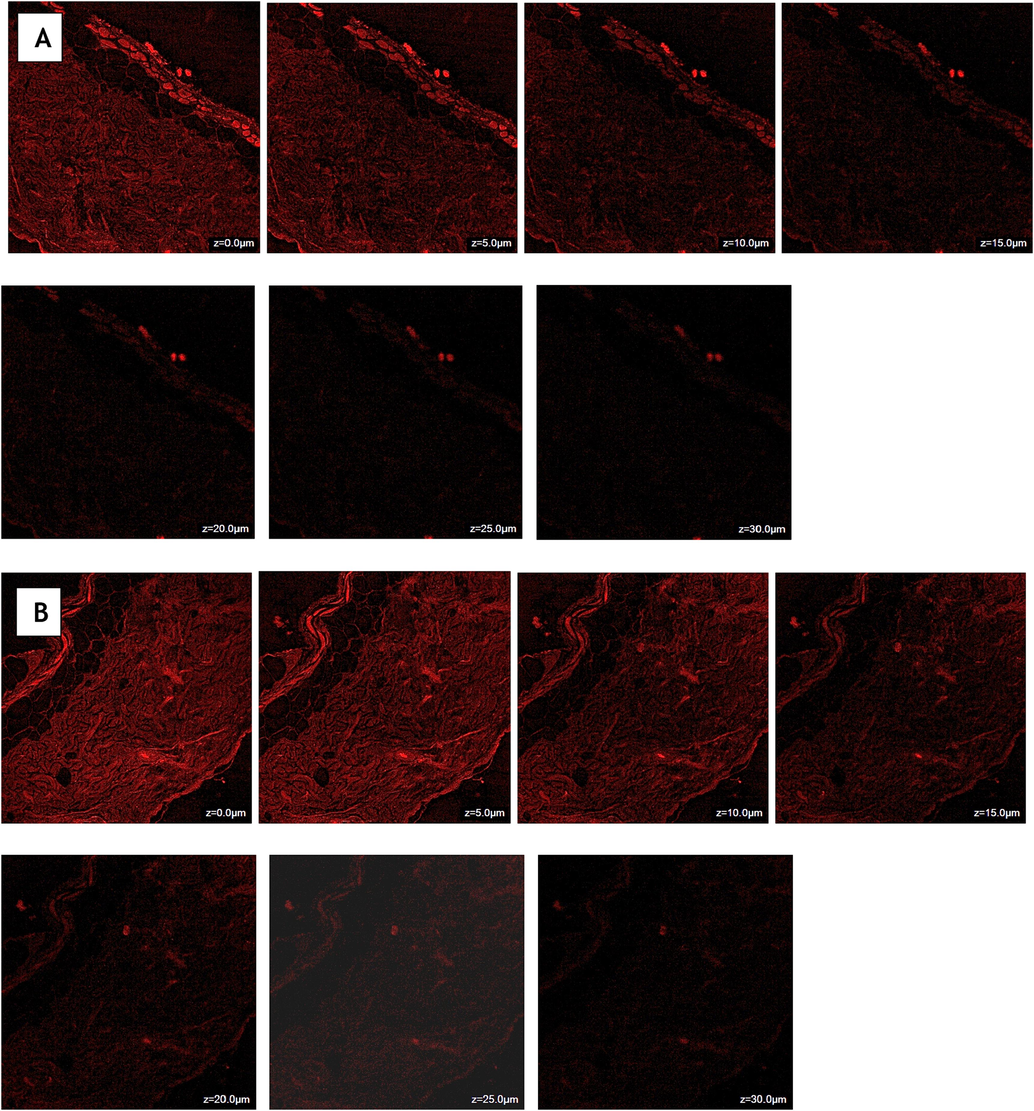
Confocal laser scanning microscopy of Rhodamine B solution (A) and Rhodamine B loaded transliposomes (B) showing a depth of penetration 15 µm and 25 µm across rat skin.
3.12 Dermatokinetic study
Fig. 7 illustrates the relative concentration of ECL in the dermis and epidermis parts of the skin through the application of ECL-CF and ECL-TL gel preparations at different time intermediates, whereas Table 3 provides the statistical analysis using one-factor ANOVA (Zain et al., 2023, Suhaimi et al., 2022, Jawad, Ali H., et al. 2022). A difference in the epidermis and dermis of the skin upon administration of ECL-TL and ECL-CF gel preparations demonstrated that the ECL-TL gel resulted in a substantially maximum ECL amount, as assessed by CSkinmax and AUC0–8h (Table 3). The enhanced retention of ECL-TL gel may be attributed to the droplet's ability to split across the skin LP bilayer. In the epidermis, the TSkinmax of the ECL-TL gel was similar to that of the ECL-CF gel. According to the results, the ECL amount can be measured 30 min after skin application. In contrast to the conventional preparation, ECL-TL application demonstrated rapid drug absorption, with Cmax reaching the dermis and epidermis within 1.5 h and 2 h, respectively, after topical application. The ECL concentration gradually decreased until the 8-hour mark, when the drug's concentration remained detectable. The study showed significant value with P < 0.0001. Tskin max = Time to maximum concentration, Cskin max = Maximum concentration, AUC = Area Under Curve, Ke = Elimination Rate Constant. *Significant value with P < 0.0001.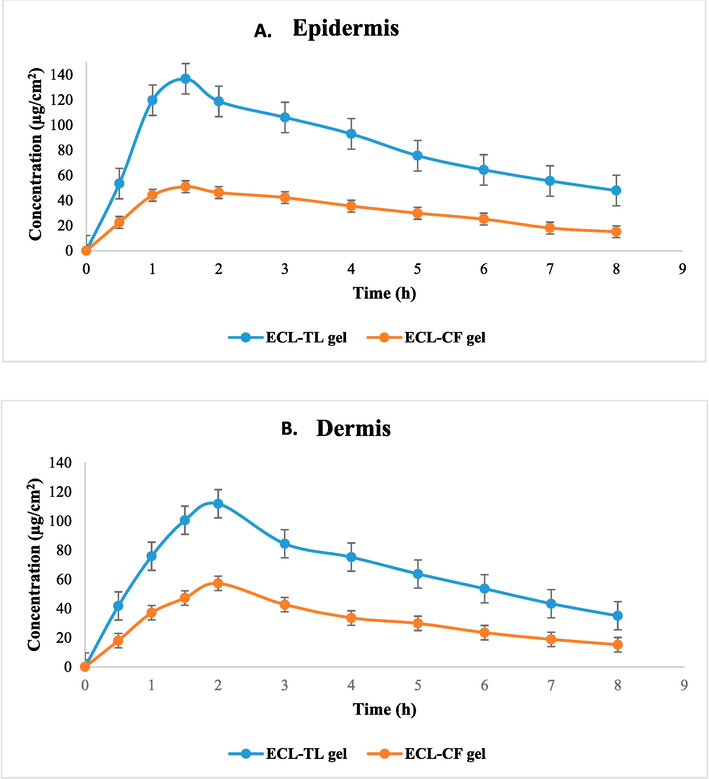
Dermatokinetic graph showing esculin concentration on (A) Epidermis and (B) Dermis after topical application of gel on rat skin.
Dermatokinetics
Parameters
ECL-CF gel*
ECL-TL gel*
Epidermis
Dermis
Epidermis
Dermis
Tskin max (h)
1.5 ± 0.3
1.5 ± 0.2
1.5 ± 0.2
2.0 ± 0.1
Cskin max (µg/cm2)
52.21 ± 4.47
58.31 ± 2.74
151.4 ± 5.31
114.4 ± 6.28
AUC 0-8 (µg/cm2h)
247.3 ± 4.72
251.3 ± 14.26
642.63 ± 18.3
536.8 ± 21.3
Ke (h−1)
0.15 ± 0.02
0.12 ± 0.01
0.11 ± 0.02
0.07 ± 0.01
4 Discussion
The study offers insightful information about the topical delivery effectiveness of the ECL-TL nanogel. In this article we have performed the preparation and optimisation of TLs, in-vitro drug release, antioxidant studies, skin permeation studies, CLSM and skin kinetic studies and stability studies of the optimized ECL-TL.
With the help of BBD software, optimization of ECL-TL formulation was performed. As increase in LPs and CLT, decreased the entrapment efficiency and increased when amount of SC increased. The ECL-TL formulation vesicles showed a clearly defined, spherical, and uniformly sized structure, as the TEM image verified. Compared to the in vitro release exhibited by ECL-CF and ECL-TL displayed 2.1 times increase in terms of drug release. The ECL-TL formulation has a 74.2 % antioxidant effect, compared to 91.14 % in the ascorbic acid solution. This outcome confirms that ECL-TLs gel has antioxidant properties. The antioxidant efficacy of ECL was found to be unaffected by its integration into TL. Compared to the skin permeation study demonstrated by ECL-CF and ECL-TL showed a 2.2 times increase in drug permeation.
Similarly, compared to the CLSM study using a hydroalcoholic solution and ECL-TL exhibited 1.67 times greater penetration into the skin. The dermatokinetic study suggested that TLs enhance the permeability of the delivery system when topically applied. This finding can be associated with the prior findings from the skin permeation and CLSM parameters, which showed maximum permeability of the ECL-TLs due to their elasticity and the existence of an edge activator.
5 Conclusion
In this article, BBD software was utilised to optimise ECL-TL formulations. The improved ECL-TL formulation featured nano-sized vesicles with %EE 85.95 ± 2.75 %, and the results of invitro drug release revealed that the optimised ECL-CF exhibited a lower percentage of drug release (42.43 ± 1.42 %) compared to optimised ECL-TL (88.24 ± 1.82 %). The cumulative permeation of ECL from the ECL-CF was found 38.57 ± 2.32 %, whereas it increased to 85.32 ± 3.35 % from the optimised ECL-TL gel. Our findings from the CLSM parameter revealed that ECL-TL gel facilitated greater rhodamine B permeability through skin associated with the rhodamine B control liquid. Furthermore, dermatokinetic analysis demonstrated that the ECL-TL gel better absorbed ECL than the ECL-CF gel. Importantly, ECL's antioxidant properties remained unaffected even after incorporation into TL vesicles.
TLs' LP-based vesicular system establishes reservoirs within the depth of the skin and distributes the drug gradually over a period, reducing the need for frequent treatments. These results suggest that the developed TL formulation has the potential to be a valuable drug carrier for the topical administration of ECL, particularly in the amelioration of skin cancer.
CRediT authorship contribution statement
Abdullah S. Alshetaili: Conceptualization, Data curation, Formal analysis, Funding acquisition, Investigation, Methodology, Project administration, Resources, Software, Supervision, Validation, Visualization, Writing - original draft, Writing - review & editing.
Funding
“This study was also supported via funding from Prince Sattam bin Abdulaziz University, project number (PSAU/2023/R/1444)”.
Declaration of Competing Interest
The authors declare that they have no known competing financial interests or personal relationships that could have appeared to influence the work reported in this paper.
References
- Design, formulation and optimization of valsartan transdermal gel containing iso-eucalyptol as novel permeation enhancer: preclinical assessment of pharmacokinetics in Wistar albino rats. Exp. Opinion. Drug. Deliv.. 2014;11:1149-1162.
- [CrossRef] [Google Scholar]
- The ameliorated longevity and pharmacokinetics of valsartan released from a gel system of ultradeformable vesicles. Artificial Cells. Nanomed. Biotechnol.. 2016;44:1457-1463.
- [CrossRef] [Google Scholar]
- Eprosartan mesylate loaded bilosomes as potential nano-carriers against diabetic nephropathy in streptozotocin-induced diabetic rats. Eur. J. Pharm. Sci.. 2018;111:409-417.
- [CrossRef] [Google Scholar]
- Sorbitane Monostearate and cholesterol based niosomes for Oral delivery of Telmisartan. Curr. Drug Deliv.. 2018;15(2):260-266.
- [CrossRef] [Google Scholar]
- Development of ethosomal gel of ranolazine for improved topical delivery: in vitro and ex vivo evaluation. J. Mol. Liq.. 2017;225:475-481.
- [CrossRef] [Google Scholar]
- Preparation of chitosan okra nanoparticles: optimization and evaluation as mucoadhesive drug delivery system. Pharmaceut. Nanotechnol.. 2018 Sep 1;6(3):180-191.
- [Google Scholar]
- Synthesis and in vitro assessment of anticancer hydrogels composed by carboxymethylcellulose-doxorubicin as potential transdermal delivery systems for treatment of skin cancer. J Mol Liq. 2018;266:425-440.
- [CrossRef] [Google Scholar]
- Evaluation of the pharmacodynamics and pharmacokinetics of brucine following transdermal administration. Fitoterapia. 2013;86:193-201.
- [CrossRef] [Google Scholar]
- Brucine PEGylated nanoemulsion: in vitro and in vivo evaluation. Colloids Surf, A Physicochem Eng Asp.. 2021;608:125618
- [CrossRef] [Google Scholar]
- Formulation and evaluation of thymoquinone niosomes: application of developed and validated RP-HPLC method in delivery system. Drug Dev. Ind. Pharm.. 2019;45:1799-1806.
- [CrossRef] [Google Scholar]
- Tailoring of berberine loaded transniosomes for the management of skin cancer in mice. J. Drug. Deliv. Sci. Technol.. 2020;60:102051
- [CrossRef] [Google Scholar]
- PLGA biodegradable nanoparticles containing perphenazine or chlorpromazine hydrochloride: effect of formulation and release. Int. J. Mol. Sci.. 2014;15:23909-23923.
- [CrossRef] [Google Scholar]
- Suppression of lipid hydroperoxide-induced oxidative damage to cellular DNA by esculetin. Biol. Pharm. Bull.. 2003;26:840-844.
- [CrossRef] [Google Scholar]
- In vitro and in vivo investigation of a dual-Targeted nanoemulsion gel for the amelioration of psoriasis. Gels.. 2023;9:112.
- [CrossRef] [Google Scholar]
- Franz diffusion cell and its implication in skin permeation studies. J. Disp. Sci. Technol.. 2023;16:1-4.
- [CrossRef] [Google Scholar]
- The pharmacological and pharmacokinetic properties of esculin: a comprehensive review. Phytother. Res.. 2022;36:2434-2448.
- [CrossRef] [Google Scholar]
- In vitro and in vivo evaluation of novel NGR-modified liposomes containing brucine. Int. J. Nanomed.. 2017;12:5797-5804.
- [CrossRef] [Google Scholar]
- Fluconazole loaded chitin nanogels as a topical ocular drug delivery agent for corneal fungal infections. J. Biomed. Nanotechnol.. 2013;9:1521-1531.
- [CrossRef] [Google Scholar]
- Development of transethosomes formulation for dermal fisetin delivery: box-behnken design, optimization, in vitro skin penetration, vesicles-skin interaction and dermatokinetic studies. Artif Cells Nanomed Biotechnol.. 2018;46:755-765.
- [CrossRef] [Google Scholar]
- Fisetin loaded binary ethosomes for management of skin cancer by dermal application on UV exposed mice. Int. J. Pharm.. 2019;560:78-91.
- [CrossRef] [Google Scholar]
- Penetration enhancer-containing vesicles (PEVs) as carriers for cutaneous delivery of minoxidil. Int. J. Pharm.. 2009;380:72-79.
- [CrossRef] [Google Scholar]
- Esculin exhibited anti-inflammatory activities in vivo and regulated TNF-α and IL-6 production in LPS-stimulated mouse peritoneal macrophages in vitro through MAPK pathway. Int. Immunopharmacol.. 2015;29:779-786.
- [CrossRef] [Google Scholar]
- HPLC determination of esculin and esculetin in rat plasma for Pharmacokinetic studies. J Chromatogr. Sci.. 2015;53:1322-1327.
- [CrossRef] [Google Scholar]
- Anticarcinogenic effect of brucine in diethylnitrosamine initiated and phenobarbital-promoted hepatocarcinogenesis in rats. Chem. Biol. Interact.. 2013;206:214-221.
- [CrossRef] [Google Scholar]
- Investigation of a minocycline-loaded nanoemulgel for the treatment of acne rosacea. Pharmaceutics. 2022;14:2322.
- [CrossRef] [Google Scholar]
- Effect of a total extract from Fraxinus ornus stem bark and esculin on zymosan- and carrageenan-induced paw oedema in mice. J. Ethnopharmacol.. 1995;46:101-106.
- [CrossRef] [Google Scholar]
- Production of large surface area activated carbon from a mixture of carrot juice pulp and pomegranate peel using microwave radiation-assisted ZnCl2 activation: an optimized removal process and tailored adsorption mechanism of crystal violet dye. Diam. Relat. Mater.. 2022 Dec;1(130):109456
- [Google Scholar]
- Nanopotentiation of propolis for revocation of enzyme imbalance in UVB induced cutaneous toxicity in murine model: a preliminary study for chemoprotection of skin cancer. Drug Deliv. Lett.. 2013;3:70-77.
- [CrossRef] [Google Scholar]
- A pH-sensitive surface of chitosan/sepiolite clay/algae biocomposite for the removal of malachite green and remazol brilliant blue R dyes: optimization and adsorption mechanism study. J. Polym. Environ.. 2023 Feb;31(2):501-518.
- [Google Scholar]
- Design and development of a commercially viable in situ nanoemulgel for the treatment of postmenopausal osteoporosis. Nanomedicine. 2020;15:1167-1187.
- [CrossRef] [Google Scholar]
- Anti-apoptotic effect of esculin on dopamine-induced cytotoxicity in the human neuroblastoma SH-SY5Y cell line. Neuropharmacol. 2007;53:724-732.
- [CrossRef] [Google Scholar]
Appendix A
Supplementary data
Supplementary data to this article can be found online at https://doi.org/10.1016/j.jksus.2024.103166.
Appendix A
Supplementary data
The following are the Supplementary data to this article:


