

Translate this page into:
Depicting of groundwater potential in hard rocks of southwestern Saudi Arabia using the vertical electrical sounding approach
⁎Corresponding author. ssalarifi@KSU.EDU.SA (Saad S. Alarifi),
-
Received: ,
Accepted: ,
This article was originally published by Elsevier and was migrated to Scientific Scholar after the change of Publisher.
Peer review under responsibility of King Saud University.
Abstract
In the hard rock terrains of southwestern Saudi Arabia, vertical electrical soundings (VES) were used to demarcate groundwater potential zones. To map the groundwater potential zones, 16 VES were done using a Schlumberger electrode array arrangement. Zond-IP computer software was used to analyze and interpret field measurements. The pseudo and resistivity cross-sections have been processed. The evaluation of the 1D geoelectrical curves revealed that the area is characterized by three geoelectrical resistivity layers. The topmost layer of unconsolidated alluvium deposits, which has a wide range of resistivities (42.28 to 297.97 Ω·m) and a thickness of up to 6 m, is the first of these layers. This range of resistivity is linked to changes in the layer's lithology and humidity. The second layer's resistivity values range from 372 to 3625 Ω·m, while the third layer's resistivity values range from 1015.37 to 21113 Ω·m. The second layer's resistivity implies fractured and weathered/jointed basement rocks, and the third layer's resistivity indicates broken to huge basement rocks. According to the findings, the worn and fractured horizons of basement rocks found in the vicinity are acceptable groundwater potential aquifers. The degree of weathering and fracture of the foundation rocks, and thus their water saturation, can be linked to vertical and horizontal variations in resistivity.
Keywords
Vertical electrical sounding (VES)
Groundwater
Resistivity
Fractured hard rocks
Saudi Arabia

1 Introduction
Saudi Arabia is one of the driest places, with erratic and unpredictable rainfall. There are numerous ephemeral streams that recharge the aquifers on a regular basis. These groundwater reservoirs are the country's most important water sources. Due to rapid development in the industrial, agricultural, and household sectors, modern civilization is the most populated and prosperous, and groundwater exploitation is rigorous due to its eternal needs. Weathered and cracked basalt confined between weathered overburden and the hard rock appears to be a source of groundwater. Exploration and use of groundwater resources, then, necessitate a thorough understanding of the area's geology, hydrogeology, and geomorphology.
If the fractures are saturated with groundwater, the resistivity of broken rocks and fresh firm rock will be noticeably different, as fractured rocks have a lower resistivity than hard rock (Karous and Mares, 1988; Rai et al., 2013). One of the geophysical approaches for studying the nature of the flow of electricity beneath the earth's surface and how to detect it on the surface is the geoelectrical method (Octova et al., 2018, 2019). It can be known and expected layers of rocks or layers of groundwater (aquifer), thickness, and depth by displaying the subsurface resistivity section of the geoelectrical measurements data.
The geoelectrical approach is used to determine the order of underlying geological layers so that it may be determined whether or not an aquifer layer exists (Gisland et al., 2017). One of the oldest methods of electrical exploration is the vertical electrical sounding method (VES). It was first used in the twentieth century, in the twenties. VES's relative simplicity and clarity led to its extensive adoption and development all over the world (Sonar et al., 2018). Electrical soundings are still the most common type of exploration today.
Geophysical methods, particularly the VES method, have proven to be effective in determining the depth of occurrence of fractured zones and locating groundwater potential well sites in hard rock terrain, and the electrical resistivity method can be used to determine the depth of occurrence of fractured zones and locate groundwater potential well sites (Singhal, 1997; Yadav and Singh, 2007; Rai et al., 2011; Srivastava et al., 2012; Maiti et al., 2013; Ratna Kumari et al., 2012; Kumar et al., 2014; Yousuf et al., 2015; Gupta et al., 2015; Tarawneh and Janardhana, 2017). The VES approach has been effectively utilized to assess the formation's thickness and groundwater potential (Raju and Reddy, 1998), and the groundwater potential of fractured hard rock terrains has been researched in various regions of the world over the last few decades.
Gopalan (2011), for example, undertook a systematic electrical resistivity survey in Kasaragod District, Kerala State, India, to delineate the water-bearing zones in the lateritic plateaus. Al-Amri (1996) identified an aquifer system linked with fractured diorite and granodiorite basement rocks, which are recharged by wadi alluvium. In addition, in Ikunri Estate, Southwestern Nigeria, Ologe and Bankole (2014) used the resistivity method to delineate the fractured basement aquifer, and Chandra et al. (2012) investigated a deep potential aquifer in weathered/fractured granite, gneiss, and schist crystalline rocks in Dichpally, Nizamabad, India.
As illustrated in Fig. 1, the researched region extends from Wadi AlRabbah to the southeast of Ahud Rufeidah, on the southern border of the Abha District, between latitudes 18°11′00′′ N and 18°11′ 41′′ N and longitudes 42°51′49′′ E and 42°52′28′′ E. This land is designated as an urban extension area for two communities that rely on groundwater for agriculture and drinking water. Almadni et al. (2015a,b,c) studied the site response and geotechnical properties of the surface soil and bedrock in the study area. Water scarcity for home, agricultural, and industrial reasons exists in the study area, which is a hard rock landscape with undulating topography.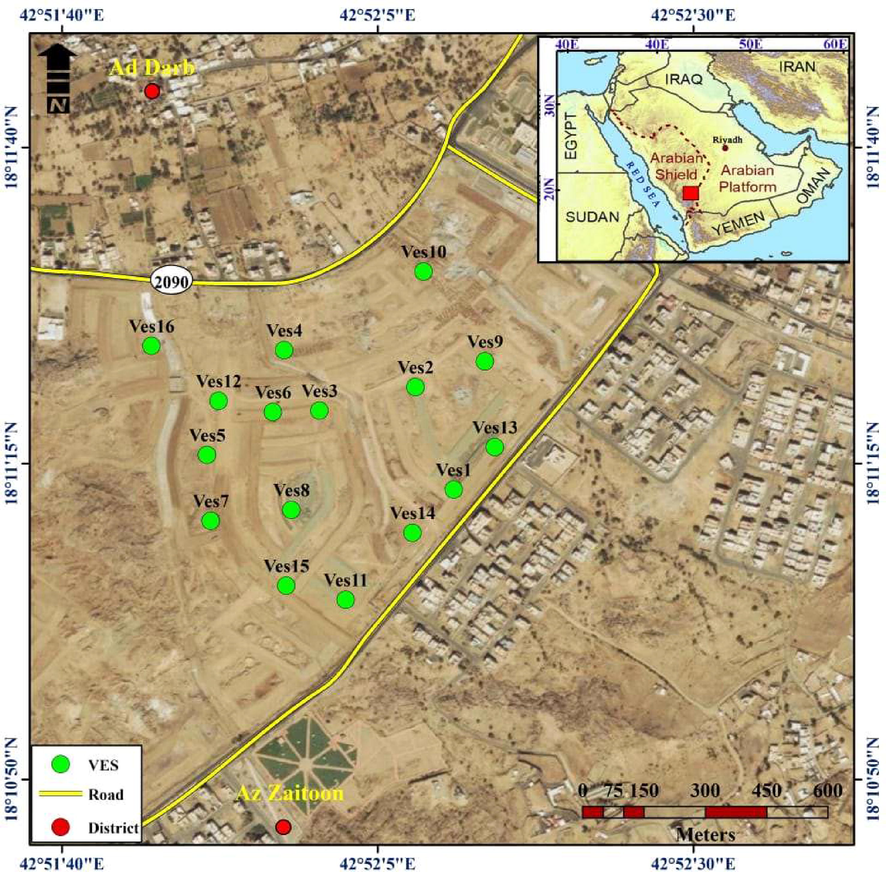
Location map of the study area including VES stations.
2 Geological setting of the study area
The Arabian Shield's deepest erosional level is represented by the basement rocks uncovered in the research region (Fig. 2). Khamis Mushayt Gneiss represents these basement rocks, and Khamis Mushayt Gneiss underpins the majority of the examined site. Banded orthogneiss, migmatite with little amphibolite, and paragneiss make up these rocks. Numerous pegmatite dikes have encroached on this unit. The basement rocks are covered by a dry bed of slop-wash alluvial deposits made up of pebbles, gravels, sands, and clays of varied thickness. Wadi Ar Rabbah, like many other desert drainage channels, has no external outlet and generates a gently sloping plain downstream. Running water from the upstream and adjacent worn gneiss basement uphills delivered the alluvium material to the examined site through an incised network of narrow and active channels.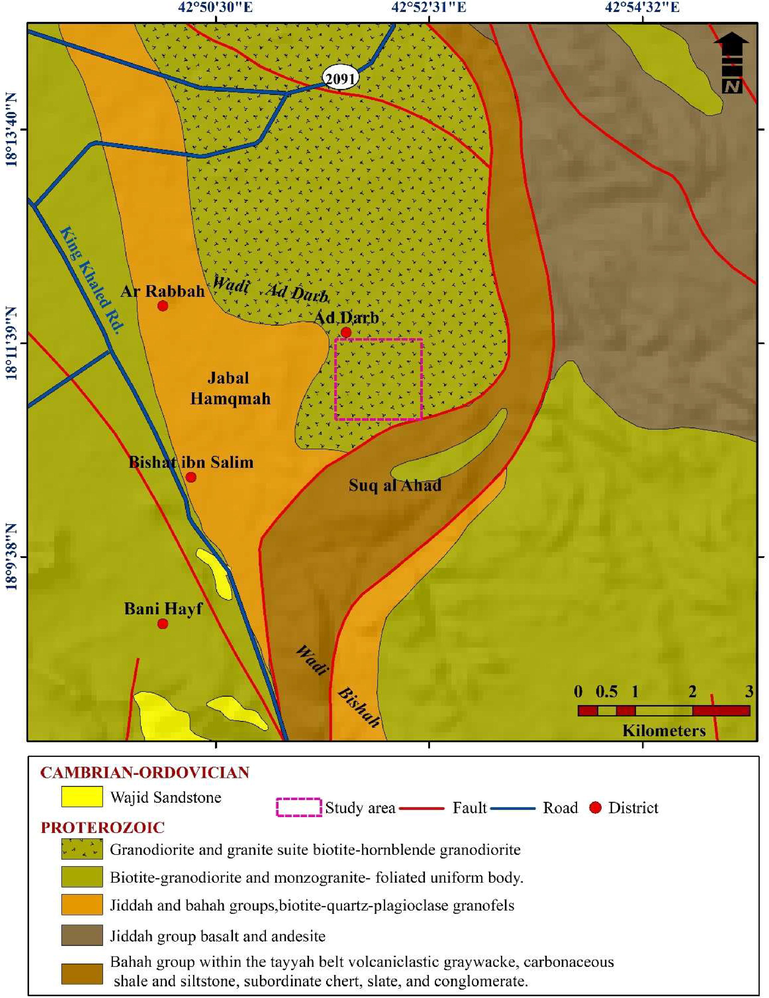
Geological setting map of Wadi Ar Rabbah (Denis et al., 1991).
The underlying weathered readily eroded gneiss basement rocks could be referred to as the presence of such small and narrow channels, resulting in an increase in channel depth and groundwater productivity. The area is structurally defined by left-lateral strike-slip faults, right-lateral strike-slip faults, joints, asymmetric anticline folds, comparable folds, dikes, veins, and veinlets. The most recent structural event is tertiary normal faulting connected to volcanism and the creation of the Red Sea depression (Coleman and Brown, 1971).
The study region is clearly defined by the geometry of a wide range of structures and a wide range of lithological variances. Where they aid the storage and flow of water, these structures and lithologic variations are significant. On the other hand, where the groundwater flow in fractured rocks is controlled by joints, fractures, shear zones, and faults, dykes can operate as barriers to water flow (Banks, 1998; Barton, 1996; Clauser, 1992).
The basin is a fourth-order basin hydrogeologically, as evidenced by the stream distribution in the study area map. The basin's greatest and minimum elevations range from 2036 to 2404 m, with an average elevation of 2220 m above sea level. The flow of the stream is from southeast to northwest (Fig. 3). The geography influences the flow of the streams, which flow dendritically. The third-order stream, seen on the map in light blue, travels south to north and is structurally regulated and influenced by a north–south trending lineament. The lineament zone is the northward extension of the third-order stream that governs its flow.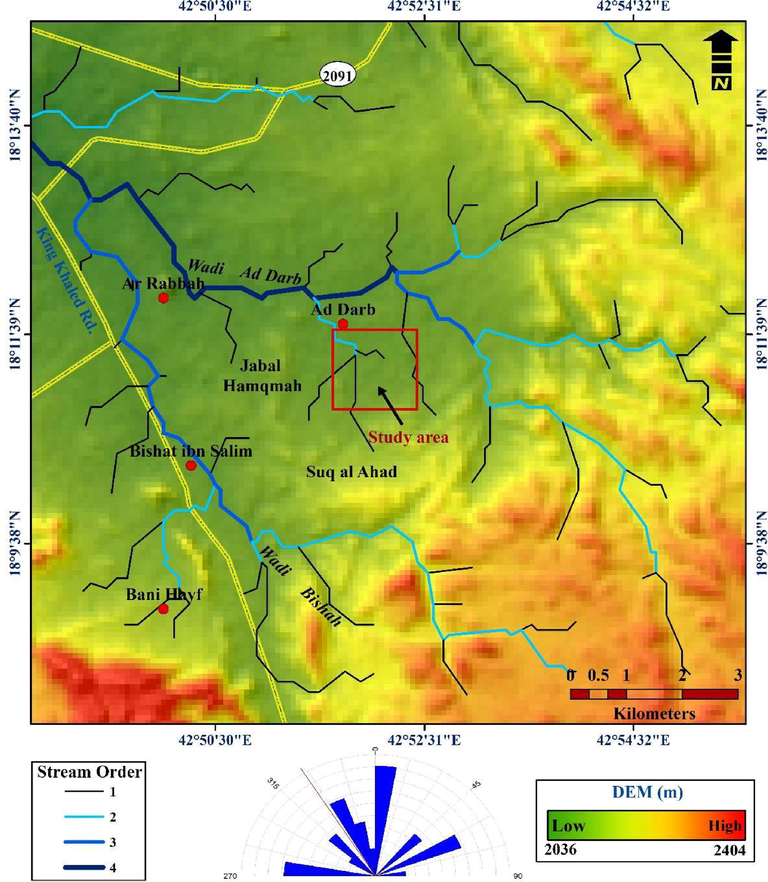
Stream order of Wadi Ar Rabbah basin.
3 Data acquisition, processing, and interpretation
The well-known hypothesis that electrical resistivity contrasts exist across lithologic unit interfaces in the subsurface is used for the interpretation of geoelectrical resistivity data, but that these contrasts are often sufficient to demarcate discrete geoelectrical layers and identify aquiferous or non-aquiferous layers (Schwarz, 1988). Furthermore, water saturation and water quality have a significant impact on the resistivity of earth materials (Lucius et al., 2001).
The field procedure in this investigation was Vertical Electrical Sounding (VES) with a Schlumberger array, which was done at 16 VES sites. With the current electrode spacing of AB/2 = 150 m, the profiles were maintained in regular north–south orientation. Four collinear electrodes make up the Schlumberger array. The two electrodes on the outside are current source electrodes, whereas the two electrodes on the inside are potential electrodes. The potential electrodes are placed in the center of the electrode array with a tiny space between them, usually less than one-fifth of the current electrode spacing. During the survey, the current electrodes are separated farther, while the potential electrodes remain in the same place until the recorded voltage is too low to measure.
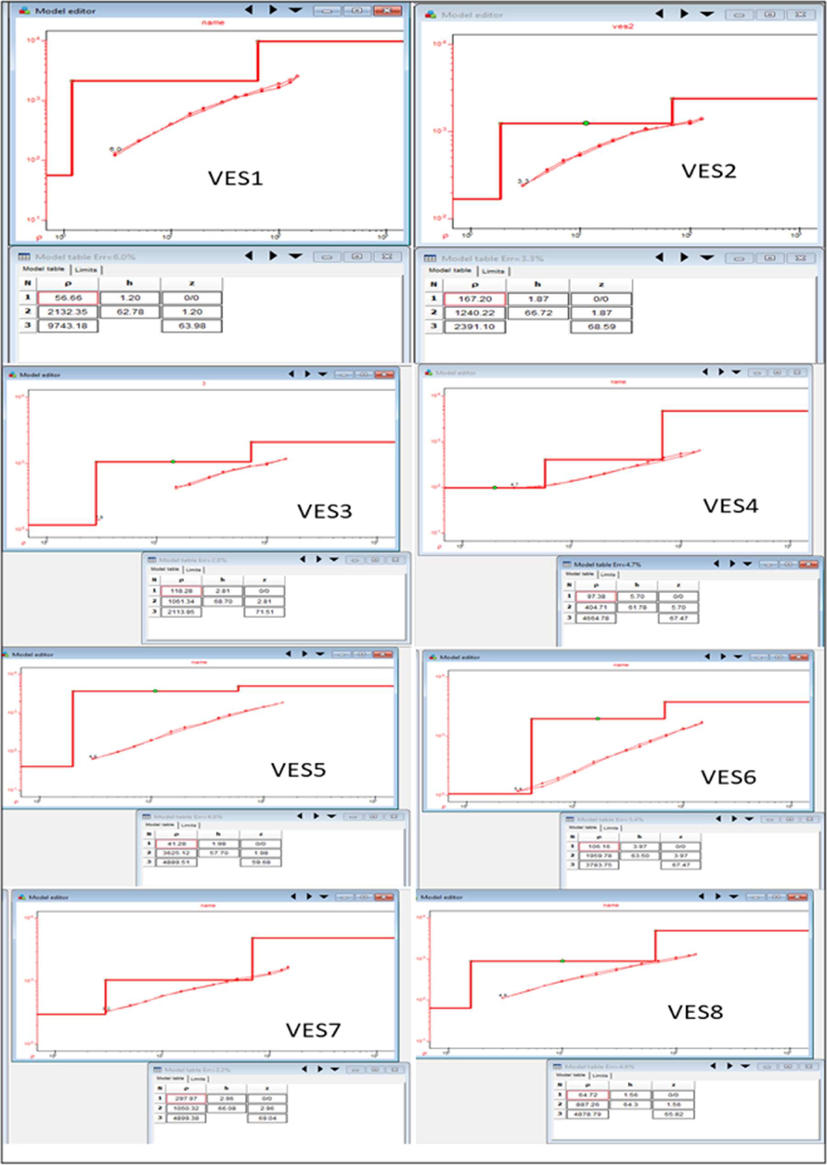
The 1-D inversion technique software (Zond-IP) was used to process the sounding field data in terms of layer parameters. The resistivity model is built using this program, which fits the acquired field data with the least root mean square (RMS) error between the synthetic data generated from the model and the actual data. Table 1 shows the real resistivity values for the subsurface layers, as well as their thickness and depth from the ground surface, as output from the Zond-IP computer software. Fig. 4 depicts representative examples of VES data and interpretation outcomes.
VES No:
Layer 1
Layer 2
Layer 3
Resistivity
(Ω.m)Thickness
(m)Resistivity
(Ω.m)Thickness
(m)Resistivity
(Ω.m)Thickness
(m)
VES1
55.66
1.2
2132.35
61.6
9743
–
VES2
137.2
1.87
1240
64.85
2391.1
–
VES3
118.28
2.81
1061.34
66
21113.95
–
VES4
97.38
5.7
404.71
55.34
4664.78
–
VES5
42.28
1.98
3625.12
55.62
4889.51
–
VES6
106.16
3.97
1959.87
63.5
3783.75
–
VES7
297.97
2.96
1050.38
63
4899.38
–
VES8
64.72
1.65
887.26
64.3
4878.79
–
VES9
132.85
0.89
2080.57
58
3485
–
VES10
148.9
3.43
1859.1
52.4
2269.51
–
VES11
184.04
3.02
1295.93
59
2111.07
–
VES12
166.81
2.11
1184.26
64
1958.4
–
VES13
172.7
1.59
1486.57
67
2243.85
–
VES14
94.08
1.08
1420.83
68
2211.22
–
VES15
110.97
1.07
697.74
67
1015.37
–
VES16
130.6
5.95
372.76
64
3957
–
The constructed one-dimensional inverse model with true resistivity, thickness, and depth to the top of each layer.
Geoelectrical field curves frequently indicate the character of the consecutive lithologic succession in a given place and can thus be used to assess the groundwater prospect of an area in a qualitative sense (Worthington, 1977). The analysis of the sounding curves can thus be used to calculate the geoelectrical characteristics of the aquifer units. The interpreted resistivity data from the area shows three geoelectrical resistivity layers based on this approach. The topmost layer has a wide range of resistivity values (from 42.28 to 297.97 Ω·m, Table 1) and a thickness of 0.89 to 5.95 m.
This layer is thought to be made up of alluvial sediments ranging from sand to silty sand (Fig. 5a). The second geoelectrical resistivity layer, which can be separated into three geoelectrical resistivity zones, lies beneath this layer (Fig. 5b). Low resistivity readings in the western zone (less than 1200 Ω·m), indicate the presence of a worn and heavily fractured basement layer wet with fresh water. Meanwhile, the eastern zone has a relatively high resistivity, ranging from 1200 to 2200 Ω·m, and a thickness of 52 to 68 m. This indicates the partially fractured basement rocks. While the massive basement rocks outcrop in the western side of the study area could explain the zone's high resistivity (greater than 2500 Ω·m).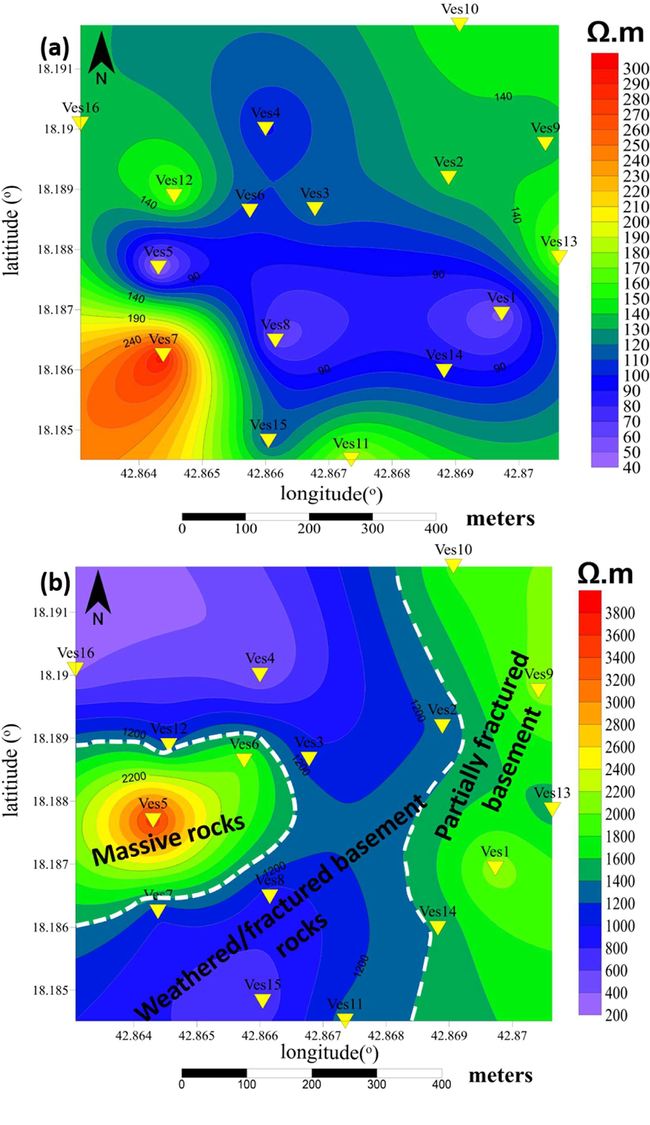
Contour maps for the true resistivity (ohm m), a) for the alluvial topmost layer, b) for the second highly fractured/weathered basement.
The low resistivity zone in the second geoelectrical resistivity layer could be interpreted as highly fractured basement rocks saturated with fresh water, and thus represent a shallow groundwater aquifer in the study area, with a maximum depth up to 6 m (Fig. 6a) and a thickness of 52 to 68 m (Fig. 6b).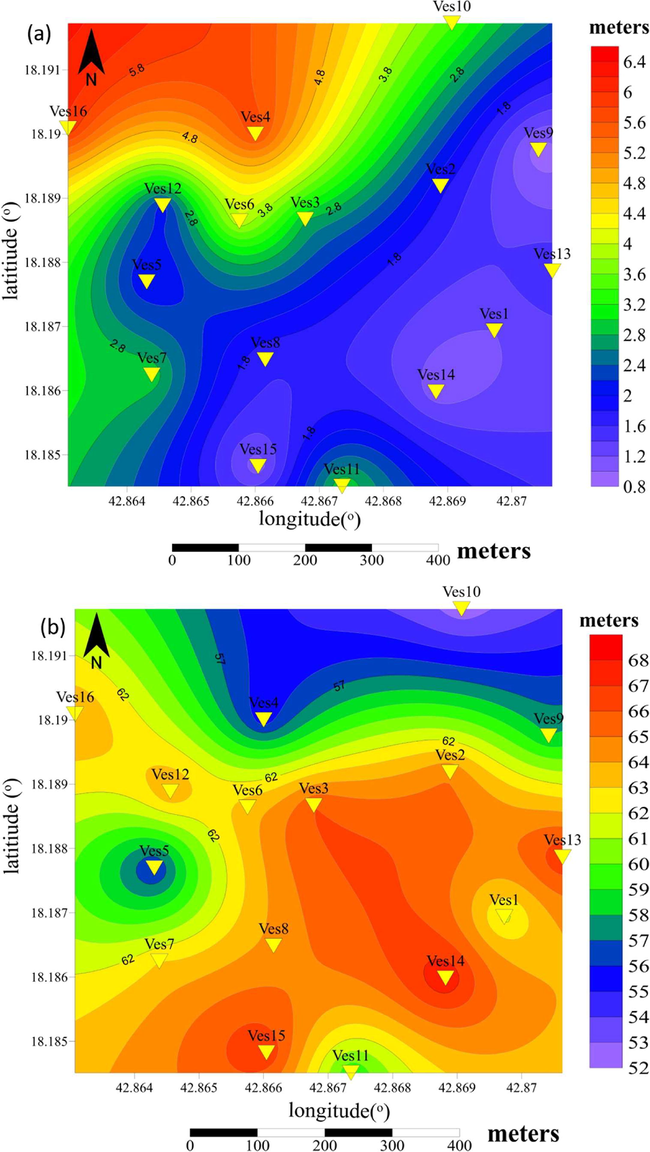
Contour maps for thickness (m), a) for the alluvial topmost layer, b) for the second highly fractured/weathered basement.
4 Resistivity cross-sections
For the VES stations that traverse the investigation region, pseudo-cross-sections have been created. There are four cross-sections in all. The stations A-B, C-D, E-F, and G-H were used to generate resistivity cross-sections, with almost horizontal and linear stations being used to produce these cross-sections (Fig. 7). The change of resistivity across the spots taken in VES stations was demonstrated by the estimated VES pseudo and resistivity cross-sections.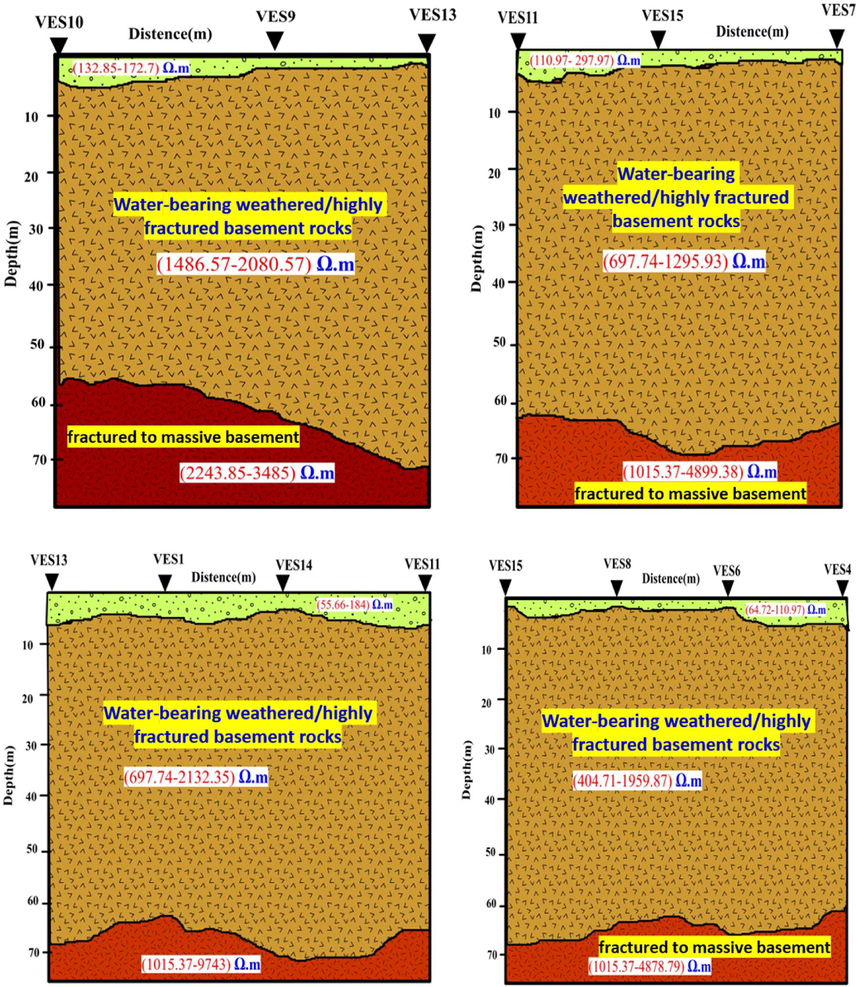
Geoelectric cross-section representing the VES stations conducted across the area.
Fig. 7 shows resistivity cross-sections in the research area along with profiles A-B, C-D, E-F, and G-H. The top green colored layer varies between 1.2 and 6 m in all sections, with the surface soil layer having a very low resistivity (>55.66 Ω·m). The low resistivity zone (404.71–2132 Ω·m) can be found up to 60 m below the soil layer. This suggests the presence of a worn and cracked basement layer as well as a productive groundwater zone. The viable zone at station S14 stretches up to 68 m, indicating a very worn or cracked basement. The falling high resistivity zone, on the other hand, is sandwiched between layers of low resistivity. The resistivity anomaly at stations S4, S15, S8, and S6 is constantly decreasing, indicating a possible zone for groundwater occurrence.
The trend is increasing (1859 to 2132.35 Ω·m) as you fall 68 m down at stations S10, S6, S9, and S1. This suggests a transition from a moderately fractured to a firm and compact basement in the less fruitful groundwater exploration zone.
The sounding data was also used to create a thorough representation of the watershed on a horizontal scale across four separate parts (Fig. 7).
-
A-B is generated by covering VES S13, S1, S14, and S11;
-
C-D is generated by covering VES S13, S1, S14, and S11.
-
E-F across S11, S15, and S7 of the VES.
-
G-H traversing VES S15, S8, S6, and S4.
The resistivity anomaly rises to 60–4899 Ω·m below station S8, indicating a very weathered/fractured basement layer followed by a firm and large basement layer. Furthermore, the resistivity rises to 60–887 Ω·m. This zone has the potential to act as an aquifer. However, in the presence of a massive basement, resistivity increases from 900 to 4899 Ω·m in the deeper sections. However, a falling trend of resistivity from 404 to 697.74 Ω·m was found at stations S4 and S15, indicating the presence of a heavily worn or cracked basement and groundwater potential zone. The resistivity trend increases below the soil layer up to 1015–4664 Ω·m, indicating the presence of a hard and vast basement layer.
The presence of a heavily worn or cracked basement that serves as a groundwater potential zone is then indicated by a falling resistivity anomaly of 404 to 697.74 Ω·m. At deeper levels, the resistivity anomaly rises to 4664 Ω·m, and the resistivity rises from 404 to 697.97 Ω·m, indicating the presence of a severely weathered/fractured and jointed basement, as well as a groundwater potential zone. The top layer resistivity (55.66 – 297.97 Ω·m) is reduced at all sites, indicating the presence of either soil or water. At S7, the resistivity trend rises to 4899 Ω·m, indicating a fresh huge basement. Below S4 and S15, the resistivity anomaly drops dramatically to 404–697 Ω·m, which could be a groundwater potential zone. Resistivity rises to 4899 m below ground level, suggesting the existence of hard rocks. The resistivity in the first 3.2 m is low (42 – 297.97 Ω·m) at all locations, indicating soft soil. There is a progressive increase in resistivity (1015–9743 Ω·m) at all locations, indicating a hard or massive basement.
5 Discussion and conclusion
In order to delineate a shallow groundwater aquifer in the research area, a resistivity survey was done in the wadi Ar rabbah area in the southwest section of the Arabian Shield. These rocks are considerably worn and fractured in numerous areas, which may increase their porosity and permeability, according to the field survey. As a result, these worn and fractured basement rocks can serve as a stable aquifer and a significant source of groundwater.
Vertical electrical soundings were carried out utilizing a Schlumberger setup with half-spaced current electrodes that reached a depth of 150 m. During the field data collection, and Iris Syscal R2 field resistivitymeter was employed. In the study area, 16 VES stations were used to collect data. The data analysis and resistivity results show that there are three layers, with the first layer's resistivity ranging from 42 to 297 Ω·m, the second layer's resistivity ranging from 372 to 3625 Ω·m, and the third layer's resistivity values ranging from 1015.37 to 21113 Ω·m.
The VES station's results are closely associated with the geological environment of the research area, which includes lateral lithological differences and varying degrees of weathering and fracturing. Geoelectrical investigations confirm this, revealing a wide variety of resistivity levels throughout the studied area. The topmost geoelectrical layer has a wide range of resistivity, indicating dry gravelly to sandy soil with a 6 m thickness; the second geoelectrical layer has moderate resistivities, indicating weathered and highly fractured basement; and the third geoelectrical layer has high to very high resistivity values, indicating massive (unfractured) basement.
The presence of a shallow groundwater aquifer hosted by worn and cracked basement rocks was discovered by interpreting the vertical electrical soundings (VES) sections. The aquifer's groundwater is mostly constrained to the fracture zones. A water-bearing weathered/fractured basement can be found at depths ranging from 1 up to 6 m. The water-bearing rock unit is covered by a thin layer of wadi alluvium deposits. The arid climate of the research area contributes to the thinness of this worn and fragmented unit (Singhal and Gupta, 1999). The degree of fracturing and weathering, and thus the degree of water saturation, are related to the geoelectrical resistivity of these rocks.
The extent of groundwater storage and flow in these fractured basement rocks is influenced by the degree of fracturing and fracture connectivity (Cook, 2003; Almadani et al., 2019). This is because the cracks operate as conduits for groundwater flow in a matrix that is impermeable and devoid of porosity between the conduits.
Acknowledgements
This article has been supported by Researchers Supporting Project number (RSP2022R496), King Saud University, Riyadh, Saudi Arabia
Declaration of Competing Interest
The authors declare that they have no known competing financial interests or personal relationships that could have appeared to influence the work reported in this paper.
References
- The application of geoelectrical surveys in delineating groundwater in semiarid terrain. A case history from central Arabian Shield. M.E.R.C. Ain Shams Univ. Earth Sci. Ser.. 1996;10:41-52.
- [Google Scholar]
- Site response assessment of an urban extension site using microtremor measurements, Ahud Rufeidah, Abha District, Southwest Saudi Arabia. Arab. J. Geosci.. 2015;8(4):2347-2357.
- [Google Scholar]
- Evaluation of geotechnical parameters for the urban site in southern Khamis Mushait city, southwest Saudi Arabia, using seismic refraction method. Arab. J. Geosci.. 2015;8(8):6225-6236.
- [Google Scholar]
- Magnetic and seismic refraction survey for site investigation of an urban expansion site in Abha District, Southwest Saudi Arabia. Arab. J. Geosci.. 2015;8(4):2299-2312.
- [Google Scholar]
- Delineation of a fractured granite aquifer in the Alwadeen area, Southwest Saudi Arabia using a geoelectrical resistivity survey. Arab. J. Geosci.. 2019;12(15)
- [CrossRef] [Google Scholar]
- Predicting the probability distribution of yield from multiple boreholes in crystalline bedrock. Ground Water. 1998;36(2):269-274.
- [Google Scholar]
- Barton, C., 1996. Characterizing bedrock fractures in outcrop for studies of groundwater hydrology: an example from Mirror Lake, Grafton County, New Hampshire, In Morganwalp D. and Aronson D.A. (ed.) U.S. Geological Survey Toxic Substances Program, U.S. Geological Survey, Water-Resources Investigations Report 94–4015, 81–87.
- Exploring deep potential aquifer in water-scarce crystalline rocks. J. Earth Syst. Sci.. 2012;121(6):1455-1468.
- [Google Scholar]
- Permeability of crystalline rocks. EOS, Trans. Amer. Geophys. Union. 1992;73(21):233-240.
- [Google Scholar]
- Cook, P.G., 2003. A guide to regional groundwater flow in fractured rock aquifers. National Library of Australia Cataloguing-in-Publication entry. 115 p.
- Potensi Akuifer Air Tanah Pada Batuan Sedimen Tersier Berdasarkan Analisis Data Geolistrik Di Distrik Waisai Kota Kabupaten Raja Ampat, Provinsi Papua Barat. Bull. Sci. Contrib.: Geol.. 2017;15(2):181-192.
- [Google Scholar]
- A comparative study of the groundwater potential in hard rock areas of Rajapuram and Balal, Kasaragod, Kerala. J. Ind. Geophys. Union. 2011;15(3):179-186.
- [Google Scholar]
- Geoelectrical investigation for potential groundwater zones in parts of Ratnagiri and Kolhapur districts, Maharashtra. J. Indian Geophy. Union. 2015;19(1):27-38.
- [Google Scholar]
- Geophysical methods in studying fractured aquifers. Prague: Charles University; 1988. p. :93.
- Evaluation of heterogeneous aquifers in hard rocks from resistivity sounding data in parts of Kalmeshwar taluka of Nagpur district, India. Curr. Sci.. 2014;107(7):1137-1145.
- [Google Scholar]
- Results of electrical survey near Red River, New Mexico. USGS Open-File Report 01–331 2001:24.
- [Google Scholar]
- Delineation of shallow resistivity structure around Malvan, Konkan region, Maharashtra by neural network inversion of vertical electrical sounding measurements. Env. Earth Sci.. 2013;68:779-794.
- [Google Scholar]
- Octova, A., Sule, R., 2018. Seismic Travel Time Tomography in Modeling Low-Velocity Anomalies between the Boreholes. In IOP Conference Series: Materials Science and Engineering (Vol. 335, No. 1, p. 012056). IOP Publishing.
- Identification of Aquifer using Geoelectrical Resistivity Method with Schlumberger Array in Koto Panjang Area, Nagari Tigo Jangko, Lintau Buo Sub-District, Tanah Datar Regency. J. Phys.: Conf. Ser.. 2019;1185:012009.
- [Google Scholar]
- Adeoye TO (2014) Geo-Electric Study for Groundwater Development in Ikunri Estate, Kogi West, Southwestern Nigeria. Ilorin J. Sci.. 2014;1(1):154-166.
- [Google Scholar]
- Exploration of groundwater in the basaltic Deccan traps terrain in Katol taluka, Nagpur district. India. Curr. Sci.. 2011;101(9):1198-1205.
- [Google Scholar]
- Delineation of aquifers in basaltic hard rock terrain using vertical electrical soundings data. J. Earth Sys. Sci.. 2013;122(1):29-41.
- [Google Scholar]
- Fracture pattern and electrical resistivity studies for groundwater exploration. Environ. Geol.. 1998;34:175-182.
- [Google Scholar]
- 2D Electrical resistivity imaging for delineation of deeper aquifers in a part of the Chandrabhaga river basin, Nagpur District, Maharashtra, India. Curr. Sci.. 2012;102(1):61-69.
- [Google Scholar]
- Application of Geophysical Methods to Groundwater Exploration in the Tolt River Basin, Washington State. Geotechn. Environ. Geophys. Soc. Explor. Geophs, Tulsa. 1988;1:213-217.
- [Google Scholar]
- Singhal, B.B.S., 1997. Hydrogeological characteristics of Deccan trap formations of India, Hard rock hydrosystems, IAHS Publ. No. 241, pp, 75-80.
- Applied Hydrogeology of Fractured Rocks. The Netherlands: Kluwer Academic Publishers, Dordrecht; 1999. p. :400.
- Aquifer Characteristics in Hard Rock Terrain of GP-8 Watershed, Aurangabad District, Maharashtra Using Vertical Electrical Sounding Method. J. Geosci. Res.. 2018;3(2):153-162.
- [Google Scholar]
- Study and mapping of groundwater prospect using remote sensing, GIS, and geoelectrical resistivity techniques-a case study of Dhanbad district, Jharkhand, India. J. Indian Geophy. Union. 2012;16(2):55-63.
- [Google Scholar]
- An integrated approach of field and geophysical methods for the investigations of subsurface geology and potential sites for the artificial groundwater recharge in the NW part of Jordan. Int. J. Multidisc. Res. Dev.. 2017;4(2):1-11.
- [Google Scholar]
- Geophysical investigations of groundwater resources in the Kalahari Basin. Geophysics. 1977;42(4):838-849.
- [Google Scholar]
- Integrated resistivity surveys for delineation of fractures for groundwater exploration in hard rock areas. J. App. Geophy.. 2007;62(3):301-312.
- [Google Scholar]
- Delineation of groundwater potential zones in deep midland aquifers along Bharathapuzha river basin, Kerala using Geophysical Methods. Aqua Procedia. 2015;4:1039-1046.
- [Google Scholar]


