

Translate this page into:
Density functional aspects and thermodynamic evaluation of sodium dodecyl sulphate in aqueous tartrazine
⁎Correspondence author. mirjanmohammad@gmail.com (J.M. Mir)
-
Received: ,
Accepted: ,
This article was originally published by Elsevier and was migrated to Scientific Scholar after the change of Publisher.
Peer review under responsibility of King Saud University.
Abstract
Abstract
Sodium dodecyl sulphate (SDS) and tartrazine (TAR) are involved in manifold industrial and medicinal applications. Under such a fascination, this work describes the conjoint experimental-theoretical investigation of a binary mixture containing SDS in aqueous TAR (0.001 M). The study involves the evaluation of some primary thermodynamic parameters due to SDS-TAR micellization and a special focus on computational density functional theory (DFT) approach using water as solvent under 631-g(d,p) as basis set and B3LYP as the respective functional. Structures of both the SDS and TAR were separately optimized first, followed by the calculation of their mixture under the same quantum chemical theory. After confirming the absence of imaginary frequency in the frequency calculation of each set further theoretical calculations were done to get the respective molecular orbital energies and several other descriptors to reveal the difference of chemical behaviour in relation to pre- and post-micellization processes. The study shows remarkable agreement between DFT and experimental outcomes.
Keywords
SDS
Tartrazine
Thermodynamics
DFT

1 Introduction
The study of dye-surfactant interactions is one of the prominent disciplines bearing huge industrial and medicinal application. It is a known fact that surfactants are candidates of valuable interest that assist in dyeing by wetting, leveling or dispersing dyes of low solubility following the principle of absorption by fibers (Ghoreishi et al., 2007; Malik and Mir, 2018). The dye-surfactant systems and their investigation of interactions are currently used in analytical chemistry, photography, luminescence and lasers (Barni et al., 1991). The profound application of dye-surfactant systems makes these systems of interest for investigation. In this connection investigations leading to explore ionic interactions among surfactants and azo dyes have gained keen interests to design desirable agents (Garcia and Medel, 1986; Shatkh et al., 2007). These studies involve primarily the evaluation of volumetric, viscometric, spectroscopic and refractive index insights to arrive at some significant conclusions (Ali et al., 2009; Deshpande et al., 2018; Vinarov et al., 2018). Hence, knowledge of the dye-surfactant interface is indeed of great value in understanding the respective mechanism of chemical equilibrium and kinetics of surfactant- sensitized color and / or fluorescence reactions intervening in the process (Ray et al., 2009; Abu-Hamdiyyah and Al-Mansour, 1979). The investigation of tartrazine-surfactant interactions would help in understanding and development of new spectrophotometric and fluorimetric methods for the determination of micro amounts of metal ions, anions, and biological compounds. These systems are not investigated to be incorporated as food additives but to explore these systems for sensing purposes (Scheme 1).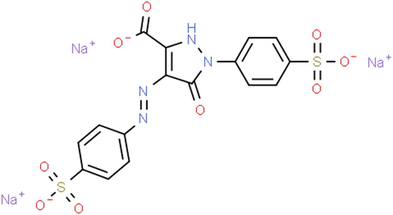
Chemical structure of tartrazine.
Tartrazine represents one of the effective anionic species that has been found relevant as drug-additive in proposing treatment to neural defects (Al-Shabib et al., 2018). Studies have revealed efficient electrostatic interactions exhibited by tartrazine which is important factor in induced amorphous aggregations (Al-Shabib et al., 2017a). Similarly, the potentiality of hydrophobic interaction plays a key role in tartrazine-amyloid fibrillations (Al-Shabib et al., 2017b). These findings suggest the importance of non-covalent binding of tartrazine in applying the compound as additive in drug-surfactant interface. On the other hand, sodium dodecyl sulphate is also worthy scaffold in the respect of colloidal and surface chemistry (Saeed et al., 2017; Enache and Toader, 2018). Therefore a combined experimental-theoretical study of these compounds represents a significant contribution towards dye-surfactant chemistry. Density functional theory (DFT) is considered as a modern powerful tool to validate the experimentally observed properties almost in all fields of science. The molecular interactions can be examined under both solvent-free and solvated fashion to unveil the hidden information of applied interests.
In the conspicuous fascination as aforementioned, this study involves physico-chemically evaluated thermodynamics of tartrazine and SDS mixture in combination with density functional aspects. The primary data in the form of specific conductance and surface tension of 0.002, 0.004, 0.006, 0.008, 0.010, 0.015, 0.020, and 0.025 M sodium dodecyl sulphate in 0.001 M aqueous tartrazine at 298.15, 303.15, and 313.15 K is investigated. The experimental values of conductivity and surface tension have been used to estimate various thermodynamic parameters like standard free energy, ΔGomic, enthalpy, ΔHo mic, and entropy, ΔSo mic, of micellization; standard free energy, ΔGo ad, enthalpy, ΔHo ad, and entropy, ΔSoad of adsorption, maximum (or simply) surface concentration values at the air–liquid interface, Γmax at cmc, minimum area per molecule, Amin y(nm2) at the liquid- air- interface, and the surface pressure at the cmc, cmc. DFT based calculations were used to arrive at the basic structural parameters of the involved dye-surfactant interactions involving electron-density plots and various other descriptors to speculate the pre- and post-micellization phenomena.
2 Experimental, chemicals and methods
Double distilled water was used for making the respective solutions. Ostwald’s viscometer was adjusted vertically in water bath (thermostated retained for half an hour to record thermal fluctuations if any during the experiment) to find the viscosity. Systronics conductometer and pH meter were other instruments used to record thermodynamic primary data. The pH of the studied system was not maintained to particular pH for specific group interactions but the overall effect of the tartrazine in aqueous medium at neutral pH was investigated. All the required experiments were carried other after calibration of each involved instrument. Analytical grade Sodium dodecyl sulphate (SDS), an anionic surfactant were purchased from sigma Aldrich
3 Results and discussion
3.1 Experimental discussion
The values of specific conductance, κ, surface tension, γ, and molar conductance, Λ, for sodium dodecyl sulphate in 0.001 M aqueous tartrazine are given in Table 1 as a dependent moiety of surfactant concentration at 298.15, 303.15, and 313.15 K. The specific conductance values are plotted against surfactant concentration and are shown in Fig. 1 at three different temperatures. The effect of various serially dilution solutions of SDS upon Tartrazine (0.001 M aq.) at different temperatures can be thought of the prominent way to build a relation for post-micellization and pre-micellization processes.
M
T (K)
(mol. dm−3)
298.15
303.15
313.15
Y(dyne / cm)
SDS + (0.001 M) aq. Tartrazine
0.00
61.1
56.6
52.0
0.002
33.1
34.9
35.9
0.004
31.0
32.6
33.8
0.006
29.6
31.0
32.7
0.008
28.5
29.2
30.8
0.010
28.3
29.0
30.7
0.015
28.4
29.1
30.8
0.020
28.3
29.0
30.6
0.025
28.3
29.0
30.6
Λ (mS cm2 mol−1)
SDS + (0.001 M) aq. Tartrazine
0.002
0.3850
0.4300
0.4750
0.004
0.2225
0.2475
0.2725
0.006
0.1750
0.1900
0.8023
0.008
0.1475
0.1550
0.1713
0.010
0.1230
0.1350
0.1470
0.015
0.0913
0.0980
0.1047
0.020
0.0740
0.0795
0.0850
0.025
0.0644
0.0692
0.0756
κ (mS cm−1)
SDS + (0.001 M) aq. Tartrazine
0.002
0.81158
0.90644
1.0013
0.004
0.93806
1.04346
1.14886
0.006
1.0670
1.20156
1.3175
0.008
1.24372 1.30696
1.44398
0.010
1.29642
1.4229
1.54938
0.015
1.44398
1.54938
1.65478
0.020
1.55992
1.67586
1.7918
0.025
1.69694
1.82342
1.99206
![Graphical presentation of specific conductance [κ (mS cm−1)] vs. molarity (mol. d m−3) at varying temperatures for SDS in aq. Tartrazine solution.](/content/185/2020/32/4/img/10.1016_j.jksus.2020.04.009-fig3.png)
Graphical presentation of specific conductance [κ (mS cm−1)] vs. molarity (mol. d m−3) at varying temperatures for SDS in aq. Tartrazine solution.
The slope ratio method was used to determine the fraction of counter ions bound to micelles conductometrically. In this method, the ratio of the pre- and post- miceller slopes S1 and S2, respectively, of the specific conductance versus concentration plots are considered. The ratio of S2 / S1 (=β) is taken as the fraction of the counter ion dissociated from the micelle so that the fraction bound is given as α = (1 - S2 / S1). β and α represent the surfactant counter ion dissociation and association constants, respectively. The values of β, α, and Λ0 are given in Table 2 together with the cmc values determined by conductivity method.
298.15 K
303.15 K
313.15 K
Λo (mS cm2 mol−1)
0.327
0.360
0.396
α
0.7123
0.6500
0.3648
β
0.2878
0.3500
0.351
Amin (nm2)
0.0189
0.0194
0.0211
Πcmc (dyne cm−1)
32.5
27.4
12.2
Γmax (mol cm−2)
8.76 × 10⁻⁵
8.56 × 10⁻⁵
7.87 × 10⁻⁵
cmca (mol dm−3)
8.12 × 10⁻³
8.51 × 10⁻³
9.10 × 10⁻³
cmcb (mol dm−3)
8.14 × 10⁻³
8.49 × 10⁻³
8.89 × 10⁻³
The values of molar conductance at infinite dilution, in the pre-micellar region, are obtained by using Onsager equation (Paul et al., 1998) by a graphical method
In other words, the value of counterion dissociation, β, increases with temperature. This is in close agreement with the variation of β and α with temperature also reported elsewhere (Paul et al., 1998). Table 1 shows that the molar conductivity, Λ, decreases with increase in concentration of surfactant, while it shows reverse trend with temperature. The Λ0 values can be used to estimate the limiting molar ionic conductivity for sodium dodecyl sulphate, DS− (λo DS−) ions by subtracting the value of λ0 Na+ in water (=50.1 S cm2 mol−1). The values of λo DS− thus obtained at 298.15, 303.15 and 313.15 K is 276.8 S cm2 mol−1.
Surface tension values have been shown as a function of log [SDS], are plotted in Fig. 2. It is observed from the surface tension plot that a steep, almost linear, decline occurs and after adding more concentration of surfactant an abrupt leveling at the critical micelle concentration (cmc) is observed. The air/water interface is assumed to be saturated with surfactant monomers from the steep descent (Voorst and Vader, 1960; Perez et al., 1998). There are clear breaks in γ vs log[SDS] plots (Fig. 2), which correspond to the cmc of the surfactant in presence of tartrazine dye. From Table 2, the cmc values of SDS in presence of tartrazine are observed to increase with temperature and in the presence of dye. This increase in cmc in the presence of tartrazine may be attributed to the anionic-anionic repulsions, as the tartrazine in aqueous solution is itself negatively charged and surfactant SDS is also anionic. Here we can conclude that the tartrazine acts as a structure breaker in the aqueous solution with SDS. On comparing the cmc values obtained by the surface tension method and conductivity method, it is observed that the cmc values from surface tension method are lower. It is already reported that cmc determination is about 7–20% lower from surface tension method (Bazito and El Seoud, 2002; Ray et al. 2009). The cmc values calculated by the surface tension as well as conductance measurements are given and compared in Table 2. It may be mentioned here that using Gibbs adsorption equation maximum surface excess concentrations, Γmax values can be calculated at the air–liquid interface. This helps to assign the excess of solute per unit area of the surface over what would be presented if the bulk concentration prevailed all the way to the surface. It has a unit of mol. cm−1.![surface tension (γ) as a function of log [SDS] for aq. Tartrazine + SDS at Different temperatures.](/content/185/2020/32/4/img/10.1016_j.jksus.2020.04.009-fig4.png)
surface tension (γ) as a function of log [SDS] for aq. Tartrazine + SDS at Different temperatures.
where γ cmc is the surface tension at cmc and c is the molarity in terms of mold m−3 (d γ cmc / dlnc)T represents the slop of the surface tension, γ versus log c plot below the cmc at constant temperature. The surface tension values are dependent upon the nature of solutes differing in their structure, when surfactants are solutes the surface tension decreases and once, a minimum is reached, no more change in surface tension occurs, showing constant value in Table 1. Above the cmc, surface tension shows no change with the concentration, hence, surface tension values at the cmc have been used to calculate effectiveness as surface pressure at cmc which is an index of reduction in surface tension as given below:
where γ 0 is the surface tension measured for solvent at different temperatures and γ cmc is the surface tension at cmc and are included in Table 2. The effectiveness of a surface active molecule in reducing the surface tension at the cmc measured as surface pressure (πcmc). It is evident from the Table 2 that πcmc shows a decreases with the increase in temperature. This trend is also followed by the α with respect to the temperature. On the other hand decrease in πcmc with respect to temperature can also be ascribed to the micelle formation. So, leads to a shift of surfactant molecules from the air–liquid interface to the bulk, thereby, resulting in lower πcmc values with increase in temperature. The Γmax values for the present system at 298.15, 303.15 and 313.15 K are given in Table 2. The Table 2 reveals that the Γmax values decreases with an increase of temperature. This is attributed to the existence of the increase of temperature making the surfactant more favourable for the solvent mixture, thereby creating a shift of surfactant agents from the air–liquid interface toward the bulk or may be enunciated for the reason to enhance molecular thermal collision at higher degree of temperature.
The other important parameter called as minimum area per molecule Amin (nm2) at the liquid – air interface has been calculated using the relationship:
where, N represents the Avogadro’s number. The increase in the minimum area per molecule, Amin, on elevation of temperature may be again due to the increased thermal agitation at higher temperature. Further, Γmax and Amin values are found to be inversely dependent, as expected. This is in good agreement with the reported variations of Γmax and Amin with temperature for sodium N- dodecyl sarcosinate, an amino acid surfactant, in aqueous medium.
The standard Gibbs free energies of micellization ΔGomic were calculated using the relationship, 5:
where, Xcmc is the cmc value expressed in mole fraction.
The entropy (ΔSomic) and enthalpy (ΔGomic) of micellization were calculated from the equations:
The main thermodynamic characters calculated from the given data including of ΔG°mic, ΔS°mic, and ΔH°mic are given in Table 3. As it is known that the sign of the numerical values of these parameters matters to define the feasibility of a physical or chemical process. Herein, the negative value of ΔGomic is an indicative of the fact that micellization is a thermodynamically favoured process. The escalation in temperature in the presence of co-solvent (tartrazine) for the target solution has shown direct impact on the micellization in a direct proportional way. The solvation of the surfactant hydrophilic molecular site at increased temperature can be related with the increase in the free energy of micellization, ΔG°mic, on increasing the temperature. From the data it is clear that the ΔG°mic becomes less negative or micellization becomes less feasible. The ΔH0m vs. T plot gives a slope (∂ΔH0m /∂T)P) called heat capacity at constant pressure of the surfactant upon micellization (ΔC0P,mic.). The calculated value of ΔC0P,mic. in this study is 4.29 × 10⁻⁴ kJ mol−1 K−1. A negative value of ΔC0P,mic. indicates release of water molecules from the hydrophobic tails of surfactant molecules as micelles are formed. The system under investigation shows positive value of ΔC0P,mic. which can be attributed to the structure breaking property. Moreover, due to the fact that the tartrazine acts as a structure breaker, that is, destruction of the hydrophobic chain structure of the water molecular system occurs. Also owing to thermal agitation the cmc increases thereby rendering ΔGomic less negative. The higher positive values of change in entropy of micellization ΔSomic for the model system prevail over the low negative numerical values of ΔHomic, that can be the fact behind the micellization process predominantly controlled by the entropy again rather by any other effect. Hence, entropy is the main driving force to achieve this process.
Temperature (K)
298.15
303.15
313.15
ΔGomic (102 KJ / mol)
−2.71
−1.98
−1.55
ΔGoad (105 KJ / mol)
−3.71
−3.20
−1.55
ΔHomic (102 KJ / mol)
−2.10
−1.90
−1.46
ΔC0P,mic (104 KJ / mol K)
4.29
ΔHoad (105 KJ / mol)
−3.71
−3.20
−1.55
ΔSomic (10−2 JK−1 mol−1)
2.33
2.49
2.81
ΔSoad (10−3 JK /mol−1)
8.47
7.46
5.47
From Table 2, it is observed that the cmc values follow a direct relation with temperature. This can be explained on the basis of the assumption that the temperature elevation can result in destruction of the hydrophobic chain structure of the water molecular system. The standard free energy values of adsorption, ΔGoad, at the air – liquid interface were calculated using equation:
where πcmc is in dyne / cm. values of ΔSo ad and ΔHo ad were obtained by using the corresponding Eqs. (6) and (7). The values of ΔGo ad , ΔSo ad and ΔHo ad are given in Table 3. It is evident that ΔGo ad values are lower than ΔGo mic values for the system studied. This is obvious, since in the micelle formation process, the system has to perform work in transforming the monomeric surfactant molecules from the air–liquid interface to the aqueous bulk medium. The ΔH°ad and Δs°ad values suggest that the adsorption process is also controlled by the entropy change rather than an enthalpy change.
3.2 DFT based pre-micellization and post-micellization study
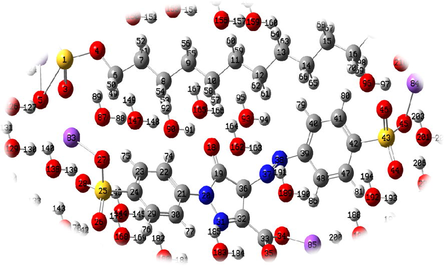
In order to present a comparative description of several properties of free compounds (dye and surfactant) and finally the mixture of the two compounds selected for the study, SDS and TAR were separately optimized followed by the optimization of the mixture (MIX). The three sets of calculations were carried out in water as solvent system. The true minimal energy surface was confirmed by vibrational analyses which showed the absence of imaginary frequency. The respective 3D optimal structures are shown in Fig. 3. Out of different optimization parameters some selected bond lengths have been given in Table 4. The variation in bond-lengths depicts the impact of change in chemical environment. The data indicates the fact that head regions show more variation as compared to the tail regions. Similar explanation can be obtained in case of bond angles and dihedral angles showing the modifications in orientation of different atoms in the mixture. The total energies of the interacting species can be used to find the binding energy (B.E.) of the mixture. B.E is equal to the total energy of MIX subtracted by total energy of SDS and TAR. The calculations have shown the value 0.1 a.u. The distinctive stability of the resultant mixture can also be determined by zero point energy calculation. In the case of TAR, SDS and MIX the calculated zero-point (Z.P.) energies (Kcal/mol) were found as 158.07, 233.99 and 392.52, respectively. This indicates the resultant Z.P.E. of mixture is the summed up values of individual compounds leading to a difference of 0.46.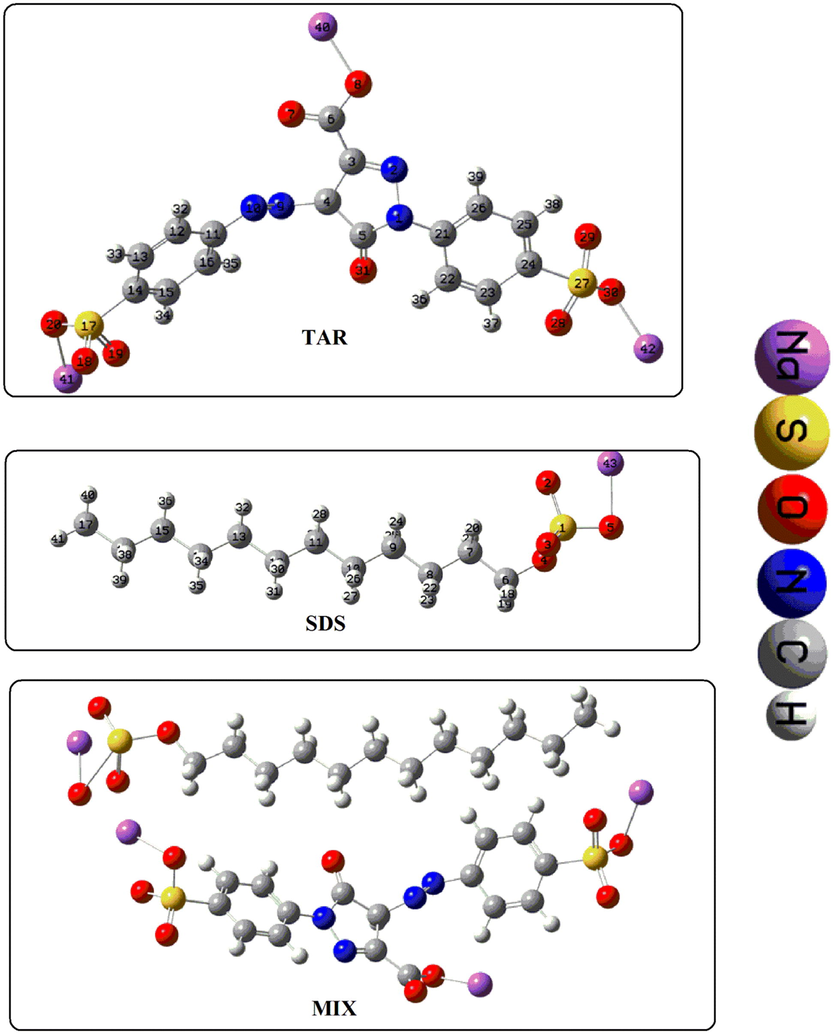
Optimized 3D structures of SDS, tartrazine and SDS-tartrazine binary mixture.
Bond
TAR
(Ǻ)MIX
(Ǻ)Bond
SDS
(Ǻ)MIX
(Ǻ)
O(8)-Na(41)
2.22
2.27
O(5)-Na(43)
2.27
2.22
O(31)=C(5)
1.23
1.24
O(5)-S(1)
1.62
2.78
S(27)=O(28)
1.63
1.60
S(1)=O(2)
1.63
1.61
C(21)-N(1)
1.42
1.42
O(4)-S(1)
1.76
1.77
N(9)=N(10)
1.28
1.27
C(6)-O(4)
1.47
1.48
N(1)-N(2)
1.39
1.42
C(7)-C(8)
1.54
1.54
C–H (Phenyl)
1.08
1.08
C(10)-H(26)
1.10
1.10
In addition to conformational analysis, molecular orbital evaluation can also serve as a speculative tool to find the extent of the existence of molecular interaction of target compounds in their free form as well as mixture by looking at the respective highest occupied molecular orbital (HOMO)-lowest unoccupied molecular orbital (LUMO) gaps shown in Figs. 4 and 5. The HOMO-LUMO gap of mixture corresponds to the gap of TAR. The SDS showing minimum gap out of the three sets of orbitals (Malik and Mir, 2018). This exhibits the impact of dye-surfactant interface to modify this gap to 0.28 a.u. and thus pronouncing more stability in the MIX. The observed energy gaps can be found in good relevance with other chemical reactive parameters that come into play to discuss solute–solute interactions. From the respective charge density plots it is clear that HOMO is oriented towards middle part of sodium locus in tartrazine, while as the same speculation is clear in SDS. In SDS HOMO is also mainly confined to the same spot. The projection of HOMO is thus towards SDS in MIX and LUMO is towards TAR part of the mix. This behaviour can also be implicated by the nature of solvent.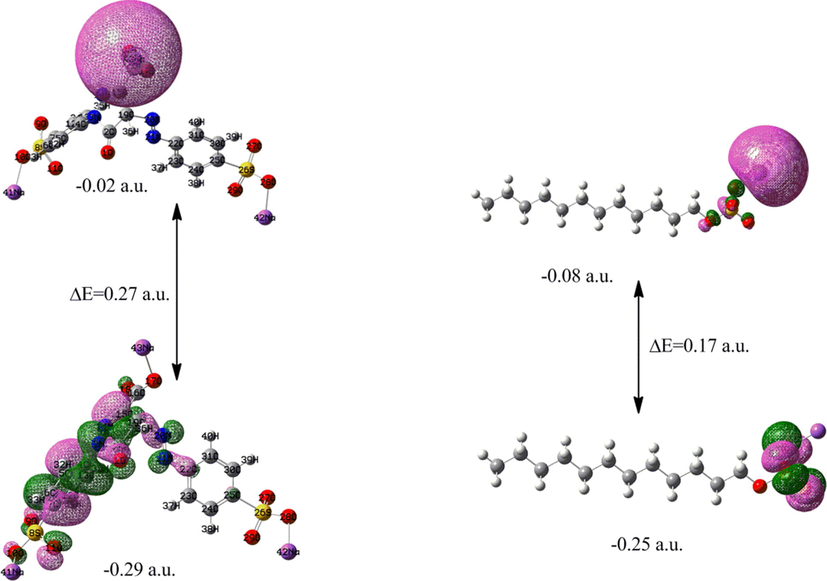
Frontier orbital diagrams of TAR and SDS.
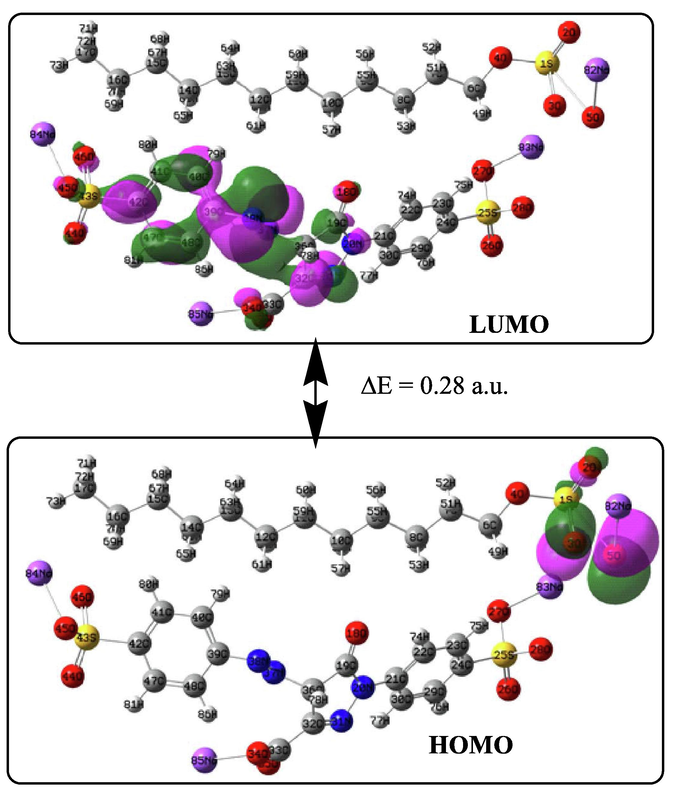
Frontier orbital diagramic representation of MIX.
In order to find the DFT based thermodynamic parameters of the targeted molecular species, Frisch et al. (2010), GaussView 5.0, 0000, Mir and Itoo (2017), Mir and Maurya (2018), Mir et al. (2017), the vibrational spectral analysis was carried out and the respective spectra are shown in Fig. 6. The entire sets of FT-IR calculations were carried out at room temperature. The magnitude of energy has been expressed as Hartree per particle. The results show enthalpy (H) and free energy (G) of TAR to be −0.570 and −0.658, respectively. In the similar order, the properties (H and G) of SDS come out to be −0.115 and-0.167. The summation effect of both the free compounds is clear by the resultant data of H and G in MIX as −0.804 and −0.958, respectively. These significant characters can be used to find the difference among their values in pre- and post-micellization. The calculations over the furnished data shows ΔG to be −0.183 and ΔH as −0.119. By applying the relation of these two factors with ΔS and taking room temperature in consideration the change in entropy can also be calculated by using ΔG = ΔH-TΔS.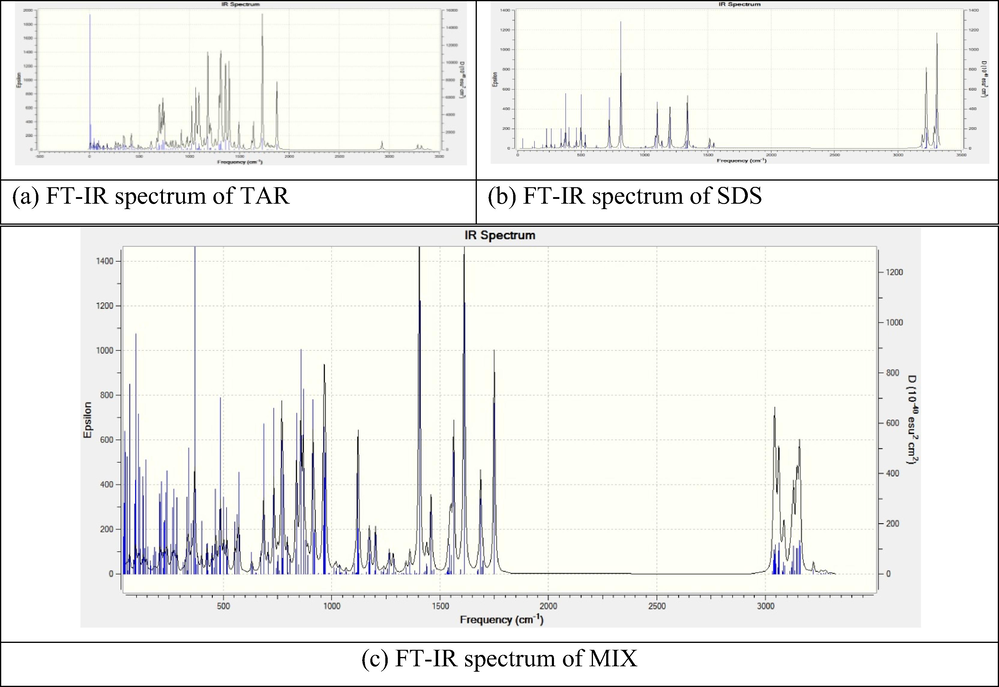
Theoretical FT-IR spectra of the free compounds and the resulting mixture.
Despite, the fact that the DFT based thermodynamic parameters are not so closely in agreement with the experimental results, the change in the respective thermodynamic parameters are significant in elaborating the interaction. On one hand the computed data is restricted to some default commands and the values are mainly confined to room temperature and on the other hand the several ion-ion interactions are ignored in theoretical results Ali et al. (2014), Azum et al. (2018), Waren (2000). The factors like hydration of sodium ions, geometry deformation and dipole–dipole interaction can be suggested as the factors that might be responsible for the disagreement between experimental and theoretical data of thermodynamics.
4 Conclusions
From the convergent theoretical and experimental results it may be remarked that the micellization is favourable under the suggested conditions. Theoretical speculation regarding identification and visualization of binding/interaction spots can thus be easily labeled. The results have shown molecular charge analysis as the real factor behind the presented physiochemical parameters. The study can further be explored in respect of other dyes to infer desirable chemical and physical processes of industrial relevance. The well pronounced agreement between the suggested interactions and the collaborative theoretical approach thus fits to considerable level with the solution behaviour aimed in the subject matter. The area of this study may open interesting aspects of in context to other solvents for a fathomable investigation of solution chemistry.
Declaration of Competing Interest
The authors declare that they have no known competing financial interests or personal relationships that could have appeared to influence the work reported in this paper.
References
- Effect of butylurea on the critical micelle concentration of sodium lauryl sulfate in water at different temperatures. J. Phys. Chem.. 1979;83:2236-2243.
- [Google Scholar]
- Volumetric, viscometric, and refractive index studies of some alfa-amino acids in aqueous tartrazine at different temperatures. Pol. J. Chem.. 2009;83:1353-1363.
- [Google Scholar]
- Study of interaction between cationic surfactants and cresol red dye by electrical conductivity and spectroscopy methods. J. Mol. Liq.. 2014;196:395-403.
- [Google Scholar]
- Unveiling the stimulatory effects of tartrazine on human and bovine serum albumin fibrillogenesis: Spectroscopic and microscopic study. Spectrochim. Acta Part A.. 2017;191:116-124.
- [Google Scholar]
- Synthetic food additive dye “Tartrazine” triggers amorphous aggregation in cationic myoglobin Int. J. Biol. Macro.. 2017;98:277-286.
- [Google Scholar]
- Interaction of antipsychotic drug with novel surfactants: Micellization and binding studies. Chin. J. Chemical Eng.. 2018;26:566-573.
- [Google Scholar]
- Dye-surfactant interactions and their applications. Acc. Chem. Res.. 1991;24:98-103.
- [Google Scholar]
- Bazito, R.C., El Seoud, O.A., 2002. Sugar-based surfactants: Adsorption and micelle formation of sodium methyl 2-acylamido-2-deoxy-6-O-sulfo-D-glucopyranosides. Langmuir. 18, 4362–4366.
- Investigation of polymer/surfactant interactions and their impact on itraconazole solubility and precipitation kinetics for developing spray-dried amorphous solid dispersions. Mol. Pharm.. 2018;15:962-974.
- [Google Scholar]
- Insights into molecular interaction of antitumor drug mitoxantrone with anionic surfactant sodium dodecyl sulfate at different temperatures. J. Surfact. Deterg.. 2018;21:31-41.
- [Google Scholar]
- GAUSSIAN 09 (Revision C.01). Wallingford, CT: Gaussian Inc; 2010.
- GaussView 5.0, Gaussian Inc., Garnegieoffice. Park. Pittsburgh. PA, USA.
- Study of interaction between a cationic surfactant and two anionic azo dyes by ion-selective electrode technique and spectrophotometry. Dyes Lig.. 2007;74:585-589.
- [Google Scholar]
- Synthesis, characterization and DFT aspects of some oxovanadium(IV) and manganese(II) complexes involving dehydroacetic acid and β-diketones. J. Coord. Chem.. 2018;71:104-119.
- [Google Scholar]
- Solubilization and interaction studies of bile salts with surfactants and drugs: a review. Appl. Biochem. Biotechnol.. 2016;179:179-201.
- [Google Scholar]
- Experimental-DFT interface of hydrogen bonding description of 1: 10 methanol-water solution. J. Mol. Liq.. 2017;247:1-5. and references therein
- [Google Scholar]
- Nitric oxide functionalized molybdenum (0) pyrazolone Schiff base complexes: thermal and biochemical study. RSC Adv.. 2018;8:35102-35130.
- [Google Scholar]
- Corrosion resistance and thermal behavior of acetylacetonato-oxoperoxomolybdenum (VI) complex of maltol: experimental and DFT studies. Karbala Int. J. Modern Sci.. 2017;3:212-223.
- [Google Scholar]
- Paul, B.C., Islam, S.S., Ismail, K., 1998. Effect of acetate and propionate co-ions on the micellization of sodium dodecyl sulfate in water. J. Phys. Chem. B.102,7807–7812.
- Surface activity properties at equilibrium of novel gemini cationic amphiphilic compounds from arginine, Bis(Args) Langmuir. 1998;14:2307-2315.
- [Google Scholar]
- Physicochemical studies on the interfacial and bulk behaviors of sodium n-dodecanoyl sarcosinate (SDDS) J. Surfact. Deterg.. 2009;12:131-143.
- [Google Scholar]
- Partitioning of structurally related thiophene derivatives between solvent and micellar media of anionic surfactant sodium dodecyl sulphate. Colloids Surf. A: Physicochem. Eng. Aspects. 2017;512:51-60.
- [Google Scholar]
- A study of the interaction between bromopyrogallol red and bovine serum albumin by spectroscopic methods. Dyes Pig.. 2007;74:665-671.
- [Google Scholar]
- Adsorption of detergents at the liquid-liquid interface. Part 1. Trans. Faraday Soc.. 1960;56:1067-1077.
- [Google Scholar]
- Micellar solubilization of poorly water-soluble drugs: effect of surfactant and solubilizate molecular structure. Drug. Dev. Industrial Pharm.. 2018;44:677-686.
- [Google Scholar]
- A theory of void formation in charge-stabilized colloidal suspensions at low ionic strength. J. Chem. Phys.. 2000;112:4683-4698.
- [Google Scholar]
- Ionization of cationic micelles: effect of the detergent structure. J. Colloid. Interface Sci.. 1980;78:330.
- [Google Scholar]
- Al-Shabib, N. A., Khan, J. M., Malik, A., Alsenaidy, A. M., Alsenaidy, M. A., Husain, F. M., et al. (2018). Negatively charged food additive dye “Allura red” rapidly induces SDS-soluble amyloid fibril in beta-lactoglobulin protein. International Journal of Biological Macromolecules, 107, 1706–1716.
- Markina et al reference may please be replaced by:1 Mir J M & Itoo F A,Density Functionalized Drug-Surfactant Interaction of Aqueous SDS-Tartrazine J Chem. Env. Sci. Appl. 5 (2018) 11.


