

Translate this page into:
Delineation of shallow groundwater potential zones using integrated hydrogeophysical and topographic analyses, western Saudi Arabia
⁎Corresponding author at: Department of Environmental Engineering, Umm Al-Qura University, 21955 Saudi Arabia, Natural Hazards Research Unit, Department of Environmental and Health Research, Umm Al-Qura University, 21955 Saudi Arabia. agothman@uqu.edu.sa (Abdullah Othman)
-
Received: ,
Accepted: ,
This article was originally published by Elsevier and was migrated to Scientific Scholar after the change of Publisher.
Peer review under responsibility of King Saud University.
Abstract
Groundwater potentiality mapping is currently receiving more attention, particularly in arid regions, where natural freshwater resources are limited and scarce and instead costly unconventional methods such as seawater desalination are widely used to satisfy water demands. Water demand in Makkah city is considered a vital task, which receives millions of visitors every year for religious purposes. The present study evaluates the potential zones of groundwater in the southwest Makkah city applying hydrogeophysical modeling approach that integrates geoelectrical resistivity in form of vertical electrical sounding (VES), ground-penetrating radar (GPR), and topographic analyses. VES results indicate five main geoelectric layers: (1) dry wadi-fill deposits with a true resistivity varying from 73 to 650 Ohm.m and average thickness of 3.14 m, (2) partially saturated sands with a resistivity range between 19 and 43 Ohm.m and average thickness of 13 m, (3) water-bearing layer of saturated sands with a resistivity range between 55 and 110 Ohm.m, and average thickness of 52 m, (4) highly fractured diorite rocks with resistivity values ranging from 750 to 1450 Ohm.m and average thickness of 1.5 m, and (5) fresh diorite basement rocks with a resistivity of more than 4000 Ohm.m. Results of GPR profiles support the gained results of the VES technique, and together they are confirmed by the wells data. The integrated results suggest a structural control on the groundwater accumulation and call for a detailed mapping of alluvium-covered faults to provide a high-resolution mapping of groundwater occurrences and ensure environmental sustainability in southwest Makkah city.
Keywords
Groundwater
Sustainability
Sounding
Radar
Extraction
Makkah

1 Introduction
Located in the Saharan-Arabian desert belt, Saudi Arabia (Fig. 1) is a natural water resource-poor country with no surface rivers flowing through its land and limited precipitations (Elkadiri et al., 2016; Abotalib et al., 2019; Abdelmohsen et al., 2020). Instead, the country depends mainly on energy intensive seawater desalination for municipal water supply (Alhassan et al., 2016). However, the dramatic increase in population (MWE, 2014), economic development, and prevalent arid climatic conditions (Othman and Abotalib, 2019) encourage the government to explore for further fresh groundwater resources (Fig. 2).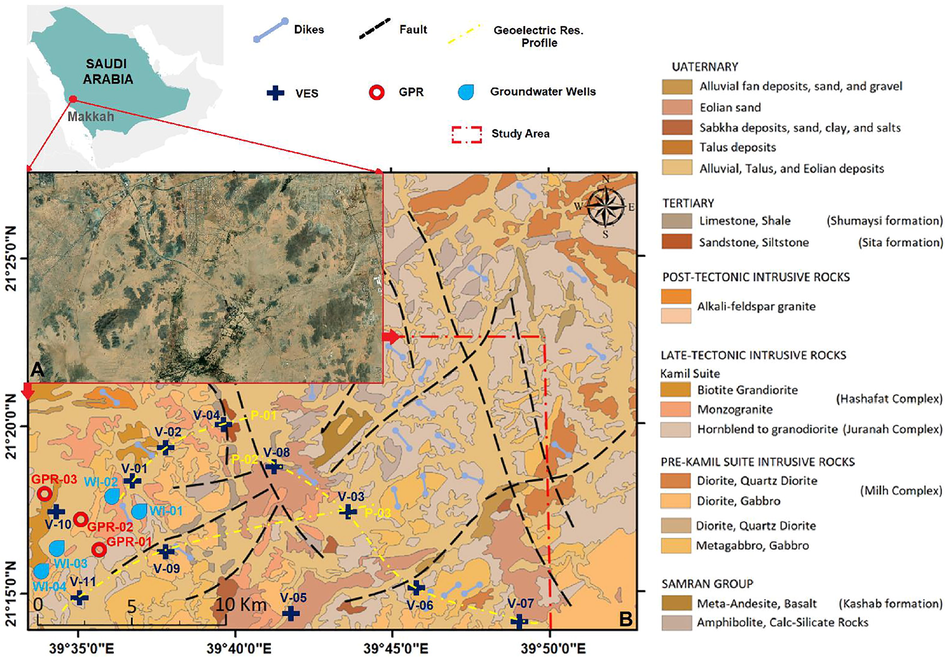
Location map of the study area showing (A) Satellite image of the area that conducted geophysical survey in southwest Makkah, and (B) different geological and structural units in the study area (modified after Moore and Al-Rehaili, 1989).
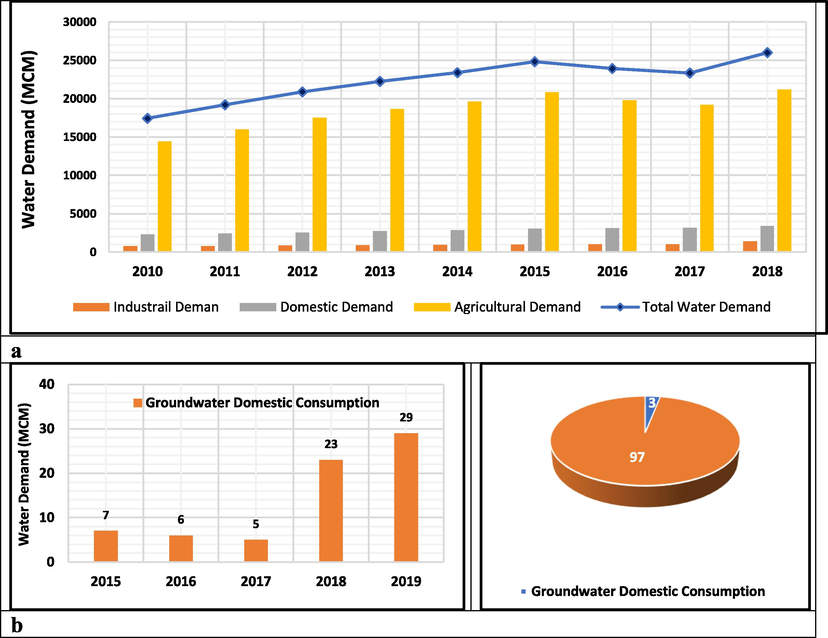
(a) Recorded water demands (in million cubic meters) in Saudi Arabia from 2010 to 2018 (MEWA, 2019). (b) Recorded groundwater domestic consumption (in million cubic meters) in Makkah from 2015 to 2019 (MEWA, 2019).
Presently, agricultural activities depend mainly on groundwater, while industrial and municipal activities are supplied from a combination of groundwater and desalinated seawater (MEWA, 2019). The growth of domestic water demands in Saudi Arabia has also increased drastically during the last decade (from 17 k MCM in 2010 to 26 k MCM in 2018) in response to a steady increase in population. (Fig. 2).
Concerning Makkah region, it depends on groundwater (3% of total domestic consumption) and desalinated water (97 % of total domestic consumption) based on the average consumption between 2016 and 2018 (MEWA, 2019). It is noticeable that the dependence on groundwater for domestic consumption from 2015 to 2019 significantly increased from 7 to 29 MCM, respectively (Fig. 2), which calls for paying more attention to investigating the groundwater potentiality and exploring more groundwater resources around Makkah city.
Additionally, Makkah attracts millions of Muslims worldwide to perform their religious rituals (Hajj and Umrah), leading to an annual mass gathering at a specific time during the Hajj Umrah seasons (Hodges, 2018). It is now well observed that the number of pilgrims and Umrah performers increase every year due to the rapid development in the means of global transportations, as well as the growing population of the Islamic countries. The proposed increase in the number of pilgrims and Umrah performers in the next years, in light of the Saudi Vision 2030, and the current expansion of urbanization to accommodate this expected increase more load on the engineering and environmental planning and necessitate the provision and creation of all means of comfort and conservation of natural resources, sustainability of the fresh water, need and requires all of care of natural water resources.
Climatically, Makkah is characterized by lack of rainfall, higher temperatures, and increased evaporation rates (Fig. 3). All these climatic factors have led to a shortage in the water balance of the city. Makkah depends on renewable groundwater resources, deep groundwater aquifers as natural resources, in addition to seawater desalination to compensate for its water needs (MEWA, 2019).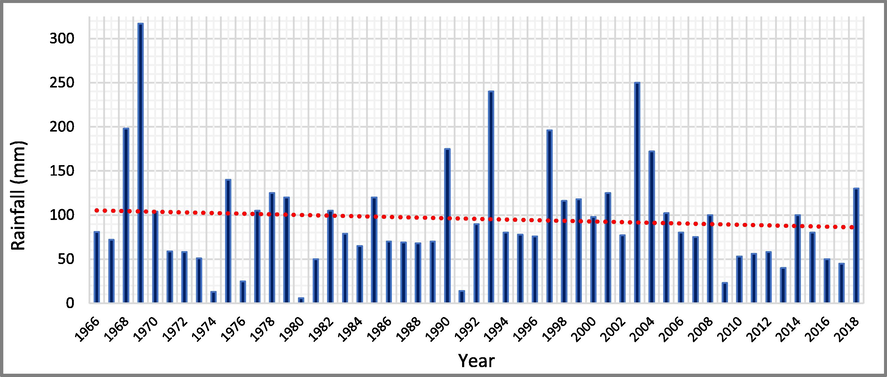
A histogram showing the annual rainfall changes in Makkah, the red dashed line representing the average decreasing trend of rainfall from 1966 to 2018. (modified after Dawod et al., 2014 and Hajj Research Institute meteorological network 2019, Umm Al-Qura University).
Geologically, the Makkah region occupies a part of the western Arabian Shield, mainly composed of Neoproterozoic crystalline rocks. These rocks contain different types of volcanic and volcaniclastic rocks, together with intrusive granodiorite, diorite, and granites. These rocks are overlain by Tertiary and Quaternary lavas and recent alluvium sediments of unconsolidated sand and gravels of more than 20 m thick (Greenwood et al., 1976; Moore and Al-Rehaili, 1989; Al-Solami et al., 2006; Abdul Aziz et al., 2007; Othman et al., 2020).
The dominant structural trend is northeast to the north-northeast. It reflects three major tectonics phases, including Precambrian deformation regarding the Pan African Orogeny and Tertiary faulting regarding the Red Sea tectonics (Moore and Al-Rehaili, 1989; Fig. 1).
Topographically, there are five upstream sub-basins of Wadi Uranah in Makkah region (Fig. 4). (1) Al-Selouly basin western Makkah, (2) Ibrahim valley basin, which extends northeast of Makkah, (3) Muhasser basin, (4) Al-Sharaea basin, (5) Nu’man basin that is considered as one of the most important valleys that collect the rainfall over Makkah and in the upper stream of the southern mountains in Taif city that is characterized by somewhat larger rainfall quantities than Makkah (Muharji, and Abu-Ruzizah, 1997).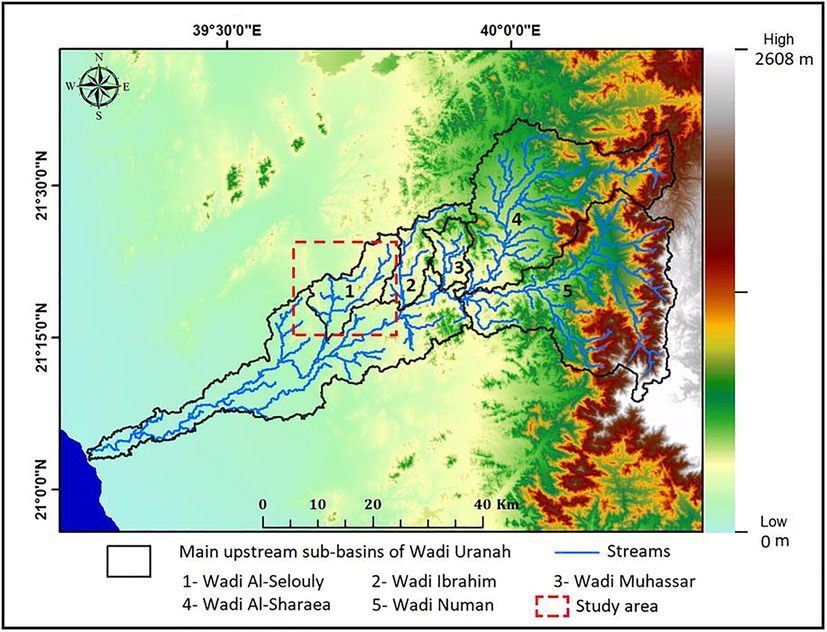
The sub-basins of Wadi Uranah, and the main valleys on Makkah with respect to the study area.
Ibrahim valley starts from the highest elevation in Makkah in the south of Al-Nour Mountain with a height of 850 m. It passes through the central area of Makkah city to Al-Misfalah area, Al-Kakiah, and to Al-Lieth Road (south of Makkah). In the southwest portion of this valley, it is also known as Al-Selouly valley. These two valleys blend together in one valley until it reaches the Red Sea in Jeddah city (Fig. 4). Ibrahim valley's groundwater resources include the stored groundwater in the shallow alluvium deposits and the intermediate deep aquifer, due to periodic rainfall events over the highlands to the east of the Ibrahim valley (Osra, 2001).
Due to the sporadic agricultural activities in the southwest of Makkah, four wells are utilized for groundwater extraction in the study area. The measured depth to groundwater level in these wells ranges from 9 to 15 m and the pumping rates range from 36 to 683 m3/day, which is highly affected by the topographical regime of the surrounding areas (Osra, 2001).
Electrical resistivity of the soil/rock can be utilized to determine the spatial and temporal variations of soil properties (e.g. water saturation, salinity range and/or fluid composition). The electrical resistivity method is non-destructive and sensitive to water content and degree of saturation. It is considered a very effective tool for describing and quantifying the subsurface properties without the need for digging in most cases (Scollar et al., 1990). It has been traditionally applied in various problems such as exploration of groundwater, assessment of landfill sites, and delineation of the transfer of solutions by recognizing areas of excessive compaction and soil horizon thickness, in addition to assessing the soil geotechnical properties (Ahmed and Sulaiman, 2001; El-Saadawy et al., 2020).
Geoelectrical methods in form of Vertical Electrical Sounding (VES) that was applied in the current research to study and investigate the vertical variation of resistivity with depth, are also widely utilized in groundwater evaluation, in addition to examining the role of geological structures in controlling groundwater flow in fractured rocks (Mohamed et al., 2015; Morsy and Othman, 2020). The sensitivity of groundwater aquifers is strongly related to the heterogeneity of the clay cap and salinity. Therefore, the geoelectrical method can map both low and high resistive formations and thus provide a valuable tool for groundwater potentiality studies (Chistensen and Sørensen 1998; Sørensen et al. 2005; Batayneh, 2011). In addition to, applying multi-influencing factors and analytic hierarchy process for delineation of groundwater potential zone (Sutradhar et al., 2021; Bera, et al., 2020).
Ground Penetrating Radar (GPR), is considered as a high-resolution geophysical technique for scanning shallow subsurface stratigraphy and associated structures using emitted and reflected electromagnetic (EM) waves in the frequency band of 10–1000 MHz (Sharma, 2007). GPR uses EM pulses that propagate into the subsurface using a transmitting antenna that is situated on the ground surface. On the other hand, a receiving antenna receives the reflected up EM waves to the ground surface when the transmitted pulse meets a subsurface interface across which an electromagnetic impedance contrast was observed (Morey, 1974, Annan and Davis 1976). These signals are amplified and processed to provide a GPR profile record (Stewart and Unterberger 1976, Coon et al., 1981).
Through this research, a hydro-geophysical modeling approach including geoelectric resistivity and GPR surveys, supported by the groundwater wells and topographic analyses were implemented. By conducting the geophysical survey associated with the topographic analysis throughout the study area, the groundwater aquifer in the southwest of Makkah has been evaluated effectively to perform the preliminary groundwater storage capacity to be a baseline for the supply of domestic and agricultural activities in Makkah.
2 Materials and methods
The methodology of the current research was divided into three main ordered stages (Fig. 5). The first stage focused on the review of the geological setting of the study area, followed by investigating the topographical conditions in the study area through constructing 2D and 3D maps to determine the most potential zones for groundwater extraction, and the final stage was formulated by conducting geophysical measurements (Geoelectric resistivity sounding and GPR techniques) to interpret the aquifers in the study area quantitatively.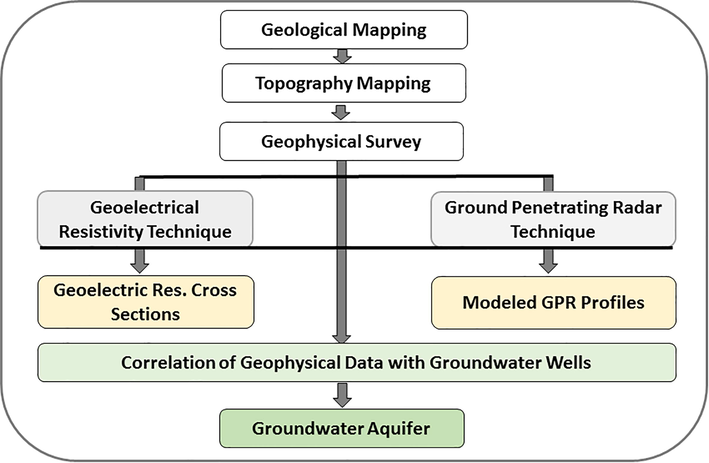
The applied methodology for evaluation of groundwater resources in southwest of Makkah.
A geoelectrical resistivity sounding and GPR measurements were conducted in the southwest of Makkah to evaluate the groundwater aquifer, in the form of 11 direct currents (dc) electrical soundings and a total of 1012 m of GPR profiles (Fig. 1).
A block diagram was prepared from two 2D contour maps for the study area by integrating the topographical sheets (by a discrete resolution of about 30 × 30 m) at the top and the depth contour map of the groundwater-bearing formation for the study area, to interrelate the topographical factor with the upper surface of the groundwater aquifer and the potential areas for groundwater extraction in southwest Makkah city. The topographic sheet was prepared by applying TCX Converter (Marpen, 2019) on the Google Earth (geographic information program, 2004), the accuracy of the topographic sheets that extracted from Google earth is closer to the SRTM 30 than ASTER 30 (Hasan, 2019).
2.1 Geoelectric resistivity technique
The used geoelectric resistivity instrument in the current study is SYSCAL-R2 (IRIS, France). The field acquisition parameters can be summarized as vertical electrical sounding with Schlumberger array with IRIS specific stainless steel electrodes of 60 cm length, where the number of acquired points per decade was 6, stacking of the field readings ranged between 12 and 16 times to increase the accuracy of the readings. The maximum standard deviation for each reading was 3%, surface resistance did not exceed 30 KOhm and maximum current electrode and potential spacing were 300, and 40 consequently. The geoelectric survey was collected during March 2017, in which the temperature reaches up to 41 °C during the daytime. That caused the increase of surface resistance of the ground surface to values over 120 kOhm, and is overcame by using long stainless steel electrodes (60 cm) inserted to overcome the extremely dry surface deposits, in addition to adding fresh water and saline solutions to improve the connectivity of penetrated electric current. The geoelectric resistivity data have been interpreted qualitatively as well as quantitatively. The qualitative interpretation was formalized by curve type distribution to determine the studied area's homogeneity or heterogeneity. Subsequently, resistivity contour maps have been created at different current electrode spacing to anatomize the subsurface succession at different depth levels. Two simultaneous steps were implemented through the quantitative interpretation of the resistivity data: In the first step, an initial resistivity model was deduced using the previous geological successions, and in the second step, this deduced model was introduced into a computerized iterative modeling technique to calculate the final earth resistivity model. The spatial distribution of the calculated true resistivities and thicknesses have been demonstrated via contour maps and 2D resistivity cross-sections. Moreover, an automatic iterative approach was used to refine the preliminary initial model obtained in the first step by applying “IX1D” (IX1D v3, Version 1.11) to calculate the final earth resistivity model. The justification of the calculated final model was controlled by calculating the Root-Mean-Square error (RMS-error) between the observed and calculated resistivity values. The RMS Error between the assumed model and the field data ranged between 4.10 and 12.04% of an average 7.40%.
2.2 Ground penetrating radar technique
A total of 3 GPR profiles were acquired using 100 MHz antennae of the bistatic mode of the model GSSI TerraSIRch SIR® System-3000. Single-channel GPR system of total length 1012 m and distributed on the studied site adjacent to the conducted vertical electrical sounding and groundwater wells to adopt and correlate the groundwater-bearing formation (Fig. 1).
3 Results
3.1 Analysis of geoelectrical data
The behavior and the main trends of the conducted VES's (Fig. 6a), are presented approximately in a similar way, giving a preliminary indication of nearly homogeneity of the subsurface geological sequence throughout the study area. The conducted VES's can be grouped according to the similar behavior of the VES's, into two groups HA type for VES’s 1, 2, 4 6. 8, 9, 10, and 11, and KH type for VES's 3, 5 and 7.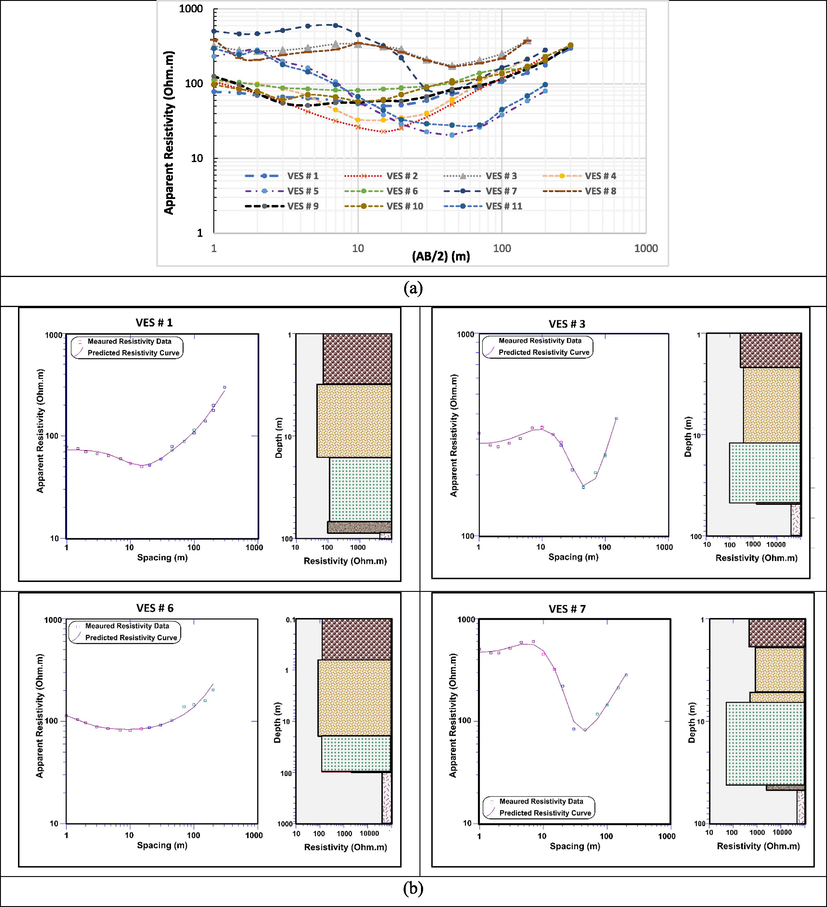
(a) Conducted VES's at the study area. (b) Samples of geoelectrical resistivity models of VES’s 1, 3, 6 and 7.
The collected data of VES’s were processed using the one-point overlap shift using software “IX1D” according to the major trend of resistivity curves to minimize RMS error and to overcome the ambiguities. Five major geoelectric layers can represent the geoelectrical resistivity subsurface model. (1) The topmost layer shows a true resistivity of 73–650 Ohm.m and 3.14 m thickness that corresponds to wadi fill deposits and is composed of dry deposits of friable sand and silt. (2) The second layer indicates a true resistivity ranging from 19 to 43 Ohm.m and 13.04 m thickness that corresponds to partially wetted silty sand deposits. (3) The third layer attains a true resistivity of 55–110 Ohm.m and 51.99 m thickness corresponds to groundwater aquifer of fully saturated silty sand deposits. (4) The fourth layer with a true resistivity of 750–1450 Ohm.m and 1.5 m thickness in average corresponds to highly fractured basement rocks, while the (5) fifth layer shows a true resistivity larger than 4000 Ohm.m and extends to the maximum penetratable depth of the VES that corresponds to pure diorite basement rocks.
A total of three geoelectric resistivity cross-sections were created from individual 1D sounding interpretations, to approximate and interpolate a continuous vertical subsurface distribution of resistivity with depth taking into consideration the topographic information (Fig. 6b). All the created cross-sections reveal the same subsurface succession in the form of five layers represented by the surface layer of dry wadi fill deposits of an average thickness 2.6 m. The second layer of partially saturated deposits of average thickness 10.6 m. The third layer of groundwater aquifer of an average thickness 52.1 m. The fourth layer of highly fractured basement rocks of an average thickness of 1.5 m, and the fifth layer of compact basement rocks of an average depth of 66.8 m. It is clearly observed the presence of structural elements (inferred faulting) that affect the studied site, as shown in profile P-01, P-02 and P-03, due to the sharp decrease or increase of the depth levels of groundwater-bearing formation between conducted VES’s (Fig. 7).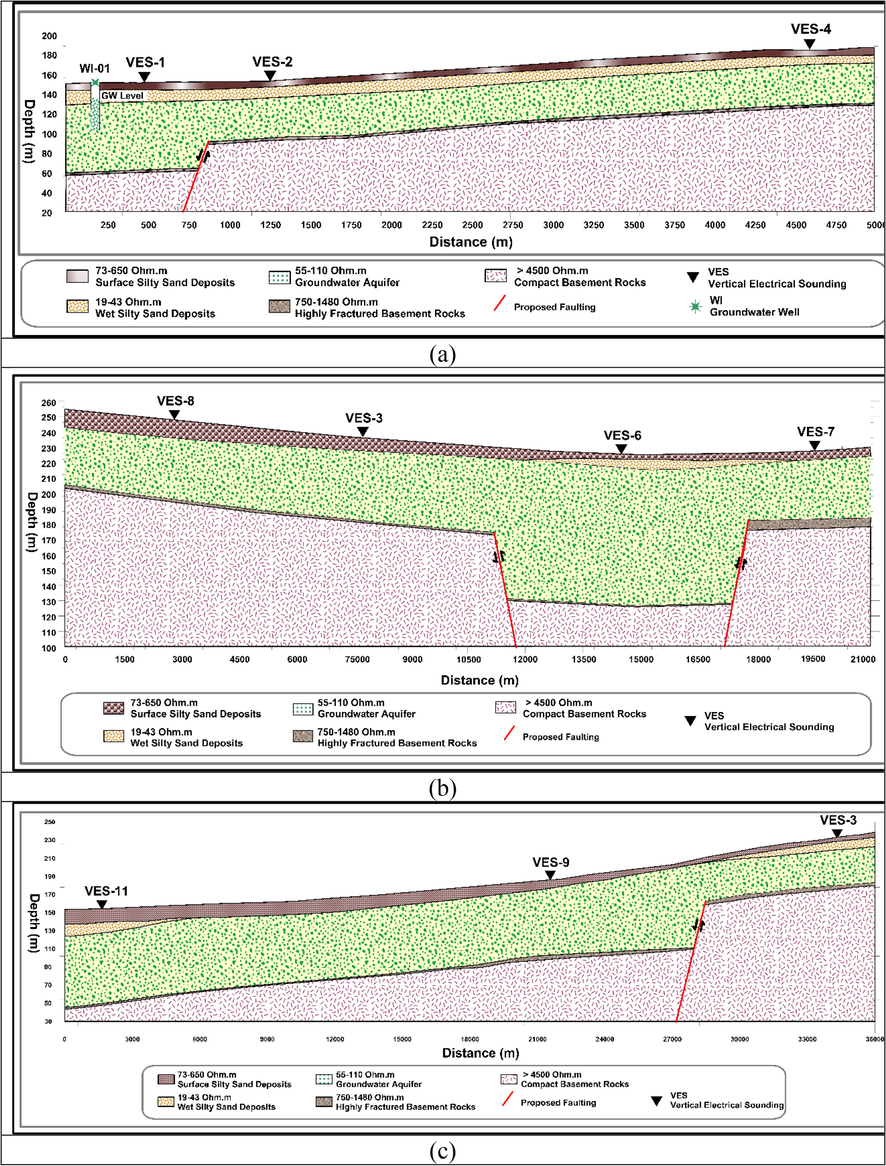
Geoelectric resistivity cross section (a) P-01, that passing with VES's 1, 2, and 4, (b) P-02, that passing with VES's 8, 3, 6, and 7, and (c) P-03, that passing with VES's 11, 9, and 3.
3.2 Analysis of the GPR data
The conducted GPR profiles were located at the northwestern part of the study area, with a total length of 1012 m (Fig. 1). The acquired GPR profiles reflect in general three subsurface layering sequence. The first topmost surface layer, which is equivalent to dry wadi fill deposits (silty sand deposits), reaches a thickness of 3.0–3.6 m. The second layer corresponds to partially wetted silty sand deposits of ranging between 5.5 and 6.2 m thick, while, the third layer corresponds to highly saturated silty sand deposits (water-bearing horizon) with a depth range of 8.5–9.2 m. The attenuation of the EM waves through the later layer was very high and extended to the profile's maximum penetration depth (i.e. 21 m) (Fig. 8). In addition, The GPR data was validated by groundwater borehole data and clarified the depth to the static level of groundwater table (Fig. 8)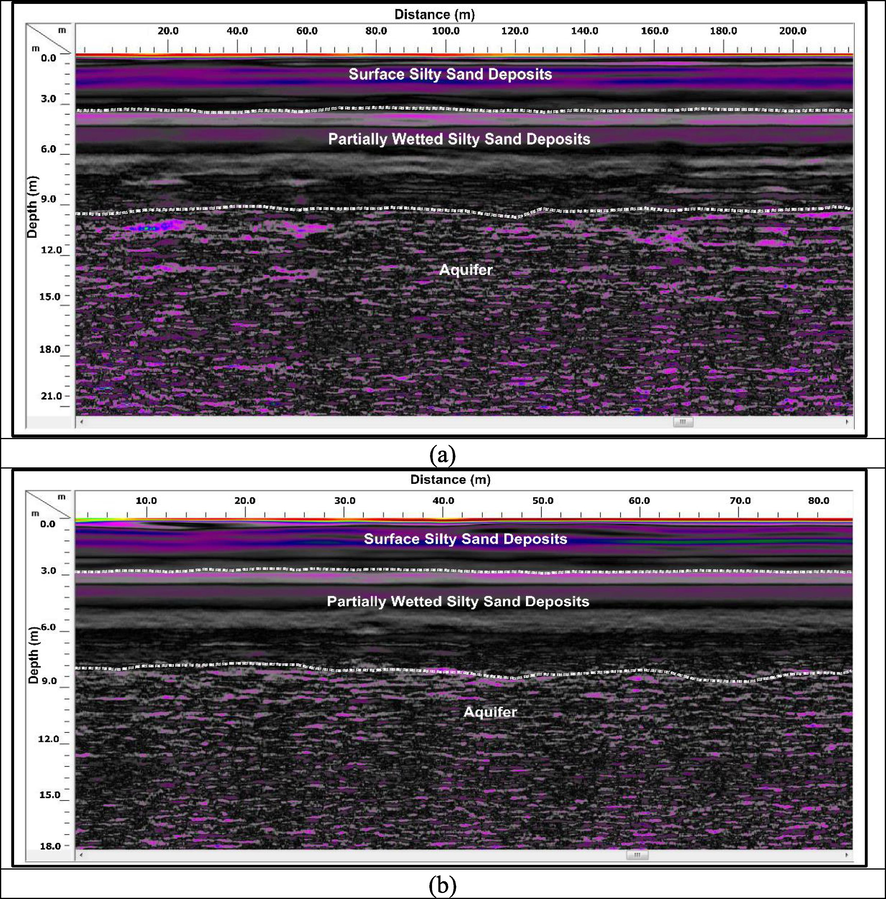
Samples of GPR profiles in the studied site (a) P-01, and (b) P-02.
3.3 Groundwater borehole data
There are four groundwater wells, are distributed and concentrated at the western part of the study area. These groundwater wells were used for agricultural purposes, by a total depths of about 40 m for the four wells, while the static groundwater level ranged between 9 and 17 m as shown in Fig. 9.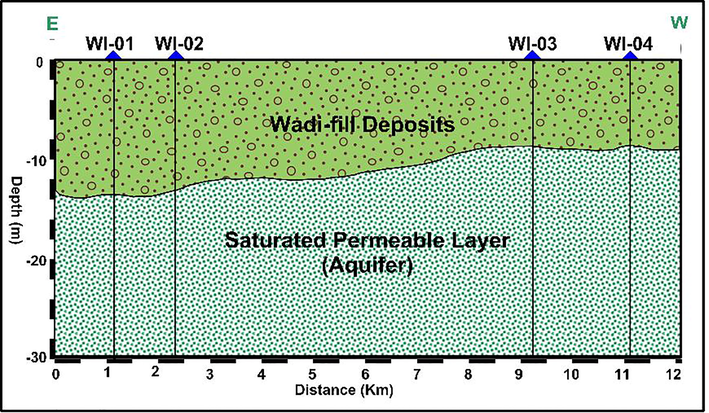
Agricultural groundwater wells distributed in the west of the study area.
4 Discussion
The integration of geoelectric resistivity and GPR survey on southwest Makkah city, indicates a reasonable agreement in the attained results of the water saturated zones and its related parameters, confirmed by the gathered data of groundwater wells.
The investigation of the constructed cross sections of conducted VES’s showing clearly inferred structural elements that can affect the study area as clarified in between VES-1 and VES-2, around VES-6 which surrounded by graben faulting system, and between VES-9 and VES-3 (Fig. 7), rather than representing possible erosional fluvial channels due to the abrupt increase or decrease of the water-bearing formations.
In order to benefit from the application of remote sensing in groundwater potentiality and dynamics (Rateb and Abotalib, 2020), a block diagram was constructed for the study area to correlate the depth to groundwater-bearing zones to the surface topography (Fig. 10).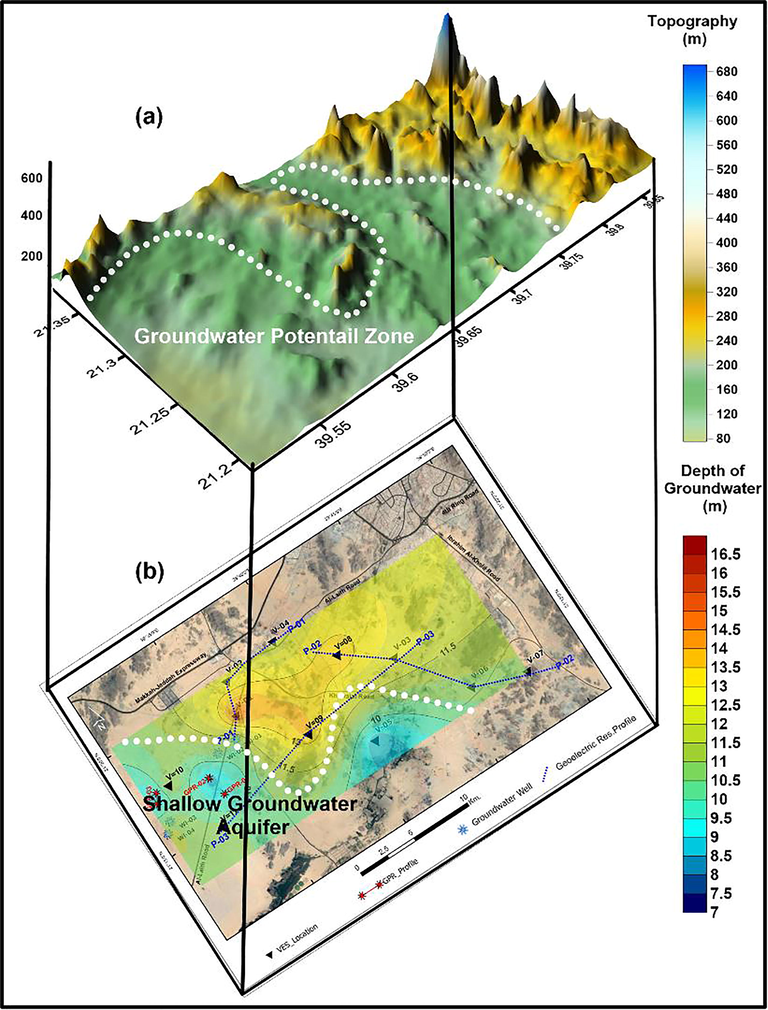
Block diagram of the most potential zone for groundwater extraction at southwest of Makkah, (a) showing the 3D topographic sheet of the study area, and (b) showing the contour map of the depth to the groundwater bearing formation in the study area.
Inspection of the block diagram between topographic model, in light of the location of the measured VES and GPR profiles suggests that groundwater accumulation are localized in faulted-bounded depressions and wadis in southwest Makkah city. The inferred faults accumulated groundwater resulting in elevated water table and high groundwater potentiality. Such control is widely reported from the Arabian-Nubian Shield (Mohamed et al., 2015; Hussien et al., 2017; Yousif et al., 2020). The Neoproterozoic shear zones, as well as the Neogene faulting associated with the opening of the Red Sea (Sultan et al., 2008; Mohamed et al., 2015), can act as a channel network that facilitate groundwater flow and conversely can act as barrier that impede the flow and results in accumulation of groundwater upslope high-angle faults (Mohamed et al., 2015; Khalil et al., 2021). More detailed 2D geoelectrical and GPR surveys are required to better understand the control of faults buried under the surficial alluvium deposits in the main valleys southwest Makkah city and to provide a high-resolution mapping of the water-bearing horizons in these locations (Attwa et al., 2021).
Both Geoelectric measurements and GPR surveys were validated using borehole data extracted from the available four groundwater wells in the study area, which provide an accurate subsurface image, and representing the significance of hydro-geophysical results, and their conformity with the well data (lithology, observed hydraulic head of groundwater, resistivity).
5 Summary and conclusions
A total of eleven geoelectrical resistivity soundings and GPR survey were conducted in southwest Makkah city, Saudi Arabia, with the support of background geologic setting and topographical mapping, to examine groundwater potentiality in the study area. The results of the prepared litho-resistivity cross-sections reveal the presence of five main distinctive layers; (1) surface deposits of dry wadi fill deposits with average thickness 2.6 m, (2) the second layer of partially saturated deposits of average thickness 10.6 m, (3) a third layer of groundwater aquifer of an average thickness 52.1 m, (4) a fourth layer of intensively fractured basement rocks with an average thickness of 1.5 m, and (5) the fifth layer of compact basement rocks of an average depth of 66.8 m. The static depth level of groundwater aquifer as depicted by geophysical survey was confirmed by the groundwater wells at the west of the study area.
A block diagram for the study area was prepared to perform the integration of the topographical situation and the depth to the groundwater-bearing formation, which indicated a significant control of subsurface structural elements (inferred faults), underlined surface alluvium, which impacted the regime of groundwater accumulation in the study area. Further geophysical measurements are necessary to comprehend the structural control of groundwater flow in southwest Makkah city.
The utilization and integration of the hydro-geophysical exploration techniques is a very valuable methods for exploring the potential areas of groundwater resources, especially in the erosional fluvial environments that bottomed by basement rocks, where the geoelectrical and GPR techniques were easily adopted for acquisition and interpretation, in addition the topographical situation can be integrated with derived models to optimize the most suitable sites for groundwater extraction, especially in valleys in western Saudi Arabia.
Acknowledgment
The authors are grateful for Umm Al-Qura University that provides all facilities to carry out the field survey.
Funding
This research did not receive any specific grant from funding agencies in the public, commercial, or not-for-profit sectors.
Declaration of Competing Interest
The authors declare that they have no known competing financial interests or personal relationships that could have appeared to influence the work reported in this paper.
References
- What can the GRACE seasonal cycle tell us about lake-aquifer interactions? Earth Sci. Rev.. 2020;211:103392.
- [CrossRef] [Google Scholar]
- Study of baseline data regarding solid waste management in the holy city of Makkah during Hajj. In: The Custodian of the Two Holy Mosques Institute of the Hajj Research (Unpunished Report). 2007.
- [Google Scholar]
- Groundwater dynamics in fossil fractured carbonate aquifers in Eastern Arabian Peninsula: A preliminary investigation. J. Hydrol.. 2019;571:460-470.
- [Google Scholar]
- Evaluation of groundwater and soil pollution in a landfill area using electrical resistivity imaging survey. Environ. Manage.. 2001;28(5):655-663.
- [Google Scholar]
- Engineering geological mapping of the holy city of Makkah Al Mukarramah, Saudi. Arabia 2006 IAEG2006 Paper number 552
- [Google Scholar]
- Alhassan, A.A., McCluskey A., Alfaris A., Strzepek K., 2016. Scenario Based Regional Water Supply and Demand Model: Saudi Arabia as a Case Study, International Journal of Environmental Science and Development, Vol. 7, No. 1, January 2016. DOI: 10.7763/IJESD, 2016.V7.739.
- Towards an integrated and sustainable water resources management in structurally-controlled watersheds in desert environments using geophysical and remote sensing methods. Sustainability. 2021;13(4004):17.
- [Google Scholar]
- Hydrogeophysical Investigation of Groundwater Potential in the Southern Amman District, Central Jordan. Arab. J. Sci. Eng.. 2011;36(1):89-96.
- [CrossRef] [Google Scholar]
- Delineation of groundwater potential zones in Karha river basin, Maharashtra, India, using AHP and geospatial techniques. Arab. J. Geosci.. 2020;13:693.
- [CrossRef] [Google Scholar]
- Surface and borehole electric and electromagnetic methods for hydrogeophysical investigations. Europe. J. Environ. Eng. Geophys.. 1998;3(1):75-90.
- [Google Scholar]
- Experimental Uses of Short Pulse Radar in Coal Seams. Geophysics. 1981;46(8):1163-1168.
- [Google Scholar]
- Projected impacts of land use and road network changes on increasing flood hazards using a 4D GIS: A case study in Makkah metropolitan area, Saudi Arabia. Arab. J. Geosci.. 2014;2014(7):1139-1156.
- [CrossRef] [Google Scholar]
- Development of a coupled spatiotemporal algal bloom model for coastal areas: A remote sensing and data mining-based approach. IEEE J. Sel. Top. Appl. Earth Obs. Remote Sens.. 2016;9(11):5159-5171.
- [Google Scholar]
- Modeling flash floods and induced recharge into alluvial aquifers using multi-temporal remote sensing and electrical resistivity imaging. Sustainability. 2020;12(23):10204.
- [Google Scholar]
- Late Proterozoic cratonization in southwestern Saudi Arabia. Royal Soc. London Philos. Trans. Series A. 1976;280:517-527.
- [Google Scholar]
- Hasan, R.H., 2019. Evaluation of the Accuracy of Digital Elevation Model Produced from Different Open Source Data, Journal of Engineering, www.joe.uobaghdad.edu.iq: journal homepage Number 8, Volume 25, August 2019.
- Reclaiming “Allahu Akbar” from Semantic Pejoration. Anthropology News. 2018;59(4):e267-e272.
- [Google Scholar]
- An integrated approach for identification of potential aquifer zones in structurally controlled terrain: Wadi Qena basin. Egypt. Catena. 2017;149:73-85.
- [Google Scholar]
- Groundwater Mixing in Shallow Aquifers Stressed by Land Cover/Land Use Changes Under Hyper-arid conditions. J. Hydrol.. 2021;598:126245.
- [CrossRef] [Google Scholar]
- Marpen, R. 2019. TCX Converter V.2.0.9. Quick user manual.
- Structural controls on groundwater flow in basement terrains: geophysical, remote sensing, and field investigations in Sinai. Surv. Geophys.. 2015;36(5):717-742.
- [Google Scholar]
- Moore, T.A. Al-Rehaili, M.H. 1989. Geologic map of the Makkah quadrangle, sheet 21D. Kingdom of Saudi Arabia, Saudi Arabian Directorate General of Mineral Resources Geoscience Map GM-107C, scale, 1(250,000).
- Assessing the impact of groundwater mixing and sea water intrusion on oil production in coastal oil fields using resistivity sounding methods. Arabian J. Geosci.. 2020;13:1-11.
- [Google Scholar]
- Groundwater Assessments of Ibrahim Valley in Makkah City, Saudi Arabia. College of Engineering and Technology, Ohio University; 2001. M. Sc Thesis
- Land subsidence triggered by groundwater withdrawal under hyper-arid conditions: case study from Central Saudi Arabia. Environ. Earth Sci.. 2019;78(7):243.
- [Google Scholar]
- MEWA, 2019 (Ministry of Environment, Water and Agriculture). Annual Report 2018, Riyadh, Saudi Arabia.
- MWE, 2014 (Ministry of Water and Electricity). Annual Report 2013, Riyadh, Saudi Arabia.
- Morey R.M., 1974, Continuous subsurface profiling by impulse radar: Am. Sot. of Civil Engineers, Proc., Engineering Foundation Conference on Subsurface exploration for underground excavation and heavy construction, Henniker, N.H. 213–232
- Othman, A., Shaaban, F., Abotalib, A.Z. et al., 2020. Hazard Assessment of Rockfalls in Mountainous Urban Areas, Western Saudi Arabia. Arab J Sci Eng. https://doi.org/10.1007/s13369-020-05098-x
- Inferencing the land subsidence in the Nile Delta using Sentinel-1 satellites and GPS between 2015 and 2019. Sci. Total Environ.. 2020;729:138868.
- [CrossRef] [Google Scholar]
- Archaeological Prospecting and Remote Sensing. Cambridge: Cambridge University Press; 1990.
- Environmental and Engineering Geophysics II. Cambridge University Press; 2007.
- An integrated approach for hydrogeophysical investigations: new technologies and a case history. Near-Surf. Geophys.. 2005;2:585-603.
- [Google Scholar]
- Seeing through rock salt with radar: Geophysics.. 1976;41:123-132.
- An integrated approach for identifying aquifers in transcurrent fault systems: The Najd shear system of the Arabian Nubian shield. J. Hydrol.. 2008;349(3-4):475-488.
- [Google Scholar]
- Sutradhar S., Mondal P., Das N., 2021. Delineation of groundwater potential zones using MIF and AHP models: A micro-level study on Suri Sadar Sub-Division, Birbhum District, West Bengal, India, Groundwater for Sustainable Development, 100547.
- Yousif, M., Hussien, H.M. Abotalib, A.Z., 2020. The respective roles of modern and paleo recharge to alluvium aquifers in continental rift basins: A case study from El Qaa plain, Sinai, Egypt. Science of The Total Environment, p.139927.


