

Translate this page into:
Delineation of seawater intrusion in the Yanbu industrial area, northwest Saudi Arabia, using geoelectric resistivity sounding survey
⁎Corresponding author. nalotaibic@ksu.edu.sa (Naif Al-Otaibi)
-
Received: ,
Accepted: ,
This article was originally published by Elsevier and was migrated to Scientific Scholar after the change of Publisher.
Abstract
Eleven Schlumberger array vertical electrical soundings were done at specified places in the Yanbu industrial sector, northwest Saudi Arabia, to identify possible seawater intrusion that may influence the shallow groundwater aquifer along the city's coastline zone. The variations of the resistivity values indicate the subdivision of the study area into two zones. These zones are characterized by different VES curve types; the Q-type and the H-type which dominate in the western and the eastern zones, respectively. VES data show three geoelectric resistivity layers. The first layer is an inhomogeneous layer with a wide range of resistivities correlated to Quaternary sediments (ranges from gravel, and sand to silt and clay) of variable lithology and water content. The resistivity of the second layer indicates abundant clay with a local change in the lithology to become gravel and coarse sand. The third layer shows a sudden and sharp variation of the resistivities; indicating a possible fault affected the coastal plain. This faulting system uplifts the basement, which may operate as an impermeable or sealing wall to prevent seawater from entering the shallow groundwater aquifer in the west. Most seawater intrusion in the studied area is regulated by faulting and lateral lithologic changes.
Keywords
Electrical resistivity
Seawater intrusion
Coastal aquifer
Lithologic variation
Yanbu industrial area

1 Introduction
The water demand is being further increased by continual improvement in living conditions in addition to a rise in population (Neumann et al., 2015). Groundwater, the principal freshwater source in coastal areas, is utilized indiscriminately to meet expanding residential, agricultural, and industrial water demands (Hamed et al., 2018). Excess groundwater withdrawal disturbs the hydrodynamic equilibrium between freshwater and seawater in the aquifer, pushing seawater upward (van Camp et al., 2014). As a result, fresh groundwater resources are being depleted in coastal locations (Alfarrah and Walraevens, 2018; Werner et al., 2013). The “Ghyben-Herzberg relationship” is a well-known mathematical relationship that controls whether seawater moves uphill or downward into the coastal aquifer (Narayan et al., 2007). According to the relationship, the depth of seawater decreases by 40 m for every meter that the water table rises. When groundwater levels drop below the mean sea level, coastal aquifer seawater flows inland, reversing the hydraulic gradient (Lee and Cheng, 1974; Nair et al., 2013). The inland migration of seawater into the coastal aquifer is the principal cause of coastal groundwater decrease. Seawater intrusion not only hinders the development of the local agricultural and industrial sectors but also lowers people's quality of life (Demirel, 2004).
Seawater intrusion has been studied extensively in coastal locations worldwide (Abdalla, 2016; Allow, 2011; Barlow and Reichard, 2010; Felisa et al., 2013; Garing et al., 2013; Manivannan and Elango, 2019; Rajaveni et al., 2016; Shammas and Jacks, 2007; Shi and Jiao, 2014; Suhartono et al., 2015; Werner and Gallagher, 2006; Zghibi et al., 2013). However, there have been few attempts to link these separate researches to gain a better knowledge of the seawater intrusion process and associated corrective actions. The goal of the current effort is to describe the numerous aspects that affect seawater intrusion and mitigation tactics. Regional and global phenomena including sea level rise, storm surges, climate changes, shoreline erosion, coastal floods, etc. affect coastal aquifers (Barlow, 2003). Salinization in coastal locations is accelerated by human activity (Rapti-Caputo, 2010). Surface water sources are also impacted by their interaction with seawater, in addition to the coastal aquifers. Due to seawater backwater, rivers and estuaries naturally bring seawater and salt to surface water (Oude Essink, 2001; Vijay et al., 2011).
Lithology, geomorphology, structural features, and other geological factors regulate coastal aquifer seawater intrusion. The aquifer lithology, or the makeup of the geological formations, determines how much water flows inland from the coastal aquifer (Michael et al., 2013). The magnitude of seawater intrusion is directly influenced by the geological history of water-bearing formation, hydraulic gradient, pace of groundwater extraction, and replenishment (Ammar et al., 2016; Barlow, 2003; Choudhury et al., 2001). Various porosity and permeability levels in geologic formations have various water-holding capacities. Paleo-saltwater may arise when seawater that is flooding inland regions becomes stuck in the under-saturated pore spaces (Werner and Gallagher, 2006). Clayey layers are typically found in small patches along the coast, where they function as barriers to protect the light-colored saltwater (Barrett et al., 2002; Cary et al., 2015). In locations that do not experience seawater inundation, however, these clay patches may grow perched aquifers and assemble freshwater (Yousif and Bubenzer, 2012). In such cases, the distribution of clay patches in coastal aquifers determines the distribution of freshwater and seawater. The coastal groundwater, however, may have a significantly higher salinity due to the interaction of freshwater with old trapped seawater and saltpans (Ayolabi et al., 2013; Nair et al., 2016).
Climate change and sea level rise are the main factors regulating coastal seawater incursion. The main source of groundwater recharge is atmospheric precipitation, but its volume varies across time and space. Furthermore, there is significant inter-annual variability in atmospheric precipitation. During the rainy season, groundwater levels rise, but in summer, evapotranspiration increases multifold, and precipitation decreases (Rapti-Caputo, 2010; Alarifi et al., 2022a, 2022b). As a result, even relatively minor groundwater removal during non-rainy seasons may cause seawater intrusion. Thus, dry seasons increase seawater intrusion risk compared to rainy seasons. Other aspects of climate change that are directly related to seawater intrusion include meteorological drought, storm surges, and coastal erosion (Terry and Falkland, 2010). Storm surges pose a threat to coastal aquifers by saline coastal groundwater and salt-depositing soil by flooding low-lying coastal areas with seawater (Rezaie et al., 2019). Because of this, the soil and groundwater cannot be used for farming or other purposes.
Tidal action affects coastal groundwater quality, and many scholars have used simulation, field, and experimental methods to study it. Kim et al. (2005) discovered that groundwater quality in Kimje, Korea's coastal districts correlates with periodic changes in tidal activities using time series analysis. A different study found that tides on Jeju Island, Korea, affect the coastal groundwater system up to 3 km inland (Kim et al., 2006). According to studies (Carr and van der Kamp, 1969; Nielsen, 1990), the oscillation in tide movement modulates the groundwater head in coastal zones, which results in periodic variations in the groundwater table. The freshwater-seawater mixing zone is directly impacted by such changes in groundwater head (Bear, 1972; Strack, 1976; Wang and Tsay, 2001). According to Shalev et al. (2009), this variation in the freshwater-seawater interface results in a seawater inflow into the pumping wells during the high tide period.
Seawater intrusion is considered an increasing threat to coastal communities causing enormous risks to the coastal environment and making the groundwater unsuitable for consumption. Several researchers have studied the environmental risks of seawater intrusion (Alfaifi et al., 2019, Hussain et al., 2019, Khadra and Stuyfzand, 2018; Chang et al., 2018, and Alharbi et al., 2023). The problem of the salinization of shallow groundwater aquifers has been recorded in many areas along the Saudi Red Sea coast, where the excessive pumping of unconfined coastal aquifers by water wells leads to the intrusion of seawater (e.g. Mogren, 2015).
The area of study (Fig. 1) witnesses high-speed urban growth and high-speed industrialization, where the city of Yanbu has been developed to become the third largest oil refinery center in the world. This area has few deep boreholes to study the shallow groundwater aquifer, so a vertical electrical sounding (VES) survey using the Schlumberger array was conducted on 11 localities (Fig. 1) to determine how seawater intrusion affected the shallow coastal aquifer. Many countries have employed resistivity-sounding surveys to detect seawater incursion and freshwater/saline water interface (Mogren, 2015, Batayneh, 2006). The high resistivity contrast between the layers saturated with seawater and layers saturated with freshwater; makes vertical resistivity sounding (VES) effective for coastal seawater intrusion detection. The VES survey in this work was conducted primarily to gather data on the underlying lithology, groundwater salinity, and hydrogeological behavior of the aquifers.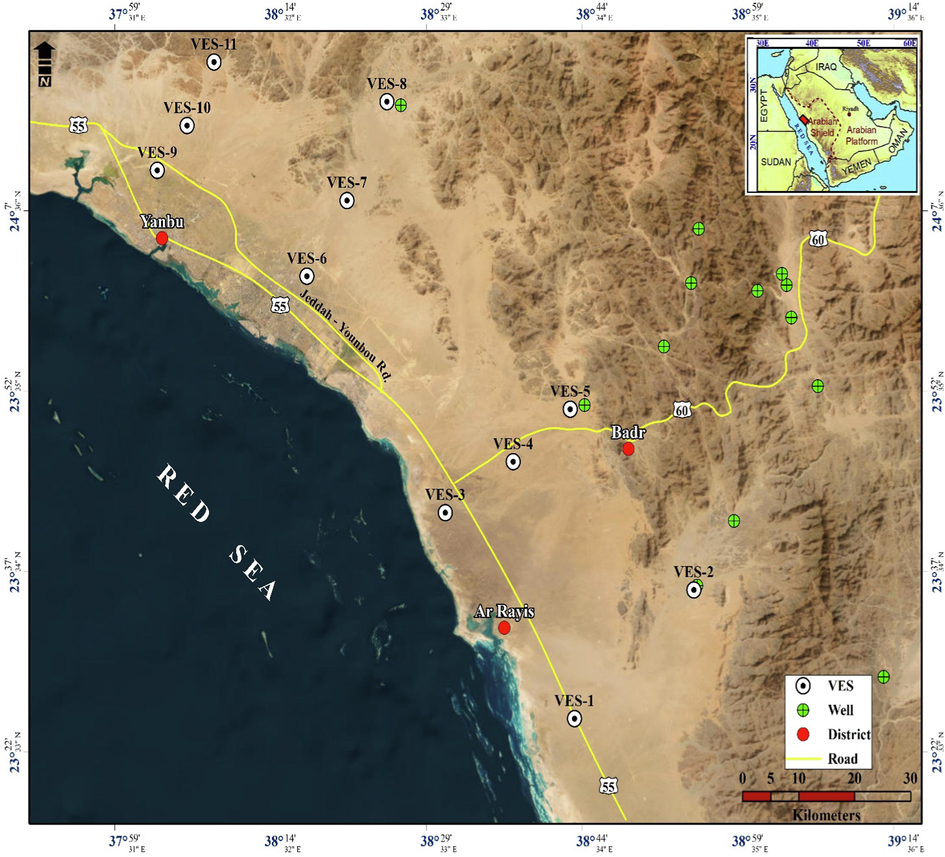
Location map of the study area including the measured VES stations and boreholes.
2 The study area
The study area (Fig. 1) lies along the eastern Red Sea coast west of Al Madinah and NW of Jeddah. It has one of Saudi Arabia's largest and oldest marine ports located in this area, which is increasing in population and tourism. Recently, the area attracted several development and industrial projects; where the area plays a major role in the kingdom’s gross national income. This area is occupied by the Yanbu Industrial City which represents the last station for the raw oil and liquid natural gas pipelines.
The area lies on the “Tihamah” littoral plain (Fig. 2) at the foot of the highly dissected Precambrian granitic mountains of Alhijaz. The coastal plain is covered by the Quaternary sediments (Fig. 2); mainly gravel, sand, silt, and clay. Flash floods from close-lying coastal escarpments have deposited terrigenous material in many old wadis, forming most of the sediments along the coastline. Parts of the area are covered by Sabkha soil and the coastal morphology of the area is characterized by an extension of various open bays on its shores referred to as “Sharm”. The coastal zone of Yanbu is a dynamic and morphologically unstable area (Nofal and Abboud, 2019). The area is bounded from the eastern side by basement rocks of Alhijaz mountains and basalt ridge forming part of a set of so-called Harrats (lava flows today in an inversion of relief), coming from mouths located at a hundred kilometers inside, and going back to the old Pleistocene (Monnier and Guilcher, 1993).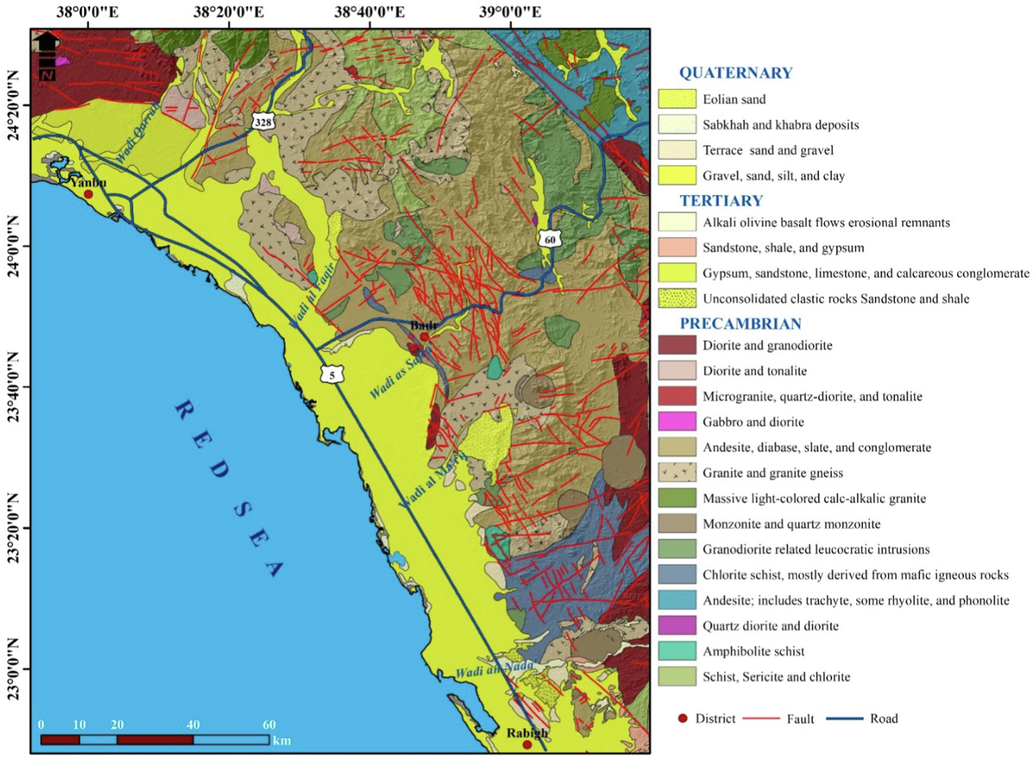
Geologic map of the study area (modified after Monnier and Guilcher, 1993).
3 Data acquisition and processing
Among all surface geophysical methods, the electrical resistivity method has been applied most widely for groundwater investigations. A Schlumberger array with 600 m current electrode spacing was used for the VES survey in this investigation. In this respect, a total of 11 VES stations were conducted along four NNW-SSE profiles, using the Iris Syscal-R2 resistivity meter. Fig. 1 depicts the positioning and distribution of the VES spreads. Using IX1D-Interpex software (ver. 3.52, 2013), the 1-D inversion approach was used to process the VES field data in terms of the layer parameters. With the least root mean square (RMS) error between the generated model and the field data, this 1-D inversion generates a resistivity model that fits the VES field data. In this respect, the initial forward model for each VES was proposed based on the available geological and borehole information in the current study. After the first forward model was calculated, multiple iterations were applied until the RMS fitting error between the observed and calculated data for the assumed model. In addition, smooth model inversion was applied using a model with the same number of layers as the data points and fixed thicknesses related to the electrode spacing. The output is subsurface geoelectric resistivity layers with their true resistivities, thickness, and depths. The interpreted resistivity layers with their true resistivities and thicknesses are listed in Table 1.
VES-No
Latitude degree (N)
Longitude degree (E)
Layer-1
Layer-2
Layer-3
R1
Ohm.mH1 (meter)
R2
Ohm.mH2
(meter)R3
H3
VES-1
23.42049
38.73015
100.7
5.5
3.2
61.0
0.6
—
VES-2
23.60348
38.92313
607.8
1.5
103.0
28.2
843.4
—
VES-3
23.70719
38.5252
52.2
5.4
2.4
52.6
0.7
—
VES-4
23.7774
38.63317
110.1
8.8
20.6
61.4
228.8
—
VES-5
23.85121
38.72403
122.5
25.4
42.1
15.7
126.5
—
VES-6
24.03733
38.2966
135.0
0.9
24.3
21.3
4.3
—
VES-7
24.13811
38.36557
1659.4
2.1
245.3
8.8
11.9
—
VES-8
24.2536
38.41915
225.0
4.2
29.3
27.9
958.7
—
VES-9
24.1789
38.06126
79.5
1.7
11.7
16.3
1.2
—
VES-10
24.24478
38.10904
120.9
6.7
3.9
61.8
803.0
—
VES-11
24.32832
38.14949
470.4
8.3
13.2
77.2
4463.6
—
4 Results and interpretation
The interpretation shows that the study area's subterranean rock units' resistivity varies greatly. Depending on the VES curve type, the amount of geoelectrical layers, and their connection to resistivity; geoelectrically, the study region has two zones. The western zone is characterized by descending Q-type VES curves (ρ1 > ρ2 > ρ3) that show decreasing resistivity with depth. H-type VES curves (ρ1 > ρ2 < ρ3) in the eastern zone indicate decreasing resistivity with depth till reaching high resistivity bedrock at the bottom. Fig. 3 displays examples of the two types of sounding curves along with respective 1-D inversion models and data fit.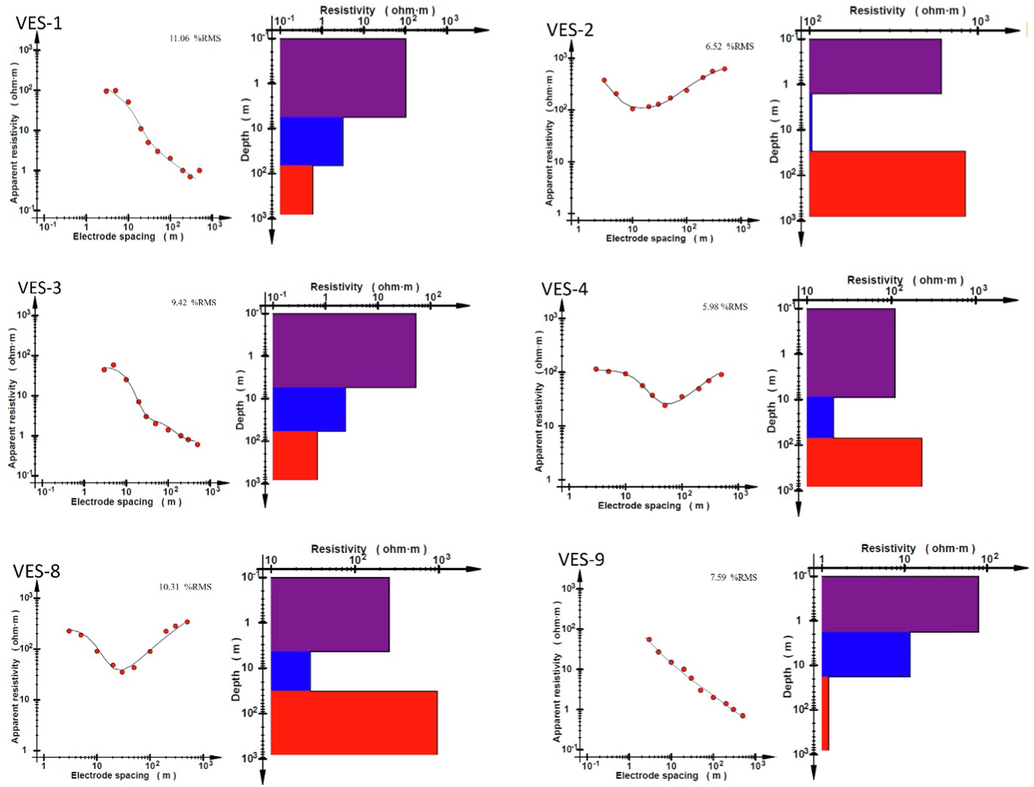
Inversion modeling in comparison with field data for Q-type VESes (VES-1, VES-3, and VES-9) that characterize the western zone of the study area and H-type VESes (VES-2, VES-4, and VES-8) that characterize the eastern zone of the study area.
A correlation between the interpreted VES-sounding layers and the available borehole data was conducted (Fig. 4). The correlation shows good agreement within the available lithologic information. The first top layer is correlated with the Quaternary sediments (gravel, coarse sand, silt, and clay) that attain a resistivity of 100 Ohm.m; followed by the second layer of sand and clay contaminated by seawater with a resistivity of 0.6 Ohm∙m (Fig. 4). This shows that lithology, water, clay, and salinity determine subsurface rock strata electrical resistance.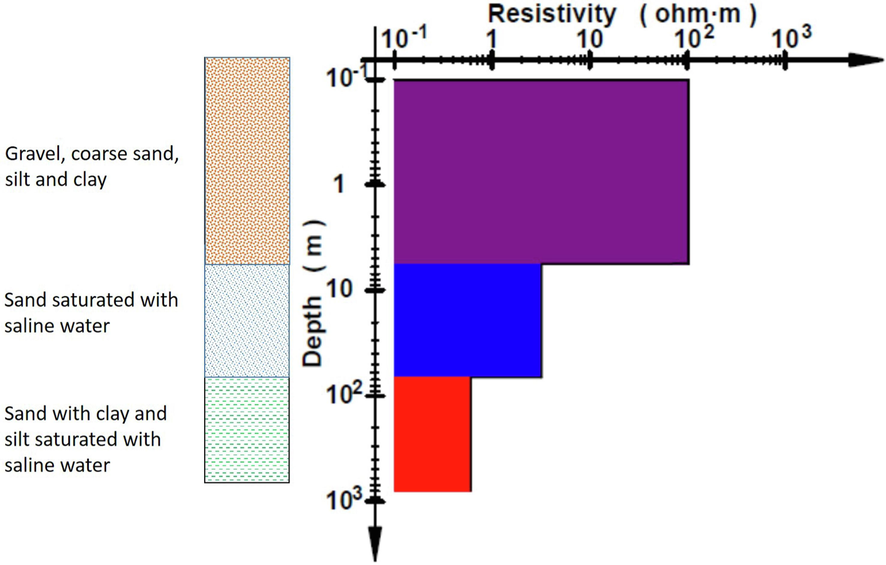
Correlation of VES-1 with the nearest borehole lithologic log.
VES data show three resistivity layers. The resistivity of the interpreted three geoelectric layers (listed in Table 1) is plotted in iso-resistivity contour maps to show resistivity dispersion horizontally and vertically over the research area (Figs. 5–7). The first layer (Fig. 5) attains a thickness, that ranges from 1.5 to 9 m and a wide range of resistivities (ranges from 52 to 1650 Ohm.m). The wide range of resistivity indicates inhomogeneous Quaternary sediment varied from gravel, and coarse sand to silty and clayey soil with different moisture content. This layer has significant resistivities toward the east of the study region; indicating dry gravel and coarse sand sediments, while the western side is dominated by low resistivities; which indicates clayey moist soil. The second layer (Fig. 6) shows relatively low resistivities (2.4–28 Ohm.m), except for a local rise in the northwestern part where the resistivity reaches 240 Ohm.m; indicating a change in the lithology to gravel and coarse sand. This layer is composed of silty sand clay-graded gravel and coarse sand in some places’ upper parts. The sediments of this layer are saturated with saltwater. The third layer (Fig. 7) is geoelctrically divided into two zones; the western zone is dominated by its low resistivity (1.2–11 Ohm.m) and the eastern zone is characterized by relatively very high resistivities that reach 4463 Ohm.m. These findings show a fault, which causes a basement uplift, is present in the studied area. In the eastern half of the region, the fractured basement uplift may function as an impermeable or sealing wall within the shallow aquifer, preventing the infiltration of seawater. This explains the very obvious difference in the resistivity values between the western and eastern zones; suggesting a possible seawater intrusion that may be controlled by a subsurface faulting that divides the area into two zones (Fig. 8).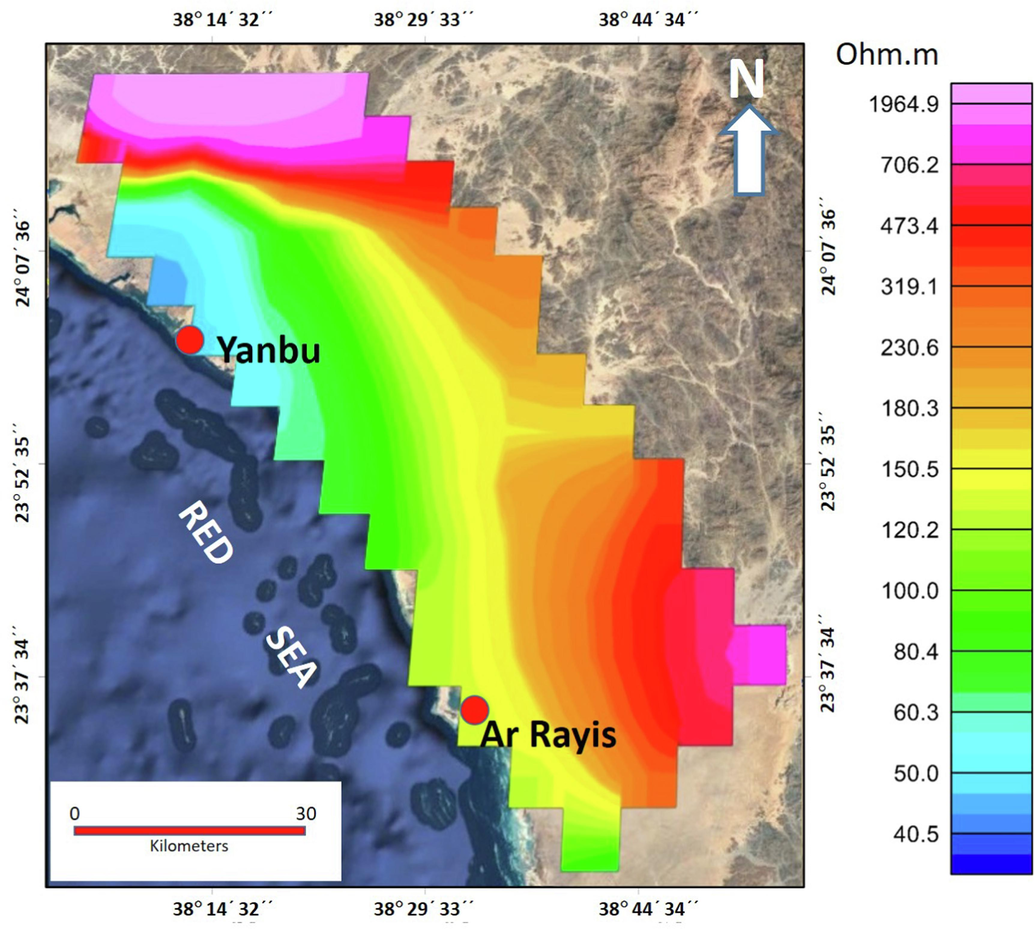
A map shows the distribution of the true resistivity of the first geoelectric resistivity layer along the study area.
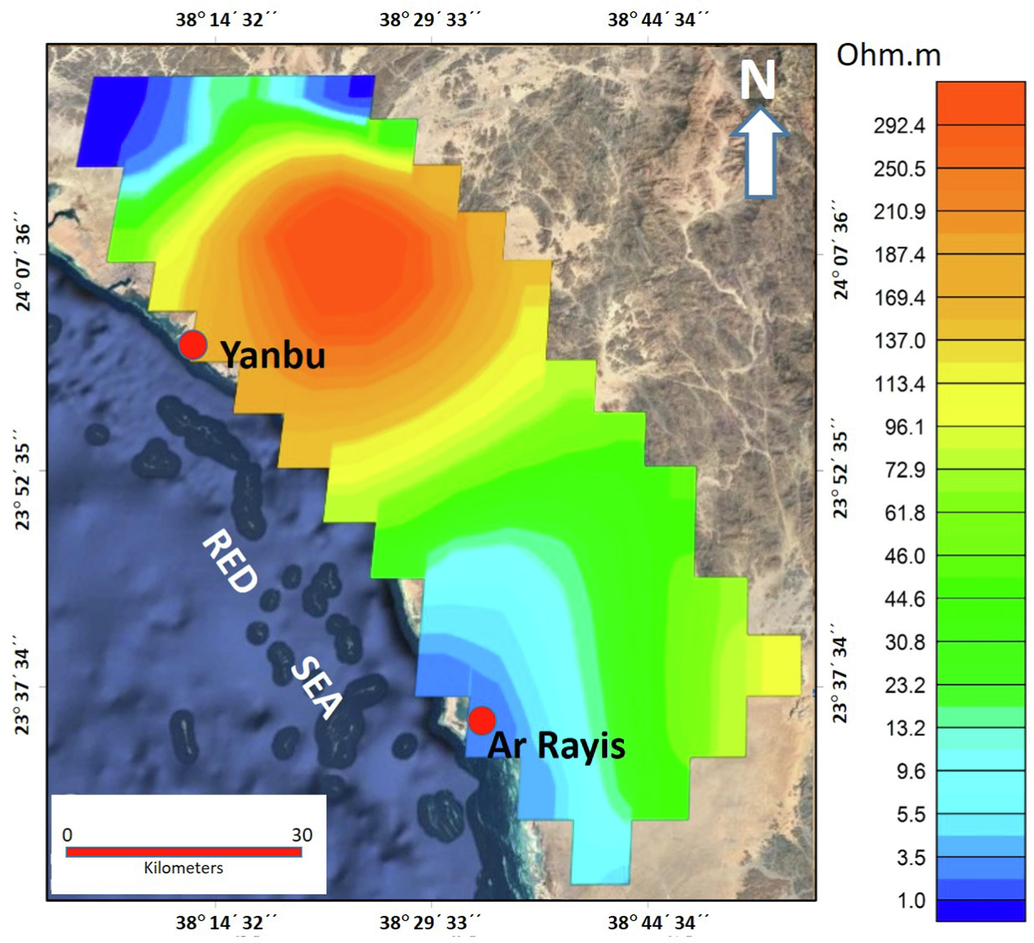
A map shows the distribution of the true resistivity of the second geoelectric resistivity layer along the study area.
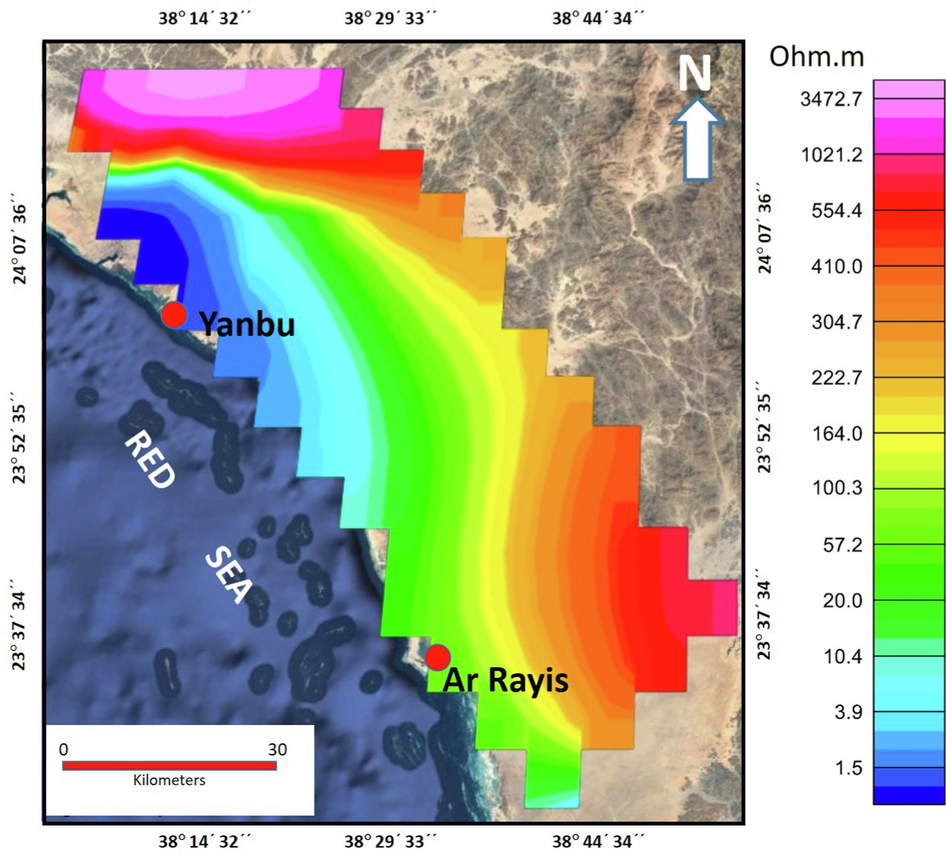
A map shows the distribution of the true resistivity of the third geoelectric resistivity layer along the study area.
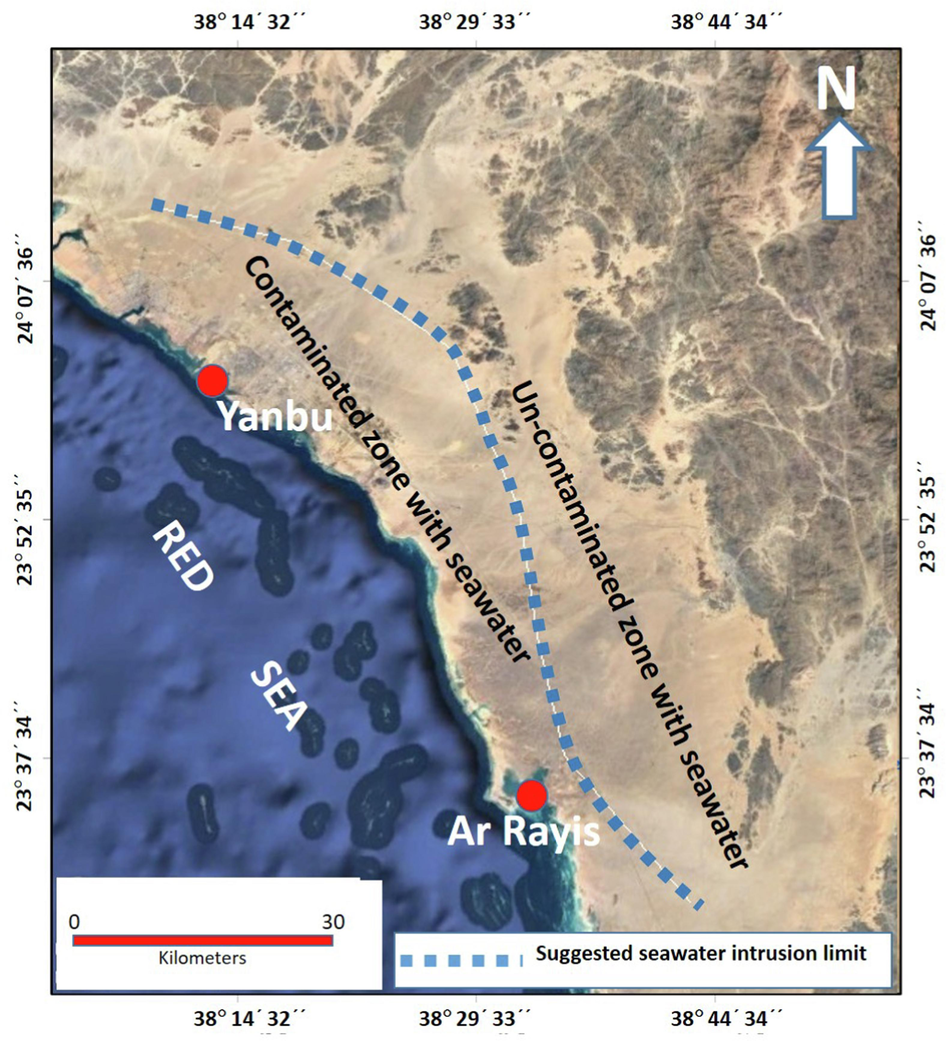
A possible extension of the seawater intrusion into the coastal area around the industrial city of Yanbu.
5 Geoelectrical cross-sections
Three geoelectrical cross-sections have been constructed throughout the study area (Fig. 9). All cross-sections are oriented NE-SW perpendicular to the Red Sea’s main direction. Three geoelectrical layers make up the subsurface section, according to their cross-sections. Surface dry sand, gravel, and silt form the first layer. Wet sand, silt, and clay form the second geoelectrical layer while the third layer is represented by clayey sand soaked with saline water. Basement rocks create the fourth geoelectrical layer. The resistivity of the second unit ranges between 9 and 29 Ω.m, 1.7–13.2 Ω.m in geoelectrical cross-sections a and b respectively while not recorded in cross-section c. The third geologic unit has resistivities in the range of 4.3–11.9 Ω.m, 1.2 Ω.m, and 0.6–3.2 Ω.m for cross-sections a, b, and c respectively. The fourth geoelectric unit has resistivity values of 958 Ω.m, 803–4464 Ω.m, and 843 Ω.m for cross-sections a, b, and c respectively. Structurally, these cross-sections reveal a fault with a downthrown side toward the western direction.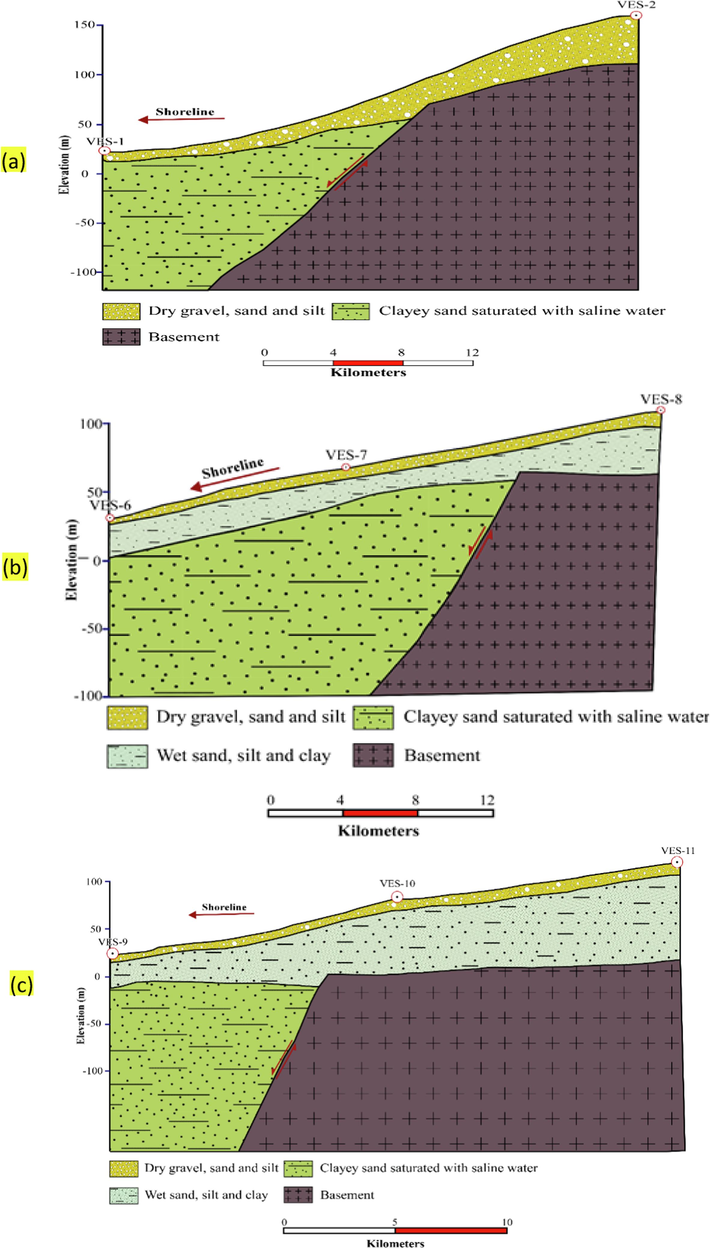
Geoelectrical cross-sections in the area of study. (a) Between VES-1 and VES-2, (b) between VES-6, VES-7 and VES-8, (c) between VES-9, VES-10 and VES-11.
6 Discussion and conclusions
The Schlumberger array was used to conduct a vertical electrical sounding (VES) survey at 11 locations in the Yanbu industrial area to collect data on subsurface lithology and groundwater salinity to help identify seawater intrusion in the shallow aquifer along the coastal zone. The interpretation of the VES data reveal the presence of three distinct resistivity layers. The first layer is an inhomogeneous layer with a wide large range of resistivities, which is correlated to Quaternary sediments of variable lithology ranging from gravel, and sand to silt and clay; besides variable water content. The variation of resistivities of the second layer indicates abundant clayey soil as indicated by its low resistivity values; except a local high resistivity in the northern part; indicating a local change in the lithology to gravel and coarse sand. The resistivity values of the third layer show a sharp and sudden change in the resistivity values; indicating a possible structural fault affected the coastal plain that may result in a basement uplift. The fractured basement uplift in the eastern investigated area may seal seawater from entering the shallow groundwater aquifer. In general, structural faulting and lateral lithologic changes have a major role in controlling seawater incursion in the research area. A large resistivity contrast between seawater that greatly lowers the contaminated zone's resistivity values compared to the uncontaminated zone in current data suggest that the VES survey is beneficial for assessing coastal seawater intrusion. To safeguard the freshwater in the eastern side of the area, it is recommended to reduce the pumping from the shallow wells because the primary cause of saltwater intrusion is the over-pumping of fresh groundwater from coastal aquifers, which reduces the hydrostatic pressure and drawing saltwater into the aquifer.
Acknowledgement
This research was funded by the National Plan for Science, Technology, and Innovation (MAARIFAH), King Abdulaziz City for Science and Technology, Kingdom of Saudi Arabia, Award Number (2-17-01-001-0041).
Declaration of competing interest
The authors declare that they have no known competing financial interests or personal relationships that could have appeared to influence the work reported in this paper.
References
- Ionic ratios as tracers to assess seawater intrusion and to identify salinity sources in Jazan coastal aquifer, Saudi Arabia. Arab. J. Geosci.. 2016;9:40.
- [Google Scholar]
- Alarifi, S.S., Abdelrahman, K., Hazaea, B.Y., 2022a. Near-surface groundwater exploration using the geoelectrical resistivity method: a case study of Wadi Nisah, Riyadh, Saudi Arabia. J. King Saud Univ. – Sci. 34 (2022) 102207.
- Alarifi S. S., Abdelrahman, K., Hazaea, B.Y., 2022b. Depicting of groundwater potential in hard rocks of southwestern Saudi Arabia using the vertical electrical sounding approach. J. King Saud Univ. – Sci. 34 (2022) 102221.
- Integrated geophysical and hydrochemical investigations for seawater intrusion: a case study in southwestern Saudi Arabia. Arab. J. Geosci.. 2019;12:372.
- [Google Scholar]
- Groundwater overexploitation and seawater intrusion in coastal areas of arid and semi-arid regions. Water. 2018;10:143.
- [Google Scholar]
- Contamination and health risk assessment of groundwater along the Red Sea coast, Northwest Saudi Arabia. Mar. Pollut. Bull.. 2023;192(2023):115080
- [Google Scholar]
- Seawater intrusion in Syrian coastal aquifers, past, present and future, case study. Arab. J. Geosci.. 2011;4:645-653.
- [Google Scholar]
- Identifying recharge and salinization sources of groundwater in the Oussja Ghar el Melah plain (northeast Tunisia) using geochemical tools and environmental isotopes. Environ. Earth Sci.. 2016;75:606.
- [Google Scholar]
- Mapping saline water intrusion into the coastal aquifer with geophysical and geochemical techniques: the University of Lagos campus case (Nigeria) Springerplus. 2013;2:433.
- [Google Scholar]
- Ground Water in Freshwater-saltwater Environments of the Atlantic Coast. Reston, Virginia: US Department of the Interior. US Geological Survey; 2003.
- Saltwater intrusion in coastal regions of North America. Hydrgeol. J.. 2010;18:247-260.
- [Google Scholar]
- Geophysical methods in saline groundwater studies: locating perched water tables and fresh-water lenses. Explor. Geophys.. 2002;33:115-121.
- [Google Scholar]
- Use of electrical resistivity methods for detecting subsurface fresh and saline water and delineating their interfacial configuration: a case study of the eastern Dead Sea coastal aquifers, Jordan. Hydrgeol. J.. 2006;14:1277-1283.
- [Google Scholar]
- Dynamics of Fluids in Porous Media. New York: American Elsevier Publishing Company; 1972.
- Determining aquifer characteristics by the tidal method. Water Resour. Res.. 1969;5:1023-1031.
- [Google Scholar]
- Origins and processes of groundwater salinization in the urban coastal aquifers of Recife (Pernambuco, Brazil): a multi-isotope approach. Sci. Total Environ.. 2015;530–531:411-429.
- [Google Scholar]
- Numerical simulation of seawater intrusion to coastal aquifers and brine water/freshwater interaction in the south coast of Laizhou Bay, China. J. Contam. Hydrol.. 2018;215:1-10.
- [Google Scholar]
- Geophysical study for saline water intrusion in a coastal alluvial terrain. J. Appl. Geophys.. 2001;46:189-200.
- [Google Scholar]
- The history and evaluation of saltwater intrusion into a coastal aquifer in Mersin, Turkey. J. Environ. Manage.. 2004;70:275-282.
- [Google Scholar]
- Saltwater intrusion in coastal aquifers: a primary case study along the Adriatic Coast investigated within a probabilistic framework. Water. 2013;5:1830-1847.
- [Google Scholar]
- Geochemical investigations of saltwater intrusion into the coastal carbonate aquifer of Mallorca, Spain. Appl. Geochem.. 2013;39:1-10.
- [Google Scholar]
- Climate impact on surface and groundwater in North Africa: a global synthesis of findings and recommendations. Euro-Mediterranean J. Environ. Integr.. 2018;3:25.
- [Google Scholar]
- Management of seawater intrusion in coastal aquifers: a review. Water. 2019;11:2467.
- [Google Scholar]
- Simulation of saltwater intrusion in a poorly karstified coastal aquifer in Lebanon (eastern Mediterranean) Hydrgeol. J.. 2018;26:1839-1856.
- [Google Scholar]
- Use of time series analysis for the identification of tidal effect on groundwater in the coastal area of Kimje, Korea. J. Hydrol.. 2005;300:188-198.
- [Google Scholar]
- Tidal effects on variations of fresh–saltwater interface and groundwater flow in a multilayered coastal aquifer on a volcanic island (Jeju Island, Korea) J. Hydrol.. 2006;330:525-542.
- [Google Scholar]
- On seawater encroachment in coastal aquifers. Water Resour. Res.. 1974;10:1039-1043.
- [Google Scholar]
- Seawater intrusion and submarine groundwater discharge along the Indian coast. Environ. Sci. Pollut. Res.. 2019;26:31592-31608.
- [Google Scholar]
- Global assessment of vulnerability to sea level rise in topography-limited and recharge-limited coastal groundwater systems. Water Resour. Res.. 2013;49:2228-2240.
- [Google Scholar]
- Saltwater intrusion in Jizan Coastal Zone, Southwest Saudi Arabia, inferred from geoelectric resistivity survey. Int. J. Geosci.. 2015;6:286-297.
- [Google Scholar]
- (1993): Le Sharm Abhur, ria récifale du Hedjaz, mer Rouge: géomorphologie et impact de l’urbanisation. Annales De Géographie.. 1993;102(569):1-16.
- [Google Scholar]
- Identification of seawater intrusion by Cl/Br ratio and mitigation through managed aquifer recharge in aquifers North of Chennai, India. J. Groundwater. Res.. 2013;2:155-162.
- [Google Scholar]
- Identification of salinization by bromide and fluoride concentration in coastal aquifers near Chennai, southern India. Water Sci.. 2016;30
- [Google Scholar]
- Modelling seawater intrusion in the Burdekin Delta Irrigation Area, North Queensland, Australia. Agric. Water Manag.. 2007;89:217-228.
- [Google Scholar]
- Future coastal population growth and exposure to sea-level rise and coastal flooding - a global assessment. PLoS One. 2015;10:e0118571
- [Google Scholar]
- Tidal dynamics of the water table in beaches. Water Resour. Res.. 1990;26:2127-2134.
- [Google Scholar]
- Sea level changes of Sharm Yanbu and its expected impacts on development processes using GIS and remote sensing. J. Taibah U. Sci.. 2019;13(1):547-558.
- [Google Scholar]
- Improving fresh groundwater supply problems and solutions. Ocean Coast. Manag.. 2001;44:429-449.
- [Google Scholar]
- Evaluation of the impact of climate change on seawater intrusion in a coastal aquifer by finite element modelling. J. Clim. Chang.. 2016;2:111-118.
- [Google Scholar]
- Influence of climatic changes and human activities on the salinization process of coastal aquifer systems. Ital. J. Agron.. 2010;5:67.
- [Google Scholar]
- Rezaie, A.M., Ferreira, C.M., Rahman, M.R., 2019. Storm surge and sea level rise: threat to the coastal areas of Bangladesh. In: Extreme Hydroclimatic Events and Multivariate Hazards in a Changing Environment. Elsevier, pp. 317–342.
- Biased monitoring of fresh water-salt water mixing zone in coastal aquifers. Ground Water. 2009;47:49-56.
- [Google Scholar]
- Seawater intrusion in the Salalah plain aquifer. Oman. Environ. Geol.. 2007;53:575-587.
- [Google Scholar]
- Seawater intrusion and coastal aquifer management in China: a review. Environ. Earth Sci.. 2014;72:2811-2819.
- [Google Scholar]
- A single-potential solution for regional interface problems in coastal aquifers. Water Resour. Res.. 1976;12:1165-1174.
- [Google Scholar]
- Seawater intrusion modeling on groundwater confined aquifer in Semarang. Proc. Environ. Sci.. 2015;23:110-115.
- [Google Scholar]
- Responses of atoll freshwater lenses to storm-surge overwash in the Northern Cook Islands. Hydrgeol. J.. 2010;18:749-759.
- [Google Scholar]
- Investigating seawater intrusion due to groundwater pumping with schematic model simulations: the example of the Dar es Salaam coastal aquifer in Tanzania. J. Afr. Earth Sci.. 2014;96:71-78.
- [Google Scholar]
- Assessment of groundwater quality in Puri City, India: an impact of anthropogenic activities. Environ. Monit. Assess.. 2011;177:409-418.
- [Google Scholar]
- Characterization of sea-water intrusion in the Pioneer Valley, Australia using hydrochemistry and three-dimensional numerical modeling. Hydrgeol. J.. 2006;14:1452-1469.
- [Google Scholar]
- Seawater intrusion processes, investigation, and management: recent advances and future challenges. Adv. Water Resour.. 2013;51:3-26.
- [Google Scholar]
- Perched groundwater at the northwestern coast of Egypt: a case study of the Fuka Basin. Appl. Water Sci.. 2012;2:15-28.
- [Google Scholar]
- Assessment of seawater intrusion and nitrate contamination on the groundwater quality in the Korba coastal plain of Cap-Bon (Northeast of Tunisia) J. African Earth Sci.. 2013;87:1-12.
- [Google Scholar]
Appendix A
Supplementary material
Supplementary data to this article can be found online at https://doi.org/10.1016/j.jksus.2024.103110.
Appendix A
Supplementary material
The following are the Supplementary data to this article:
Supplementary data 1
Supplementary data 1
Data used in the current study


