

Deciphering the influence of soil and feed on the nutritional status of ruminants in rainfed areas using metagenomic analysis
⁎Corresponding authors. dr.pkpankaj@gmail.com (Prabhat Kumar Pankaj), parashar.abhinav.2008@gmail.com (Abhinav Parashar)
-
Received: ,
Accepted: ,
This article was originally published by Elsevier and was migrated to Scientific Scholar after the change of Publisher.
Peer review under responsibility of King Saud University.
Abstract
The soil–plant-animal continuum is an emerging domain in biological research and hence, to ascertain this aspect, the present study was conducted in three agro-ecologically different areas in Andhra Pradesh and Telangana, India. The goal of this work was to explore the impact of feed type and geographical conditions on the growth dynamics of sheep feed with three different diets – sorghum stover (Vizag district), groundnut halums (Krishna district) and red gram chunni (Ranga Reddy district). Animals were fed these diets at night daily for 90 days after their routine daytime grazing. The study regions varied in altitude, annual rainfall and mean temperature. Soil analysis was performed in these regions to check for pH, mineral content, organic carbon and bacterial composition. Growth dynamics (average daily gain of 41.56–77.11 g per day) and feed conversion ratios (6.26–10.93) differed markedly (p < 0.05) among animals in the three regions. Metagenomics sampling of sheep ruminal fluid from sheep reared in the three distinct regions (and separate feed types) was carried out by sequencing 16S rRNA V3-V4 regions. Comparison of alpha diversity and operational taxonomic unit (OTU) richness showed remarkable variations in the Chao1, ACE, Shannon and Simpson indices. The results of this work reveal the relationship between feed type, geographical location and ruminal microflora composition. The presence of numerous genera and species differences were discovered in the three samples, and the presence of several methanogens was confirmed. In conclusion methane emissions from cattle and sheep may be mitigated by altering the feed type, which directly influences the ruminal and gut microflora composition. Further research is recommended in order to determine the optimal relationship between soil and feed and their impact on the nutritional status of ruminants in rainfed areas, taking into account various farming and agroclimatic conditions.
Keywords
Edaphic
Feed
Methanogens
Metagenomics
Ruminal microflora

1 Introduction
Rainfed regions have different climatic, edaphic, pastoral, and eco-social system characteristics, and the core ecological continuum of these regions is formed through soil–plant-animal feedback. Edaphic environmental factors are greatly influenced by its trace elements, microbial content and the distribution attributed by area specific global ecosystem (Bonari et al., 2019). Soil is the mother of a variety of microflora and fauna as well as trace elements necessary for maintaining the health of crops as well as livestock. Soil supply nutrients to the above ground flora and fauna and concentrations of these nutrients in soil–plant-animal continuum (Raju et al., 2022) are important to declare the requirements of livestock as well as human.
Microbes have been associated with soil, livestock and humans for aeons. From the evolution of life through endosymbiosis, to the complex ecological associations of microbes with the environment and their association with living beings in the present era, microbes orchestrate life on earth (Yergeau et al., 2008). Undoubtedly, microbes and their cellular products (enzymes, metabolites) have tremendous industrial applications and commercial value. These “invisible” microbes control several biogeochemical and ecological processes and catalyze biotransformation of raw materials into products of commercial value. The earth is endowed with trillions of microbial species. Of this enormous number, about 99.99 % of microbes are considered to have been either undiscovered or unculturable (Bomar et al., 2011). It is estimated that the number of microbial species on Earth exceeds the number of stars in our galaxy. The total estimated number of archaeal and bacterial cells on earth is 4–6 × 1030 cells, making microbes the predominant life forms on our planet (Flemming and Wuertz, 2019). An estimated 1 × 10-22 to 1 × 10-20 DNA sequences (of the total available DNA sequences on earth) have been successfully sequenced thus far (in terms of sampling microbial diversity), making it a remarkable number that is close to zero. The major problem with isolation of microbes from their natural habitat is that they die as soon as they are removed from the ecological niches that foster their growth and multiplication and hence, the majority of microbes are ‘unculturable’ (Bodor et al., 2020).
The field of metagenomics deals with the genomic study of uncultured microorganisms. Bioinformaticians deal with the daunting task of matching genomes of already known microbial strains with millions of new and as yet, undiscovered genome sequences of new (previously uncharacterized) microbes during genomics analyses. Metagenomics, as a field, has gathered significant momentum in the recent years, and has been a hot research field in science for almost two decades. Microbiome studies have shown the impact of imbalances in gut microbiota homeostasis (dysbiosis) on human health, ageing and metabolism (Belizário et al., 2018). Gut dysbiosis has significant direct and indirect health consequences like depression, cancer, obesity, inflammatory disorders and neurodegenerative diseases; hence, a clear understanding of the factors which lead to dysbiosis and discovery of remedial measures to restore eubiosiscan greatly improve health and nutrition (Hrncir, 2022).
In the domain of livestock health, the gut microbiome has been found to possess a phenomenal impact on digestion, metabolism, gut health, brain vigour and immunity (O’Hara et al., 2020). There is little known about the sheep intestine microbiota and their role in host immunity, metabolism, and physiology. A study which focused on the bacterial communities present in ten distinct sites within the gastrointestinal tracts of dairy cattle revealed the presence of 542 genera which belonged to 23 phyla, with significant spatial heterogeneity in the composition, species abundance and diversity of the gut microbiota. Moreover, the ability of ruminants to digest complex fibres in their diet is directly linked to the microbiome composition of their rumen and can influence feed efficiency as well as feed conversion ratio (McLoughlin et al., 2020). These indices can influence several outcomes like ageing/lifespan, lactation, behaviour, physiology as well as animal immunity. Sheep are reared for milk as well as meat. Gut microbiota can influence the quality of meat as well as milk. It is well-known that small changes in the diet can lead to drastic alterations in gut microbial composition (Beam et al., 2021) which in turn, can influence measurable indices like milk and meat quality. Soil microbiome is perhaps the most complicated and heterogeneous among all microbiomes. Since grass and hay (and grains/nuts) are fed to animals, the quality of the soil microbiome can influence the quality of feed, and hence, a complex relationship can exist between feed composition, gut microbiome homeostasis and desirable outcomes - like livestock health, lifespan as well as milk and meat quality (Wang et al., 2022). Feed composition alone has been reported to affect the gut microbial composition in ruminants. Geo-climatic conditions have a remarkable effect on the soil microbiome because seasonal variations and climatic changes can rapidly alter the microbiome. These insights can also improve our knowledge of sheep (host) - microbe interactions and enable the augmentation of milk and meat quality. Through advancements in sequencing like next generation sequencing (NGS), the field of metagenomics has grown tremendously (Yen and Johnson, 2021) and thereby, it is possible to identify new organisms (which are still considered unculturable) without even directly culturing them in the laboratory.
Therefore, this study was conducted: (a) to decipher the relationship between geoclimatic conditions, feed composition, soil microbiome, as well as soil quality (and mineral content) and (b) to study the influence of these variables on the composition of sheep gut microbiota in three agro-ecologically distinct districts of South India in two states, Telangana (Ranga Reddy District) and Andhra Pradesh (Vizag and Krishna Districts). It is hypothesized that a few of the methanobacteria responsible for the major gas emission can proliferate better in specific feeds. This study is one of its kinds in exploring the relation between the feed and the gut microbiota compared across three districts of Andhra Pradesh and Telangana. These findings can have valuable applications in agriculture and animal husbandry by leading to a better understanding of factors which influence feed quality and thereby, gut microbial composition.
2 Materials and methods
2.1 Description of study area
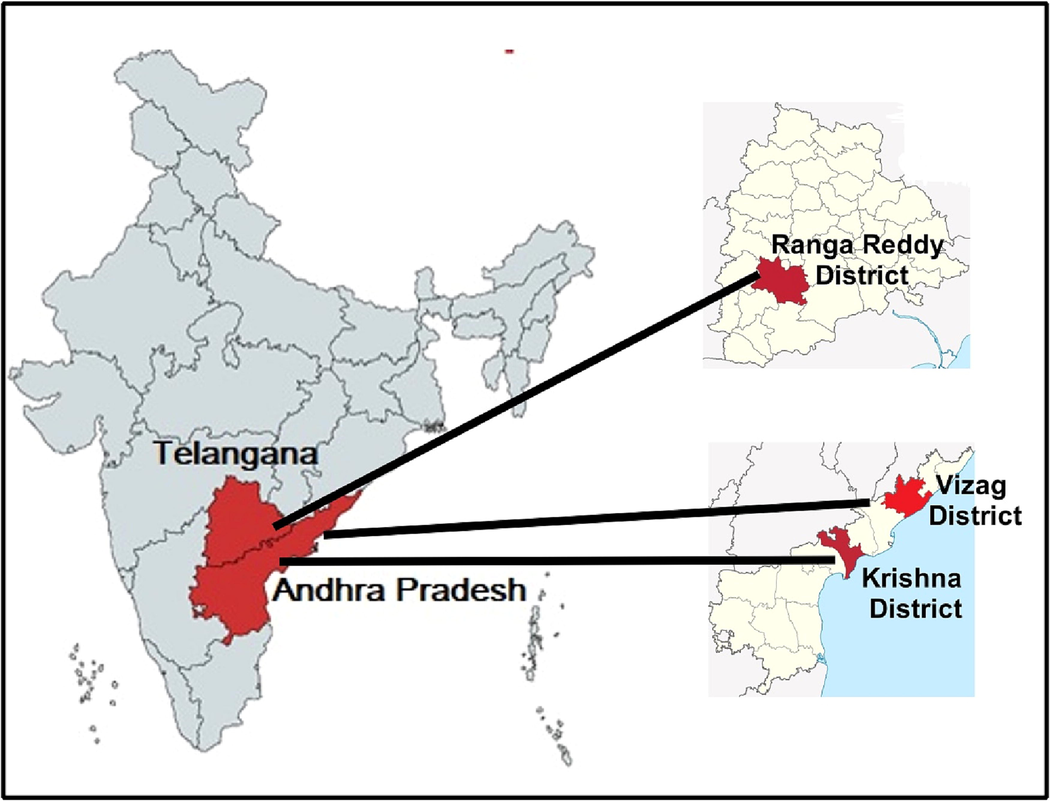
The research was conducted in 3 agro-ecologically distant areas as indicated in the Fig. 1 and Table 1. They were (i). Nunaparthi village, Atchutapuram Mandal in Visakhapatnam district; (ii). Nadakuduru village, Challapalli Mandal in Krishna district in Andhra Pradesh, and (iii). Gadda Mallaiah Guda village, Yacharam Mandal in Ranga Reddy district of Telangana, India. Climatic factors under the study area are variable rainfall (high/low) with similar temperature throughout the year, however, geographic zones are near mean sea level (MSL) and 600 m above MSL (Table 1). These factors have been considered because majority of rainfed regions falls under these zones only.
-
Location of the experiment – Three different districts located in Andhra Pradesh and Telangana states of India were selected for this current study. The latitude of Atchutapuram (Vizag Dt.), Andhra Pradesh, India is 17.686013° N, and the longitude is 83.008769° E. The latitude of Challapalli (Krishna Dt.), Andhra Pradesh, India is 16.1148° N, and the longitude is 80.9291° E. The latitude of Yacharam (Ranga Reddy Dt.), Telangana, India is 17.0450° N, and the longitude is 78.6597° E.
| Mandal (Area) | Elevation (m) | Annual avg. rainfall (mm) | Avg. minimum temp. (°C) | Avg maximum temp. (°C) |
|---|---|---|---|---|
| Atchutapuram (Vizag Dt.) |
37 | 956 | 10 | 46 |
| Challapalli (Krishna Dt.) | 10 | 1082 | 20 | 38 |
| Yacharam (Ranga Reddy Dt.) | 632 | 643 | 8.94 | 42.06 |
2.2 Collection of samples
Samples of soil (n = 30) at a depth of 20 cm were collected along with grass/ forage samples (n = 10 each) randomly for analysis especially from the grazing areas of sheep (n = 18). These grazing areas comprise of naturally growing grasses and crop harvested fields. Samples of dry fodder offered to the animals were collected randomly from 20 farmers in each village. The ruminal fluid of two of the sheep from each group of animals were taken using trocar and canula insertion at paralumbar fossa site for metagenomic analysis.
2.3 Sample preparation and analytical methods
The soil samples were air dried, crushed, and sieved with a 2 mm sieve. Mehlic-1 extracting solution (0.05 N HCl + 0.025 N H2SO4) was used to extract these processed samples. Feed samples were dried in an oven at 80 °C for 24 h, pulverized to 1 mm in size, and stored in sealed bags until analysis. Microwave digestion was used to digest these samples, which consisted of 5 mL concentrated HNO3 and 1 mL concentrated HCl. Further, the total volume of mineral extract was made to 25 mL with deionized water.
2.4 Soil attributes analysis
The soil samples were analysed for pH, EC, Organic carbon (OC), P, K, Zn, Fe, Cu and Mn. In soil testing, pH was measured by using pH meter, Electrical conductivity (EC) was determined by using conductivity meter, Organic Carbon (OC) was determined by using titration method (Walkley and Black, 1934), Phosphorous (P) by colorimetry in Mehlich 1 extracting solution (Kamprath and Watson, 1980), Potassium (k) was determined by using flame photometer and micro-nutrients, like Zinc (Zn), Iron (Fe), Manganese (Mn) Copper (Cu) estimation was done by using ICP-MS (Park et al., 2015).
2.5 Experimental animals and their management
Andhra Pradesh and Telangana constitute the major rainfed area of India. Nellore breed of sheep is fundamentally dispersed in Andhra Pradesh and Telangana. These can be raised in any portion of south India, given their great versatility for the Southern Indian environment. This breed is the tallest among any remaining breeds in India which makes it most popular and adapted breed of sheep in southern peninsular region. Since, the growth rate of Nellore breed is the highest amongst Indian breeds as well as very popular and found in almost all agro-climatic zones of the states, this breed was chosen for the study. The male Nellore sheep of 3–4 months age and average body weight of 8.0 to 9.0 kg with each group having 6 animals (n = 18) were randomly selected at the farmer’s field for the study. All the animals under these 3 different locations (Visakhapatnam, Krishna and Ranga Reddy districts) were allowed for extensive grazing of 6 h followed by offering dry fodder during night hours in the shelter after grazing which consisted of group A1: sorghum stover (1.5 kg each) daily in Vizag district, group A2: groundnut haulms (1.5 kg each) daily in Krishna district and group A3: red gram chunni (1.5 kg each) daily in Ranga Reddy district to mimic the prevailing sheep feeding system in the areas of Andhra Pradesh and Telangana for a period of 90 days from 30th April to 30th July 2020. These dry fodders were common to those agro-ecological areas which farmers are using. In the same period, selected sheep were offered uniformly 250 gms of concentrate ration daily having CP-14 % and TDN-70 % so as to ensure balanced ration to all the experimental animals with ad libidum availability of clean drinking water.
In vitro true digestibility of the nutrients presents in these dry fodder was analysed using the Daisy Incubator, Ankom in F57 filter bags. The % digestibility was calculated based on following formula (1).
Where,
W1 = Bag tare weight, W2 = Sample weight, W3 = Final bag weight after In Vitro treatment, C1 = Blank bag correction (final oven-dried weight/original blank bag weight).
2.6 Metagenomic analysis
2.6.1 Collection of samples
Feed intake data was collected by the farmer in group using the feed rejection weight. The weekly body weight of animals was taken to establish growth rate and feed conversion ratio (DM of feed required to produce unit kg of body weight). The ruminal fluid of one of the sheep from each group of animals was taken for metagenomic analysis.
2.6.2 Metagenomic sample sequencing:
The bacterial DNA was extracted for further analysis. The most widely used ‘universal primer’ based on V3-V4 region of 16S rRNA was used for analysing the diversity of microbes. The choice of 341F and 785R primers is because of the hypervariable nature of V3-V4 region which provides high heterogeneity and hence a very wide coverage of the diverse species in the sample (Bukin et al., 2019). Illumina MiSeq platform was used to amplify and sequence V3-V4 region of 16S rRNA from the isolated sample and the primer sequences used were:V3v4f: 5′cctacgggnggcwgcag3′V3v4r: 5′gactachvgggtatctaatcc3′
Further, for the development of sequencing libraries, barcoded adapters P5 and P7 were used (Schweyen et al., 2014).
P7 adapter read1 AGATCGGAAGAGCACACGTCTGAACTCCAGTCA.
P5 adapter read2 AGATCGGAAGAGCGTCGTGTAGGGAAAGAGTGT.
The amplified products were then trimmed and processed with the help of Trim Galore to remove degenerate primers, adapters and low-quality bases. Only high quality contigs, achieved after required processing, were considered for merging to get the final sequence.
2.7 Statistical analysis
The data was analysed, and statistical significance was tested using the SAS 9.2 software. GraphPad Prism v. 5.01 software was used to plot the graphs (Steel et al., 1997).
3 Results
3.1 Soil analysis
The soil of selected regions was tested for common nine parameters namely; pH, Electrical conductivity (EC), Organic carbon (OC), P, K, Zn, Fe, Cu and Mn (Table S1). Composition was calculated for the above minerals from the three sites Vizag, Krishna and Ranga Reddy districts. No significant changes at 0.05 percent confidence level were observed for qualitative values of the chemical compositions at different seasons. However, the concentration of Cu and OC were significantly different for the three sites at 0.04 and 0.02p-value, respectively (Fig. 2). The concentration throughout the three seasons varied for the three sites. It was observed that Cu content gradually fell down in the soil collected from Vizag and Krishna district while had no considerable change at Ranga Reddy. Organic carbon content from Vizag showed a similar indifferent pattern while there was a significant change observed for samples from Krishna and Ranga Reddy over the three seasons.

-
Soil analysis of the experimental sites – The three sites/districts selected for the current study were analysed for their soil properties and significant differences were observed in only Cu content (shown on left) and ‘organic carbon’ (content shown on right).
3.2 Fodder analysis
Characterization of the three samples of sheep rumen from Vizag, Krishna and Ranga Reddy were further confirmed using different types of fodder (Table 2). These fodders were characterized based on the concentration of Ash, neutral detergent fiber (NDF), acid detergent fiber (ADF), Zn, Mg, Mn, Fe and Ca. A digestibility index was also computed which showed significant difference (0.02) between the three sites. The significant difference (p-value) for ADF varied between fodder samples from Krishna, Ranga Reddy (0.01) and Krishna, Vizag (0.03). The ADF value for Ranga Reddy and Vizag samples were however similar. Except for digestibility no other values were found to be uniformly different across all the three samples. Most of the values were similar amongst the sites except for few isolated cases. The ash value and Cu was significantly different between fodder samples from Krishna and Vizag. Fe value was found to be different only between samples from Ranga Reddy and Vizag.
| Experimental Zones | Vizag district (A1) | Krishna district (A2) | Ranga Reddy district (A3) |
|---|---|---|---|
| Nutrient composition | Feed | ||
| Sorghum stover | Groundnut haulms | Red gram chunni | |
| Crude Protein (CP), % | 4.6 a ± 0.21 | 9.6b ± 0.32 | 15.6c ± 0.65 |
| Total Digestible Nutrients (TDN), % | 56 ± 2.3 | 57 ± 3.1 | 59 ± 2.8 |
| Organic Matter (OM), % | 92 ± 3.4 | 93 ± 3.3 | 93 ± 2.3 |
| Neutral Detergent Fiber (NDF), % | 62.5c ± 2.8 | 55.2b ± 1.9 | 48.6a ± 1.8 |
| Acid Detergent Fiber (ADF), % | 38.1b ± 1.8 | 48.1c ± 1.9 | 31.6a ± 1.2 |
| Cellulose, % | 32.1b ± 1.8 | 36.4c ± 1.3 | 30.5a ± 1.1 |
| Hemicellulose, % | 24.6c ± 1.2 | 21.5b ± 0.9 | 15.2a ± 0.6 |
| Lignin, % | 4.6b ± 0.2 | 5.9c ± 0.4 | 3.2a ± 0.3 |
abcDifferent superscripts in a row vary significantly at 5% level of significance, and the ones without superscripted letters do not vary significantly. Mean values of triplicates are represented.
The digestibility analysis suggested that the digestibility of nutrients especially crude protein which is the most important factor to achieve growth rate was highest in case of A3 feed. However, fibre digestibility was highest in A1 followed by A2 and A3.
3.3 Soil bacterial composition
The bacterial CFU/g values for soil samples from Vizag, Krishna and Ranga Reddy were 6.6x10⁴, 5.0x10⁵ and 7.1x10⁵, respectively.
3.4 Nutrient flow from soil to animal
The rainfall pattern in the selected village is falling in the zone of high rainfall (around 1000 mm in Challapalli and Atchuthapuram villages) and low rainfall (around 600 mm in Yacharam village) with two different zones of near sea level (Challapalli and Atchuthapuram villages) and 600 m above sea level (Yacharam village) in elevation under semi-arid zone. The nutrient flow soil plant animal continuum in these zones differed as highlighted under Table 4.
Zone I constitute areas under high rainfall and near sea level; Zone II constitute areas under low rainfall and 600 m above sea level.
Overall, zone II had better exhibition of continuum by higher Pearson correlation coefficient values. Soil-plant-animal continuum is maintained for Cu significantly in both the zones, however, for other micro-minerals, only fodder-sheep continuum was perfectly working in both the zones due to prevailing extensive system of rearing in the study area.
3.5 Metagenomic sampling and sequencing
Metagenomic samples of sheep rumen were extracted from samples belonging to Vizag (SRV), Krishna (SRK) and Ranga Reddy (SRR). DNA (25 ng) was extracted for analysing each of the samples. 16S rRNA V3-V4 region was amplified and sequenced using IlluminaMiSeq platform. A summary of the raw sequence data and its quality is presented in Table 5. The value of Q20 > 99 % and that of Q30 > 90 % indicates high fidelity in sequencing.
3.6 Processing reads and taxonomic profiling
Post-sequencing, FastQC and MultiQC were used to check the quality of the generated reads. The associated reads and the Q-20, 30 quality data can be seen in the table above (Table 4). Trimmomatic (Del Fabbro et al., 2013) was used to remove adapter sequences and other low-quality bases. Mothur (Chappidi et al., 2019) was used to first form contigs with sizes ranging from 300 to 532 bp. Further processing was performed by removing chimeric sequences using the UCHIME (Edgar et al., 2011). Operational taxonomic units (OTUs) were identified using Silva SSU and Greengenes pipelines from the MG-RAST server. Simultaneously, standalone toolMetaPhlAn (Segata et al., 2012) was employed to evaluate OTU’s from the assembled contigs. Gene families in correlation with the identified OTUs were predicted using PICRUSt (Douglas et al., 2018) program.
Alpha diversity was analysed for the three samples. The following indices were used to measure the species richness and relative abundance (Table 6).
The highest OTU richness was observed for SRR with 352 different species followed by SRK and SRV. Both the Chao1 and ACE index were indicative of high diversity from the abundance data in SRR compared to the other two sites. Shannon diversity index showed both richness and relative abundance of SRR to be the highest compared to the others. The species in SRR were observed to be more evenly distributed. Simpson’s diversity index measured the number of species and their relative abundance with SRR showing the highest compared to the other two.
3.7 Phylogenetic diversity
Phylum and genus abundance were computed and compared amongst the three samples (Fig. 3). Bacteroidetes and Firmicutes were the most abundant group in all three samples. Euryarchaeota, Proteobacteria and Spirochaeteswere the other common phyla amongst the sample groups. Amongst the topmost abundant phylum, the unique phyla in SRK were Patescibacteria, Elusimicrobia and Kiritimatiellaeota. SRV was composed of Verrucomicrobia and Actinobacteria. Synergistetes was the only unique phylum in SRR. This sample showed similarity to largely to SRV. Genus level showed significant changes overall the three sites. SRK was primarily abundant with unclassified bacterial genera. Amongst the top ten five belonged to unclassified genera groups. SRV and SRR showed no unclassified groups. Sulfurospirillum, Sphaerochaeta and Methanobrevibacter were amongst the highly abundant genera in SRV while Petrimonas, Pseudomonas, Oscillospira were the top three most abundant genera in SRR. Species diversity of all organisms obtained from the rumen samples are presented in supplementary figures S1 to S3.

-
Species abundance in sheep rumen samples from the three experimental sites. Sheep rumen samples were analysed for the microbial flora and the top 10 abundant species are presented belonging to sheep from Vizag, Krishna and Ranga Reddy districts.
Species level characterization for SRR showed Petrimonas sulfuriphila to be the most abundant species along with Macellibacteroides fermentans and Desulfovibrio vulgaris. SRV had Macellibacteroides fermentans, Acholeplasma brassicae and Petrimonas sulfuriphila to be the most abundant species amongst others. Riemerella sp. IPDH 98/90 was the most abundant bacterial species in SRK. Other species were namely Porphyromonas catoniae and uncultured bacterial species.
3.8 Feed conversion ratio
Table 7 indicates the differences in feed conversion ratios across the three selected regions. It is evident that the feed conversion ratio is highest for sheep from Vizag and the least from Ranga Reddy which also inversely correlates with average daily gain (Table 8). This suggests that less feed is required to produce unit kg of live weight in Ranga Reddy district as compared to Krishna and Vizag district. Similar trend was observed in case of digestibility of nutrients, mostly crude protein (Table 3).
| Experimental Zones | Vizag district (A1) | Krishna district (A2) | Ranga Reddy district (A3) |
|---|---|---|---|
| Nutrient composition | Feed | ||
| Sorghum stover | Groundnut haulms | Red gram chunni | |
| Crude Protein (CP), % | 51.3 a ± 3.45 | 58.23b ± 4.71 | 62.3c ± 2.12 |
| Organic Matter (OM), % | 56.3 ± 4.4 | 57.6 ± 5.3 | 58.6 ± 6.3 |
| Neutral Detergent Fiber (NDF), % | 42.5c ± 3.8 | 45.2b ± 3.9 | 48.8a ± 3.8 |
| Acid Detergent Fiber (ADF), % | 35.3b ± 3.6 | 38.6c ± 3.9 | 32.2a ± 2.2 |
| Cellulose, % | 35.3 ± 3.8 | 36.2 ± 3.3 | 35.5 ± 3.1 |
| Hemicellulose, % | 32.6 ± 3.2 | 31.5 ± 2.9 | 33.2 ± 2.6 |
| Lignin, % | 34.6 ± 2.2 | 35.2 ± 2.4 | 33.9 ± 2.3 |
abcDifferent superscripts in a row vary significantly at 5% level of significance, and the ones without superscripted letters do not vary significantly. Mean values of triplicates are represented.
| Mineral | Pearson correlation value (r) | |||||
|---|---|---|---|---|---|---|
| P | K | Zn | Fe | Cu | Mn | |
| Soil-fodder | ||||||
| Zone I | 0.235 | 0.089 | 0.156 | 0.414* | 0.423* | 0.317 |
| Zone II | 0.189 | 0.124 | 0.167 | 0.372* | 0.572** | 0.232 |
| Fodder-sheep | ||||||
| Zone I | 0.396* | 0.630** | 0.623** | 0.709** | 0.910** | 0.455* |
| Zone II | 0.415* | 0.654** | 0.634** | 0.728** | 0.942** | 0.541** |
| Soil-sheep | ||||||
| Zone I | 0.141 | 0.191 | 0.161 | 0.148 | 0.668** | 0.185 |
| Zone II | 0.213 | 0.214 | 0.212 | 0.248 | 0.826** | 0.312 |
*Significant at 5% level of significance; **Significant at 1% level of significance.
| Sample ID | No. of reads | Read Length | GC% | %Bases > Q20 | %Bases > Q30 |
|---|---|---|---|---|---|
| SRV | 103,762 | 301 | 53 | 99.75 | 92.08 |
| SRK | 295,176 | 301 | 53 | 99.27 | 92.73 |
| SRR | 111,870 | 301 | 52 | 99.81 | 93.68 |
| Sample | OTU richness | Chao1 | ACE | Shannon | Simpson |
|---|---|---|---|---|---|
| SRV | 216 | 234 | 235.02 | 3.45 | 0.92 |
| SRK | 280 | 386.73 | 379.77 | 3.74 | 0.95 |
| SRR | 352 | 487.30 | 472.95 | 3.68 | 0.94 |
| Particulars | Vizag district (A1) | Krishna district (A2) | Ranga Reddy district (A3) |
|---|---|---|---|
| Feed intake per day on DM basis (gm) | 454 | 476 | 483 |
| Feed intake in 90 days (kg) | 40.86 | 42.84 | 43.47 |
| Live weight gain in 90 days (kg) | 3.74 | 5.11 | 6.94 |
| Feed conversion ratio (FCR) | 10.93 | 8.38 | 6.26 |
| Particulars | Vizag district (A1) | Krishna district (A2) | Ranga Reddy district (A3) |
|---|---|---|---|
| Initial body weight (kg) | 8.56 ± 0.54 | 8.97 ± 0.37 | 8.76 ± 0.24 |
| Final body weight (kg) | 12.3 ± 0.67 | 14.08 ± 0.74 | 15.7 ± 0.78 |
| Body weight gain in 90 days (kg) | 3.74 | 5.11 | 6.94 |
| Average daily gain (g/day) | 41.56a | 56.78b | 77.11c |
abcDifferent superscripts in a row differ at 5% level of significance, and the ones without superscripted letters do not vary significantly. Mean values of six replicates are represented.
4 Discussion
4.1 Soil-plant-animal analysis
The concentration of Cu and OC in the soil samples were significantly different for the three sites which suggests their probable role in making the difference at livestock gut metagenomic levels. These concentrations even varied throughout the three seasons in the study area. Such differences were maintained even for the computed digestibility index for the three study areas. The soil microbial values (CFU/g) were again significantly different for all these sites (6.6x10⁴, 5.0x10⁵ and 7.1x10⁵, respectively). This soil–plant-animal continuum has been reported recently suggesting their role in final digestibility and productivity outcomes of sheep (Raju et al., 2022). The pH of the soil influences the availability of Cu to plants. The current study discovered that the Cu level is beneficial to continuum since Cu in soil solution is present as cupric ions, which are available also to the plants. The continuum was found to be best in zone II, where soil pH is slightly acidic, reducing Cu adhesion to soil components and increasing Cu in soil solution as cupric ions, which plants can use. Fe availability to plants is also strongly influenced by soil pH; when pH falls, Fe availability to plants increases (Thornton and Webb, 1980). Fe is available to plants in its reduced form (Fe2+), and if the soil pH is acidic, more Fe3+ is reduced to Fe2+, resulting in greater availability to plants. The micro-nutrients as well as gut culture has an important role in imparting better digestibility of nutrients (Kwak et al., 2016) which was exhibited in this case where the Cu and OC content was maximum in Ranga Reddy district and accordingly the FCR was maximum in case of Ranga Reddy district only.
4.2 Role of climate and geographical location
In the three villages (Yacharam, Challapalli and Atchuthapuram) which belong to three different districts, the crop residue-based feeding which is the most prevalent feeding management system in rainfed areas, may have changed based on the prevailing farming situation in the local region/village and soil characteristics. Among the three villages, two are near sea level in elevation, while third village (Yacharam, Ranga Reddy Dt., Telengana) was situated nearly 600 m above sea level. These villages, apart from differing in mean sea level, vary in annual mean rainfall with Atchutapuram (Vizag District) and Challapalli (Krishna District), Andhra Pradesh falling under high rainfall and Yacharam (Rangareddy District) under low annual mean rainfall. While it is not clear if a height of just 600 m above sea level can influence soil microbial composition/microbiome, high-altitude was found to alter the gut microbiota in faeces of the lizard Sceloporus grammicus (mesquite lizard); the high-altitude ecosystems (such as mountains) have more rigorous effects on microbes than the low-altitude plains, mostly because of dietary factors (Montoya-Ciriaco et al., 2020). While livestock can be reared in almost every climatic condition, sheep and goats are more adapted to dry/ semi-arid conditions and typically graze on grass and short plants in the plains. Based on the geographic location, annual rainfall, humidity, temperature and other variations (such as land elevation), the growth of both the animals and the gut microbes that they harbour can be affected. For example, the quality of cheese obtained from mountainous regions of Serbia was much different from that of cheese obtained from lowland areas in Croatia; these differences in quality are attributed to the region-specific microbes which were used as starter cultures (Golić et al., 2013). Moreover, the climatic conditions directly influence the soil microbiome and hence, soil composition (mineral and nutrient availability) and the climate can have dramatic effects on the soil microbial communities. The influence of day length conditions in effecting species differences in gut microbiota composition (bacteria, protozoans and fungi) was studied in Soay sheep (Thomas et al., 2019); the results showed that higher day length proportionately increased the concentrations of anaerobic fungi and ciliated protozoa in the large colon and rumen of the sheep, while bacterial composition remained unaltered. At longer days, animals feed for a longer duration and animals eat more rapidly and this leads to increase in rumen capacity as well as alterations in rumen retention time (of feed). The soil microbiome, as mentioned earlier, is one of the most affected microbiomes, as sunlight, heat, rainfall and soil mineral composition can significantly alter the microbial composition of soil. Hence, soil microbiota tends to vary from one region to another and this may be one of the most critical factors in influencing agriculture and crop yields (Bonanomi et al., 2020). In this study, a total of nine soil parameters were tested and among these significant (p < 0.05) variations were observed only in the Cu and OC content of the soil from the three study regions, but there were no significant alterations in all the other parameters. A critical feature in livestock rearing is the unique nutritional and climatic requirements that are required for better growth and sustenance. In animal nutrition, minerals come not only from water, but also from plants (which absorb minerals from the soil). There is a two-pronged effect that soil Cu can have: a) it can influence plant/feed quality (in plant tissues, fruits and seeds) and b) Cu is an essential micronutrient in ruminants, especially in wooly sheep. Cu deficiency is responsible for anaemia, cardio-vascular health defects, bone disorders, wool/ hair abnormalities, infertility, etc. and goats are not as affected as sheep by slightly higher Cu availability (Hill and Shannon, 2019). Organic carbon levels also influence microbial metabolism; for example, low soil organic carbon levels are correlated with higher oxidation reactions of methanol, hydrogen, formate, sulphide, ammonia as well as nitrite/nitrate reactions catalyzed by soil as well as ruminant gut microbiota (Carnevali et al., 2021).
4.3 Growth dynamics of sheep in relation with feed composition and feed conversion efficiency
The results demonstrate that the diet given to sheep had remarkable impact on the weight of the sheep after 90 days of feeding 1.5 kg each of either sorghum stover (A1), groundnut haulms (A2) or red gram chunni (A3). The initial body weight of all the sheep were in the range of 8.76 kg (on average, in the three villages). Feed A3 led to significant growth enhancement of the sheep when compared to the other two feeds; animals fed with A3 feed gained 79.2 % weight (on average), adding almost 7 kg in 90 days. Feed A1 and A2 caused a change in body weight by 43.6 and 56.9 %, respectively. This might be attributed to better digestibility of nutrients, especially CP also in case of Feed A3. When comparing the feed conversion ratios (FCR) of the three groups, it is apparent that the composition of carbohydrates, proteins and lipids present in the three feed types (differences only in dry fodder grown in the respective agro-ecological region) had a key role. The A1 feed contained the least CP (4.6 %), while A3 contained the highest (15.6 %). Also, A3 contained a very slightly higher (59 %) TDN content when compared to the other two feed types. NDF was much higher in A1 (62.5 %), while it was much lesser in A3 feed (48.6 %). Cellulose and lignin content was highest in A2 feed (36.4 and 5.9 %, respectively), but a slightly higher hemicellulose content was seen in A1 feed (24.6 %). ADF was much higher in the A2 feed. These data reveal that feed composition variability may have influenced the FCR and weight gain outcomes that were observed. Feed composition is known to influence sheep growth, as demonstrated previously by several independent reports. Gut microbiota are considered to be a “forgotten organ” which has been demonstrated to influence host phenotypes (such as host health and behaviour) via diverse avenues involving neural, immune and endocrine pathways. There is a good correlation between gut microbiota (high alpha diversity and higher composition of beneficial microbes) and host phenotypes like immunity, neurological well-being and endocrine pathways and hence, fecal transplantation has been considered to be one avenue to improve the population of healthy gut microbiota (Chen et al., 2021). Moreover, there is a direct relationship between feed conversion efficiency and rumen/gut microbiota composition in swine (Bergamaschi et al., 2020), rabbits (Velasco-Galilea et al., 2021), poultry/chicken (Bo et al., 2020) and fish (Salger et al., 2020). Gut homeostasis has been demonstrated to be a key factor in insect, fish, amphibian and mammalian health. FCR was 10.93, 8.38 and 6.26, respectively in response to A1, A2 and A3 feed types. Also, it must be noted that the animals consumed grass or green plants as they grazed through the daytime and that the A1-A3 feed were offered to them after their daytime grazing ended. FCR (kg feed dry matter intake per kg live mass gain) is a key measure that can depend on gut microbial diversity as one of the most important variables. In poultry and animal husbandry, the growth performance of quality breed animals which are fed identical diets (and reared in the same conditions) can often vary and this leads to economic loss and management issues (Stanley et al., 2012).
4.4 Alpha diversity and metagenomics results
Alpha diversity is defined as the diversity of species within a community, while beta and gamma diversity pertain to species diversity between the community and between regions, respectively. Equitability index and Alpha diversity was analysed for these samples and six indices were used to measure the species richness and relative abundance. In this work, the alpha diversity was found to be higher for the rumen samples from SRR region (352 observed) and was much lower in the SRK (2 8 0) and SRV (2 1 6) samples. Alpha diversity was found to increase by 50–70 % in offshore marine environments during the Ordovician period. This measure of organismal diversity provides information on diversity at the habitat level and is useful for characterization of microbial communities in metagenomics studies. The two components of alpha diversity are species richness and equitability indices. These indices are greater when the communities have higher numbers of species (Sharma et al., 2017).
The highest operational taxonomic unit (OTU) richness was observed for SRR with 352 different species followed by SRK and SRV, which had 280 and 216 diverse species. Both the Chao1 and ACE index were indicative of high diversity from the abundance data in SRK compared to the other two sites. Shannon diversity index showed both richness and relative abundance of SRR to be the highest compared to the others. The species in SRR were observed to be more evenly distributed. Simpson’s diversity index measured the number of species and their relative abundance with SRR showing the highest compared to the other two. The Chao1 value estimates abundance of individual members which belong to a certain class within a given sample – which pertains to a particular site/location. There are several species which are represented by some individuals (which are rare species), while some species can be commonly represented within the sample. Chao1 estimates the presence of rare species and hence, from the result in the alpha diversity table (Table 5), it is clear that Chao1 values were high for the SRR, SRK and SRV samples.
Rare species may be represented either in the form of singletons or doubletons and hence,
where, Sest = number of classes, Sobs = number of species observed in a sample, F = number of singletons and G = number of doubletons.
A similar trend was seen for observed number of species and for Chao1 as the scores were in the order of SRR > SRK > SRV. A similar order/trend was also seen for ACE value, which estimates the richness for an OTU definition (Gotelli and Colwell, 2001). An OTU represents a cluster of 16S rDNA marker gene sequences which are similar by 97 % or higher (Edgar, 2018). The Shannon (H́) and Simpson’s (D1) diversity indices are also used to identify and interpret species richness in ecology. Shannon’s diversity score reveals the richness (abundance) as well as evenness within a species and helps in predicting the identity of the unknown individuals and therefore, the uncertainty in the system becomes lesser in a less diverse system which is dominated by either one or just a few species, as opposed to a multitude of species. A Shannon’s index value of 0 indicates that just one organism is present in the sample and a score of 1.0–3.5 indicates good ecological diversity within a population. Hence, gut rumen samples from animals reared in all three study regions in this work contained a good species diversity, as seen from the Shannon scores of > 3. When the number of species is large, there is more diversity and likewise, when the uniformity of individual distribution among species can also increase the diversity. In a scenario where each of the individuals belongs to a different species, it can tremendously increase diversity index. The Simpson’s index measures diversity by accounting for number of species present and the relative abundance of each species and hence, is an index of community diversity; values closer to 1.0 show high diversity and values closer to 0 indicate low diversity.
4.5 Identity of the organisms present in the population
Since, enteric methane gas production by ruminants are the major GHG source responsible for global warming (Moss et al., 2000), many governments consider that lowering methane production by ruminants can be an effective climate change mitigation strategy (Beauchemin et al., 2007). Hence, there is a new interest in formulating feed which can decrease methane production from domestic animals and cattle. Methane in ruminants is produced by methanogens (Archaebacteria) which are unculturable because of their unique metabolic requirements and sensitivity to oxygen. Apart from this, digestibility is the factor which govern the per kg emissions from small ruminants (Na et al., 2018) which has been taken as one of the components for anticipating lower emissions from such feeds.
The unique methanogens found in the population were – i) Methanobrevibacter millerae strain - ZA, ii) Methanobrevibacter woesei strain GS, iii) Methanocorpusculum bavaricum strain SZSXX2, iv) Methanocorpusculum labreanum strain Z, v) Methanosphaer astadmanac DSM 30191 strain MCB-3, vi) Methanobrevibacter arbophilus strain DH-1, vii) Methanobrevibacter gottaschalkii strain HO and viii) Methanobrevibacter ruminatum M1. Methanogens reduce hydrogen and carbon dioxide that is produced by other fermentative organisms which are present in the ruminal microbiome to form methane. Many anti-methanogenic compounds like plant secondary metabolites, nitrate and 3-nitrooxy propanol are known to provide promising results in curbing methane production from ruminants. However, despite these advancements, such compounds have shown adverse effects in ruminants at high doses which are effective at mitigating methane production. Hence, with the current observations, it can be presumed that altering the diet can help in reducing the emission of methane by lowering the availability of both reduced equivalents and CO2/H2 emission by the ruminal microflora. In the A1 vs A2 vs A3 feed comparison, methanogens could be more abundant in animals fed with the A3 feed since a significantly (p < 0.05) higher alpha-species from the Ranga Reddy district samples were observed. These species might either be contributing as a methanogen or an aerobic species aiding in the production of H2 that would add to the methane production eventually.
5 Conclusion
An exploratory study was carried out to identify the edaphic, plant based or other climatic factors responsible for differential feed conversion ratio and microbial diversity responsible for feed utilization efficiency as well as methane emission in different regions of rainfed regions. Edaphic differences as well as climatic factors (rainfall and mean sea level) were reflected in final digestion of feed as well as gut microbial composition in the Nellore sheep. The feed composition (mainly protein content and mineral content) resulted into differential feed conversion ratio in the test animals which suggested how these regional feed composition differences could be responsible for differences in livestock economy of the region. India is blamed to be one of the largest anthropogenic emitter of enteric methane emission from ruminants due to its huge population, where such regional crop-residue based feeding system could provide the opportunity to reduce the emissions from them. However, such claims need to be estimated under climatic chamber conditions to vet the use of such strategies in a country like India where feed and fodder scarcity is to the tune of 40 %.
Acknowledgements
The authors extend their appreciation to the Researchers supporting Project number (RSP2023R367), King Saud University, Riyadh, Saudi Arabia.
Funding
The authors extend their appreciation to the Researchers supporting Project number (RSP2023R367), King Saud University, Riyadh, Saudi Arabia.
Declaration of Competing Interest
The authors declare that they have no known competing financial interests or personal relationships that could have appeared to influence the work reported in this paper.
References
- Effect of diet and dietary components on the composition of the gut microbiota. Nutrients. 2021;13:2795.
- [Google Scholar]
- Methane abatement strategies for cattle: lipid supplementation of diets. Can. J. Anim. Sci.. 2007;87:431-440.
- [Google Scholar]
- Gut microbiome dysbiosis and immunometabolism: new frontiers for treatment of metabolic diseases. Mediators Inflamm.. 2018;2018:2037838.
- [CrossRef] [Google Scholar]
- Gut microbiome composition differences among breeds impact feed efficiency in swine. Microbiome. 2020;8:1-15.
- [Google Scholar]
- Coprophagy prevention alters microbiome, metabolism, neurochemistry, and cognitive behavior in a small mammal. ISME J.. 2020;14:2625-2645.
- [Google Scholar]
- Challenges of unculturable bacteria: environmental perspectives. Rev. Environ. Sci. Biotechnol.. 2020;19:1-22.
- [Google Scholar]
- Directed culturing of microorganisms using metatranscriptomics. MBio. 2011;2:e00012-e111.
- [Google Scholar]
- Repeated applications of organic amendments promote beneficial microbiota, improve soil fertility and increase crop yield. Appl. Soil Ecol.. 2020;156:103714
- [Google Scholar]
- Trace element uptake and accumulation in the medicinal herb Hypericum perforatum L. across different geolithological settings. Biol. Trace Elem. Res.. 2019;189:267-276.
- [Google Scholar]
- The effect of 16S rRNA region choice on bacterial community metabarcoding results. Sci. Data. 2019;6:190007
- [Google Scholar]
- Meanders as a scaling motif for understanding of floodplain soil microbiome and biogeochemical potential at the watershed scale. Microbiome. 2021;9:1-23.
- [CrossRef] [Google Scholar]
- Using Mothur to determine bacterial community composition and structure in 16S ribosomal RNA datasets. Curr. Protoc. Bioinforma.. 2019;67:83.
- [Google Scholar]
- An extensive evaluation of read trimming effects on Illumina NGS data analysis. PLoS One. 2013;8:85024.
- [Google Scholar]
- Predicting the functional potential of the microbiome from marker genes using PICRUSt. Microbiome Analysis. Humana Press 2018:169-177.
- [Google Scholar]
- Updating the 97% identity threshold for 16S ribosomal RNA OTUs. Bioinformatics. 2018;34:2371-2375.
- [Google Scholar]
- UCHIME improves sensitivity and speed of chimera detection. Bioinformatics. 2011;27:2194-2200.
- [Google Scholar]
- Bacteria and archaea on Earth and their abundance in biofilms. Nat. Rev. Microbiol.. 2019;17:247-260.
- [Google Scholar]
- Evaluation of lactic acid bacteria and yeast diversity in traditional white pickled and fresh soft cheeses from the mountain regions of Serbia and lowland regions of Croatia. Int. J. Food Microbiol.. 2013;166:294-300.
- [Google Scholar]
- Copper and zinc nutritional issues for agricultural animal production. Biol. Trace Elem. Res.. 2019;188:148-159.
- [Google Scholar]
- Gut microbiota dysbiosis: triggers, consequences, diagnostic and therapeutic options. Microorganisms. 2022;10:578.
- [Google Scholar]
- Kamprath, E.J., Watson, M.E., 1980. Conventional Soil and Tissue Tests for Assessing the Phosphorus Status of Soils, in: Khasawneh, F.E., Sample, E.C., Kamprath, E.J. (Eds.), The Role of Phosphorus in Agriculture. American Society of Agronomy, Crop Science Society of America, Soil Science Society of America, pp. 433–469. https://doi.org/10.2134/1980.roleofphosphorus.c17.
- Effect of feeding mixed microbial culture fortified with trace minerals on ruminal fermentation, nutrient digestibility, nitrogen and trace mineral balance in Sheep. J. Anim. Sci. Technol.. 2016;58:21.
- [CrossRef] [Google Scholar]
- Rumen microbiome composition is altered in sheep divergent in feed efficiency. Front. Microbiol.. 2020;11:1981.
- [CrossRef] [Google Scholar]
- Dietary effects on gut microbiota of the mesquite lizard Sceloporusgrammicus (Wiegmann, 1828) across different altitudes. Microbiome. 2020;8:1-19.
- [CrossRef] [Google Scholar]
- Effects of feeding level on nutrient digestibility and enteric methane production in growing goats ({&}amp$\mathsemicolon$lt$\mathsemicolon$i {&}amp$\mathsemicolon$gt$\mathsemicolon$Capra hircus hircus) and Sika deer (Cervus nippon hortulorum) Asian-Australasian J. Anim. Sci.. 2018;31:1238-1243.
- [CrossRef] [Google Scholar]
- The role of the gut microbiome in cattle production and health: driver or passenger? Annu. Rev. Anim. Biosci.. 2020;8:199-220.
- [CrossRef] [Google Scholar]
- Quantitative mapping of trace elements in agate using LA-ICP-MS. J. Anal. Sci. Technol.. 2015;6:1-8.
- [CrossRef] [Google Scholar]
- Soil-plant-animal continuum concerning the certain micro-mineral status of indigenous sheep in hot semi-arid regions. Indian J. Anim. Res.. 2022;55:767-773.
- [CrossRef] [Google Scholar]
- Enhanced biodiversity of gut flora and feed efficiency in pond cultured tilapia under reduced frequency feeding strategies. PLOS {ONE}. 2020;15:e0236100.
- [CrossRef] [Google Scholar]
- Detection and Removal of PCR Duplicates in Population Genomic ddRAD Studies by Addition of a Degenerate Base Region ({DBR}) in Sequencing Adapters. Biol. Bull.. 2014;227:146-160.
- [CrossRef] [Google Scholar]
- Metagenomic microbial community profiling using unique clade-specific marker genes. Nat. Methods. 2012;9:811-814.
- [CrossRef] [Google Scholar]
- Phytochemical profiling of the leaves of Brassica juncea L. using GC-MS. Int. Food Res. J.. 2017;24:547.
- [CrossRef] [Google Scholar]
- Intestinal microbiota associated with differential feed conversion efficiency in chickens. Appl. Microbiol. Biotechnol.. 2012;96:1361-1369.
- [CrossRef] [Google Scholar]
- Principles and Procedures of Statistics: A Biometrical Approach (3rd ed.). Singapore: McGraw Hill Book International Co.; 1997.
- Characterisation of the effect of day length, and associated differences in dietary intake, on the gut microbiota of Soay sheep. Arch. Microbiol.. 2019;201:889-896.
- [CrossRef] [Google Scholar]
- Thornton, I., Webb, J.S., 1980. Trace Elements in Soils and Plants, in: Blaxter, K. (Ed.), Food Chains and Human Nutrition. Springer, Dordrecht, pp. 273–315. https://doi.org/10.1201/b10158.
- The value of gut microbiota to predict feed efficiency and growth of rabbits under different feeding regimes. Sci. Rep.. 2021;11:19495.
- [CrossRef] [Google Scholar]
- Preliminary investigation of mixed orchard hays on the meat quality, fatty acid profile, and gastrointestinal microbiota in goat kids. Animals. 2022;12:780.
- [CrossRef] [Google Scholar]
- Metagenomics: a path to understanding the gut microbiome. Mamm. Genome. 2021;32:282-296.
- [CrossRef] [Google Scholar]
- Environmental microarray analyses of Antarctic soil microbial communities. ISME J.. 2008;3:340-351.
- [CrossRef] [Google Scholar]
Appendix A
Supplementary material
Supplementary data to this article can be found online at https://doi.org/10.1016/j.jksus.2023.102601.
Appendix A
Supplementary material
The following are the Supplementary data to this article:


