

Dam safety assessment using 2D electrical resistivity geophysical survey and geological mapping
⁎Corresponding author at: Department of Geophysics, Unievrsity of Ilorin, PMB 1515, Ilorin, Nigeria. lanreraji@unilorin.edu.ng (W.O. Raji)
-
Received: ,
Accepted: ,
This article was originally published by Elsevier and was migrated to Scientific Scholar after the change of Publisher.
Peer review under responsibility of King Saud University.
Abstract
A combination of Geological mapping and two-dimensional electrical resistivity (2D-ER) surveys was applied to study the Unilorin Dam and its environment. The purpose of the study was to investigate the dam for structural anomalies that may compromise the purpose and safety of the dam. Field equipment for the study comprised a SuperSting R8/IP Multi-Electrodes Resistivity Meter, 84 metallic electrodes and the accessories, compass clinometer, and portable GPS equipment. Geological data were processed and plotted to obtain a Geological Map and Rosette Diagram that were used for structural interpretations. The structures interpreted include an asymmetric fold and a strike-slip fault. The 2D resistivity data were processed and tomographically inverted to obtain the resistivity models of the subsurface around the dam. Interpretations of 2D resistivity models showed that the dam reservoir floor is underlain by competent basement rocks, however, the basement rock is weathered in some places. Patches of low resistivities structures interpreted as seepages, fractures and water-saturated cavity were delineated in different sections of the dam. The surface structural elements from geological study support the subsurface structures interpreted in the 2D resistivity models. Weathered structures, fractures, and seepage in the reservoir floor constitute areas of excessive water loss in the dam. The cavity delineated in the dam foundation is a potential threat to the dam’s safety. The dam section with cavity has been referred to structural engineers for detailed study.
Keywords
Two-dimensional electrical resistivity survey
Geological and structural mapping
Tomographic inversion
Dam
Basement complex rocks

1 Introduction
Safety assessment test on civil engineering constructions such as dams, tunnels, and bridges is a necessary endeavor to forestall sudden failure and collapse of engineering infrastructure. The mechanical properties of old dams that have outlived their life span, or new dams affected by natural hazards might have suffered degradation that can cause some structural damages that may not be obvious on the surface. If such damages are not detected by routine safety checks and addressed in good time, it may deteriorates and consequently lead to the failure of the dam. A dam is a barrier constructed to slow down, direct, or obstruct the free flow of water. The purpose of dam construction includes irrigation, supply of water for human and industry uses, hydro-electric power generation, control of flood, fish rearing, recreation, and navigation (Biswas and Charttergee, 1971; Plata and Iragüen, 1992). In addition to water scarcity, dam failure can lead to flooding and monumental loss of lives and properties.
The old method of dam testing for structural damages include drilling and sample testing. Usually, 250–300 mm hole(s) is drilled in some parts of the dam and the samples collected are structurally examined and tested in the laboratory. Despite the cost and time required, drilling provide limited information on the possible structural anomalies/damages in dams (Kepler et al., 2000). Geophysical methods commonly used for dam investigation include seismic, ground penetrating radar (GPR), and electrical resistivity method (Wyllie et al., 1956; Zelt and Smith, 1992; Johansson and Dahlin, 1996; Sjödahl et al., 2010; 2005; Panthulu et al., 2001; Karastathis et al., 2002; Oh et al., 2003; Lim et al., 2004; Abubakar et al., 2014; Raji and Ibrahim, 2017). These methods have capabilities to illuminate structural anomalies such as fractures, faults, cracks, pipings, voids, trapping, seepages, channels, sinkholes, cavity, etc., that may have negative consequences on the safety of the dam.
Among the geophysical methods, Electrical Resistivity (ER) method is the best for dam investigation (Sjödahl et al., 2010; Panthulu et al., 2001; Karastathis et al., 2002; Kim et al., 2007; Lin et al., 2013). Due to resolution problem, GPR may yield unreliable result in a case where the foundation is deep beneath water column. Seismic method often uses destructive sources (e.g., explosives, heavy hammer) that may further weaken the dam foundation or the basement rocks around the dam. Two-dimensional electrical resistivity, 2D-ER is a non-destructive high-resolution geophysical method that is the most suitable for dam investigation and monitoring. The method is cost effective and has been successfully applied to evaluate the competence of foundation rock before dam construction and for safety test after dam construction (Plata and Araguás, 2002; Song et al., 2005; Kim et al., 2007; Cho and Yeom, 2007; Osazuwa and Chinedu, 2008; Burke et al., 2011; Chinedu and Ogah, 2013; Sum et al.,1996; Zhou et al., 2002; Abu-Shariah, 2009; Vachiratienchai et al., 2010; Raji and Ibrahim, 2017).
The basis of using electrical resistivity method for testing concrete and rock material is to test for ionic transmission through moisture present in the cement voids or weathered section of foundation rock. The presence of fractures, holes, voids, clay-fillings, etc, that are susceptible to water infiltration or leakages in concrete foundations or bedrock is usually indicated by low resistivity (or high conductivity). In contrast, concrete foundation and competent bedrock with no void or structural defects have characteristic high resistivity (or low conductivity) due to lack of moisture. Depending on the fluid content and nature of the fluid, the electrical resistivity of concrete ranges from 10 to 100,000 Ωm (Gjorv et al., 1977; Polder, 2001). A resistivity value less than 50 Ωm in concrete foundation or crystalline rocks usually indicate zones of weakness (Johansson and Dahlin, 1996; Karastathis et al., 2002; Raji, 2014). Chinedu and Ogah (2013) applied 2D Electrical Resistivity Survey to study a dam in Zaria, Nigeria. The tomographic images of the resistivity data revealed low resistivity patches of different sizes around the high resistivity bedrock. The low resistivity patches were interpreted as weak zones and potential areas of seepage in the dam. Karastathis et al. (2002) applied a combination of 2D-electrical resistivity, ground penetrating radar, and seismic method to study the condition of Marathon (concrete) Dam in Greece after the occurrence of a 5.9 Ms earthquake in 1999. Result of the electrical resistivity study showed some areas of low resistivity indicating weak zones and potential points of structural failure in the dam. The study recommended that the suspicious points in the foundation should be further examined by specialist engineers.
The aim of this study is to examine Unilorin Dam for possible structural anomalies that may cause the dam’s failure. The study is a quality assurance check on the dam due to the following reasons: (i) the activities of miners, which sometimes involves the use of explosives to blast rocks into construction aggregates in the neighbourhood of the dam constitutes a threat to the safety of the dam; (ii) the recent earthquake that took place in the Federal capital Territory (FCT), has negatively impacted some engineering facilities in the neighbouring states; and (iii) the dam has not been checked for safety since its construction. These three reasons put together necessitated the study in order to check for structural failure that might be caused by (i) and /or (ii). The objectives of the study was to use 2D-ER and geological mapping to evaluate the dam for surface and subsurface structures that may have negative consequences on the dam. The choice of 2D Electrical Resistivity Survey for this study is informed by its high lateral and vertical coverage that is several orders higher than 1D survey and the capability of 2D-ER to reveal deep-seated geological features having contrasting resistivity to the host rock. Dipole-dipole array was chosen for this study because of the plan to do 3D survey in the future. Dipole-dipole array has the best coverage and resolution at the edge of 3D grids.
2 Description of the study area
Unilorin Dam is an earth-fill embankment with concrete spillway. The Dam is located in the southern part of the University of Ilorin campus, Ilorin, North central Nigeria (Fig. 1a). The campus lies within longitude 4° 39I – 4° 42I and latitude 8° 27I – 8° 29I. The dam has a catchment area of 573 m2 and reservoir capacity of 1.806 m3 (Sule et al., 2011). The dam is built on Oyun River (Fig. 2a). River Oyun flows in approximate northeast-southwest direction and has a total length of about 48.30 km. The drainage pattern is structurally controlled.
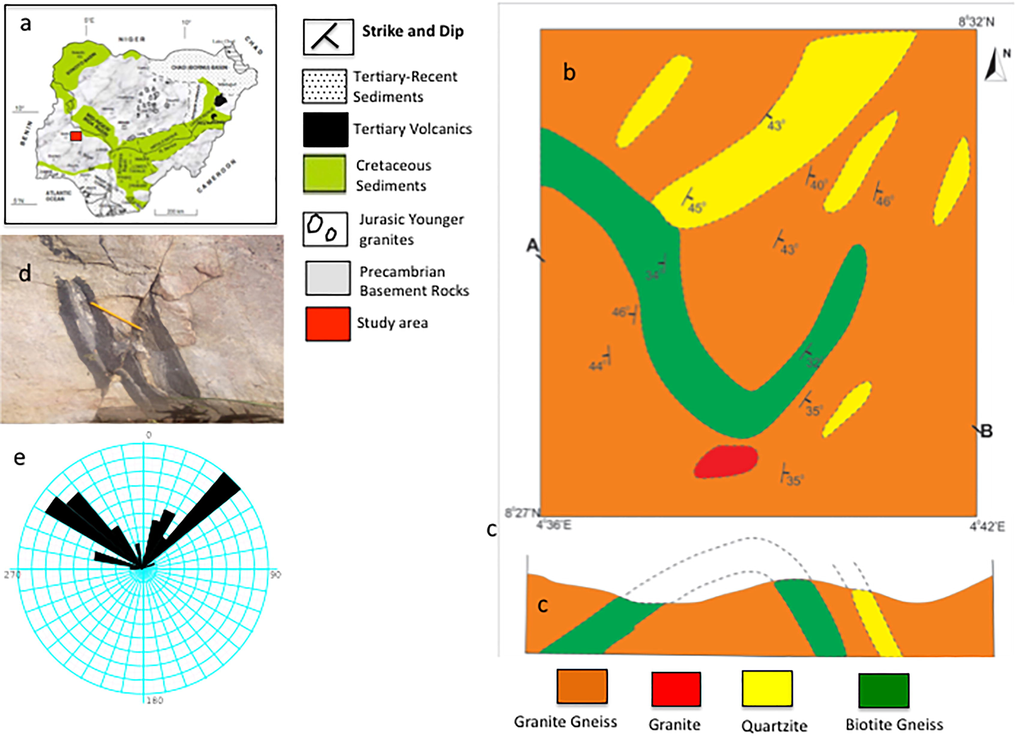
- Data from geological field mapping. (a) Geological Map of Nigeria (Obaje, 2009) showing the location of the study area; (b) Geological map of the study area; (c) cross-section AE showing asymmetric fold; (d) Sinistral fault in quartzite, (e) Rosette diagram showing the major fracture directions in the area.
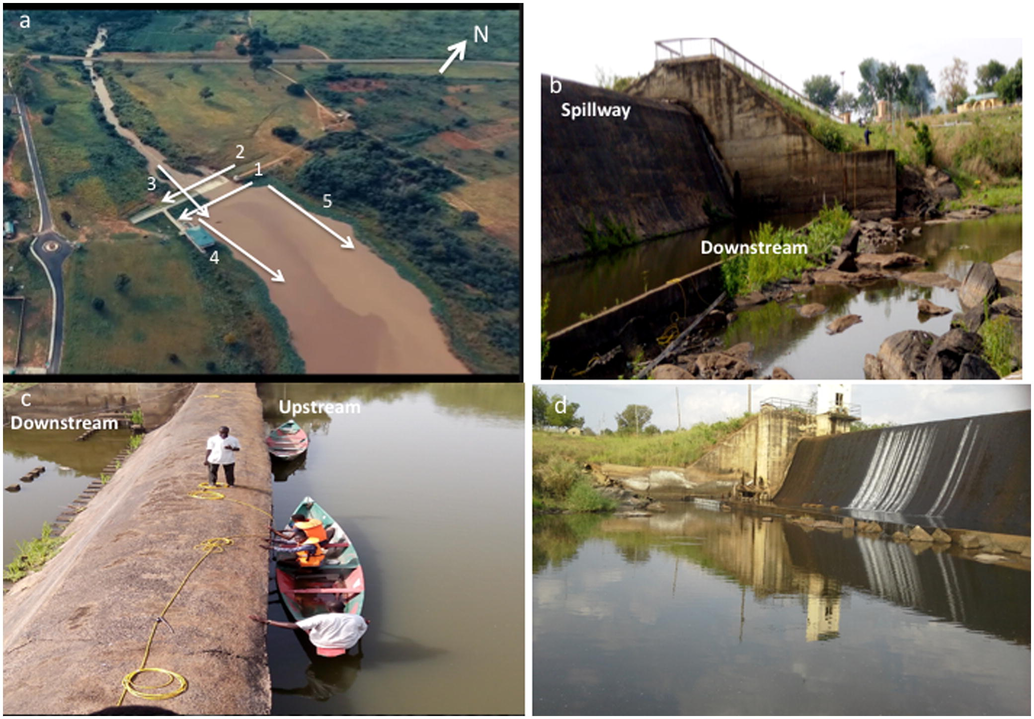
- Aerial and camera photos of the dam environment. (a) Aerial photo showing location of the dam and the 2D resistivity profiles; (b, c, and d) camera photos showing the different sections of the dam.
3 Materials and methods
3.1 Geological field mapping in the study area
The University of Ilorin Campus falls within Geological Sheet 223 Ilorin southeast in the basement complex of Nigeria. Basement complex of Nigeria is considered to be Precambrian to lower Paleozoic in age (Oyawoye, 1964; 1972; Rahaman, 1976; Annor et al., 1987). The study area was mapped and a geological map was produced on a scale of 1:1000 m. The geology comprises of metamorphic and igneous rock of Precambrian age. The true stratigraphic relationship is poorly understood at outcrop level due to poor exposure. Cross-cutting relationship observed on the field was used to infer the relative ages of the rocks. The four main lithologic units around the study area are granite gneiss, biotite gneiss, augen gneiss, and quartzite. Minor bodies of pegmatites and quartz veins intruded the rocks. Granite gneiss is the most abundant rock type in the area. Augen gneiss is abundant in the southeastern part of the study area. The most notable features of gneiss in the area is pinch-and-swell structures, fracture and faults. Pinch-and-swell structure is an evidence of deformation. The biotite gneiss is variably migmatised and interbedded with granite gneiss in some places. Biotite gneiss is darker than the granite gneiss due to abundance of ferromagnesian minerals. Biotite gneiss is well exposed along Oyun River and its tributaries.
Bands and lenses of quartzite occur in some places. The quartzite is considered to be metamorphic equivalence of major quartz that filled the pre-existing fractures and faults in the area. Occurrence of quartzite around the dam suggests the presence of fractures and faults in the area. Some of the fractures and faults were seen on the exposed rock. The geological map of the study area resulting from field mapping is presented in Fig. 1b. The cross-section (Fig. 1c) reveals the presence of an asymmetric antiform with short attenuated limb. Short attenuated limb asymmetric antiform is commonly found in deformation zones (Annor and Freeth, 1985). The antiform represents the major structural elements in the study area. Other structural elements in the study area include, pinch-and -swell structure, faults, and fractures (Fig. 1d). The rocks are dipping to the west and the east with an angle ranging from 32° to 46°. Strike and dips measured in the area are plotted in the Rosette diagram (Fig. 1e). Interpretation of the Rosette diagram shows two major fracture directions: NW-SE and SE-NW fractures thereby indicating two episodes of deformation.
3.2 Geophysical data acquisition and processing
Geophysical instrument comprised a SuperSting R8/IP Multi-Electrodes Resistivity Meter, 84 metallic electrodes, a multi-channel switch box, 12 passive cables– each is 70 m long, comprising seven stakes for seven electrodes, a DC battery, portable GPS equipment, and compass clinometers. Five (5) profiles were established as shown in Fig. 2a to investigate the dam and the bedrock beneath the dam reservoir floor. Each profile was established on a straight line using the dipole–dipole array. Dipole-dipole array method was chosen for the study because of its sensitivity to vertical structures. The coordinate positions of the first and last electrodes were measured using GPS equipment. Profiles 1, 2, and 3 were 249 m long with electrode separation of 3 m, while profile 4 and 5 were 415 m long with electrode separation of 5 m. Profiles 1, 2 and 3 were established to investigate the dam foundation for possible structural anomalies, while profiles 4 and 5 were established to search for subsurface structures that may allow excessive water loss in the reservoir area (see Fig. 2). Profile 1 was located in the upstream section while profile 2 was located in the downstream section. Profile 3 is the cross-line of profiles 1 and 2. Upstream section is used to describe the section of the dam wall in contact with reservoir water before the concrete. Downstream section is used to describe the other side of the dam wall (Fig. 2b).
When measuring resistivity data along profile 1, the electrodes were inserted into water along the dam axis because the water level was higher than the electrodes’ height. Two canoes were used by the field crew to move from one end of the dam to another while laying the cables/electrodes (Fig. 2c) and measurements were taken when the cables were stable. The practicality of laying electrode in water-covered area for 2D Resistivity Survey and its data processing is described in Loke and Lane (2004) and Lagmansson (1998). In profile 2, water level is lower than the height of electrodes, but the electrodes are in contact with water (Fig. 2b). For profiles 3, 4 and 5 electrodes are grounded following the conventional procedure. Profiles 1 and 2 were laid in approximate north-south direction, while profiles 3, 4 and 5 were laid in approximate east-west direction. The survey was designed to penetrate to a depth greater than 30 m, which is the maximum depth to the basement rock in the area (Olasehinde and Raji, 2007; Raji and Ibrahim, 2017). The survey took place in January 2017 at the peak of dry season when the dam’s water is at its minimum. In addition, part of the dam’s water was drained to allow resistivity measurement.
Field data were plotted in profile format for visual inspection and quality control. Next, the data were preprocessed to attenuate noise and remove spurious values. Tomographic inversion of the resistivity based geological model along each profile was performed using optimized finite difference technique (Loke and Barker, 1996; Loke et al., 2013) with robust least-squared scheme. First, resistivity distribution in the ground was theoretically calculated. Then resistivity-based geological model was inverted iteratively by comparing the field data with the calculated data until the minimum RMS error is achieved. The inversion scheme was set for five iterations. To reduce ambiguity and improve the uniqueness of the inverted resistivity models, the inversion process was constrained by: (i) assuming that the data contain errors in a form of Gaussian distribution and gradient smoothness was applied (Tejero et al., 2002) without compromising the resistivity contrast that may exist at the contact of competent basement rock and the water bottom; (ii) geological a priori from previous geophysical and geological studies (Olasehinde and Raji, 2007; Raji and Ibrahim, 2017) was incorporated into the inversion scheme as the starting model for the inversion, assuming moderately flat topography and blocky structures. For the case of the survey in water covered area (Profile 1), a blocky resistivity structure representing three contrasting geo-resistivity layers – very low resistivity water column, moderately low resistivity clayey sand, and high resistivity competent host rock was used as the starting model (see also Loke, 2001; Lagmansson, 1998). The final resistivity models along the profile lines are shown in Figs. 3–7. The RMS error ranges from 3.2 to 5.8%. Data processing and inversion were done using RES2DINV (AGI, 2010) and in-house MATLAB scripts.
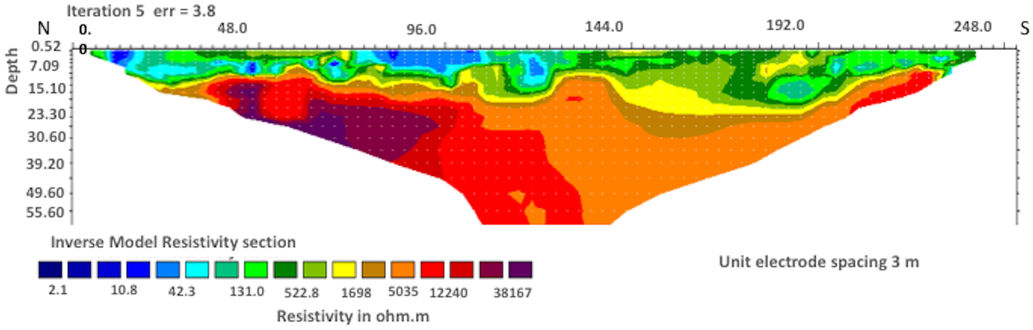
- 2D electrical resistivity model beneath profile 1 showing the dam foundation at the upstream. The high resistivity (red colour) section shows the concrete foundation below water level.

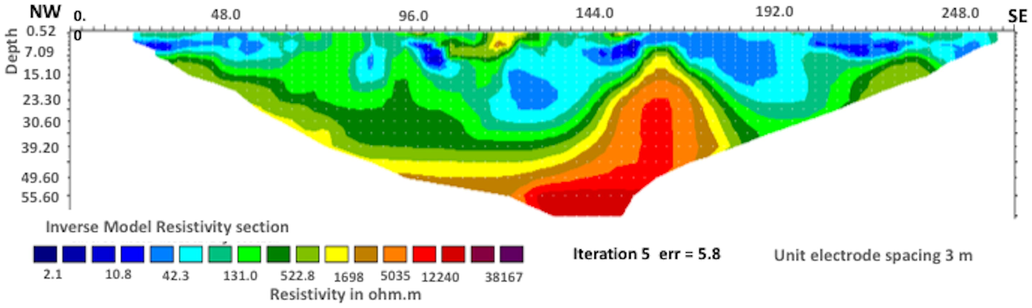
- 2D electrical resistivity model beneath profile 2 showing dam foundation at the downstream. The blue section with arrow shows the cavity in the foundation saturated by water.
- 2D electrical resistivity model beneath profile 3 showing some weathered sections (beep blue colour) in the dam reservoir floor and the protruding edge of the dam foundation (red).
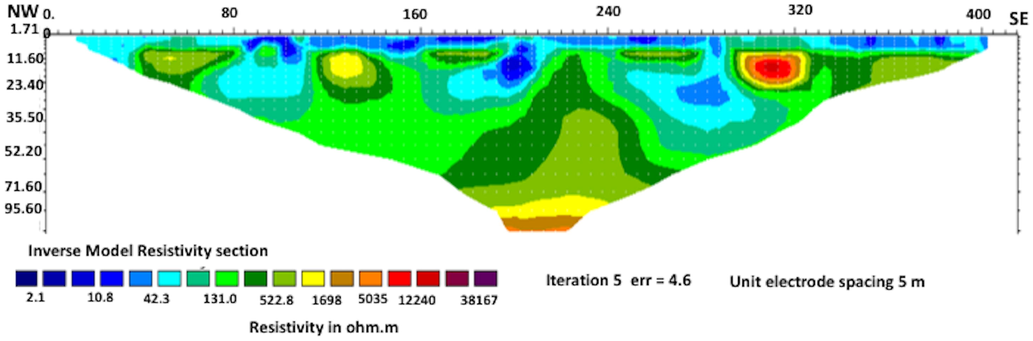
- 2D electrical resistivity model beneath profile 4 showing the dam’s reservoir floor. The blue patches show water-saturated weathered rock.
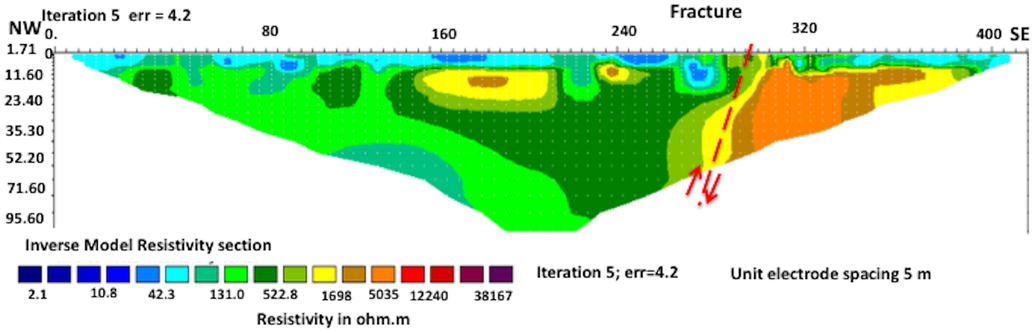
- 2D electrical resistivity model beneath profile 5 showing a fault in the dam reservoir floor similar to the structure mapped on the surface (Fig. 1) during geological mapping.
4 Discussion of results
The choice of Electrical Resistivity method for this study is based on the knowledge that weathered rocks, fluid-saturated rocks, faults, seepages, sinkhole, etc. that usually represent points of excessive water loss in dams have detectable electrical resistivity properties that are contrastingly lower than the resistivity of concrete structures and competent host rock around the dam. The inverted resistivity-based geological models (Figs. 3–7) were interpreted based on the resistivity variations observed in the resistivity models, the resistivity properties of earth materials, a priori geological knowledge of the study area from previous studies, and lithologic section from the boreholes in the area. The inverted resistivity model presents a variety of resistivities that range from 2.1 to 38,167 Ωm. These resistivity values represents a different rock types and saturation conditions (Gjorv et al., 1977; Telford et al., 1990). Compared to dry rocks, rock saturated with water will have lower resistivities, while those saturated with oil will have higher resistivities (Aluko et al., 2017; Raji and Adeoye, 2017; Raji et al., 2018).
In terms of resistivity distributions, the characteristic features of the resistivity model in Figs. 3–5, (profiles 1–3) corresponding to the dam foundation are similar and difference from those resistivity models inverted from profiles 4 – 5 (Figs. 6 and 7) around the dam reservoir floor. The background resistivity in the area is about 500 Ωm – represented in green colour corresponds to the resistivity of granite gneiss –the dominant rock in the area. The red colour in the resistivity model of profile 1 (Fig. 3) represents the dam foundation at the upstream section. The high resistivity foundation structure (>12,000 Ωm) is overlain by moderately resistive granite fill. The very-low resistivity blue colour represents the water-saturated sediment. The sediments are transported by run-off water when the dam is full during rainy season. The gradual colour change, from red-yellow-green, at the top of dam foundation is a possible consequence of gradient smoothening at the boundaries of high and low resistivity materials.
Profile 2 (Fig. 4) show the resistivity model of the dam foundation at the downstream section. The high resistive (red) portion of the resistivity model represents the dam foundation at subsurface. The foundation is overlain by moderately-resistive support granite fills down the spillway. The laterally continuous low-resistivity (blue colour) is interpreted as sandy materials infiltrating the granite fills. The sandy materials were derived from the sediment transported by water from the land. The low resistivity structure at about 192 m in Fig. 4 indicates a weak zone in the downstream section of the dam. The structure is interpreted as a cavity or a channel. The weak zone is a source of threat to the dam foundation. It could be a result of void in the dam foundation that has grown over time due to water infiltration.
To ascertain this, the geoscience team planned to repeat the 2D resistivity survey in the near future. It is believed that time-lapse image of the dam will reveal changes in the size of the channel thereby allowing a better interpretation of the structure. However, personal communication with a structural engineer informed that the channel does not constitute a serious threat to the dam at this time, because it is located on the downstream section (exterior wall) of the dam. If the cavity expands over time, it may affect the interior wall of the dam. Structures such as cavity and channel may be formed by the dissolution of mineral or rocks aggregates and it may grow bigger due to water infiltration (Owen, 1983; Metwaly and Alfouzan, 2013). The section of the dam has been referred to expert engineers for further studies. Profile 3 (Fig. 5) revealed the right edge of the dam foundation (high resistivity) and some parts of the bedrock beneath the reservoir floor in the upstream and downstream sections. The dam edge is indicated by the high resistivity values (red colour) at the centre of the resistivity model. The low resistivity values to the left and right of resistivity model represent the bedrock around the edge of the dam. The bedrock is characterized by lower resistivities suggesting the presence of weathered and water-saturated rocks.
Profiles 4 and 5 (Figs. 6 and 7) show the electrical resistivity property of the rocks beneath the reservoir floor. The two tomographic images are dominated by low resistivities ranging from 2 to 1698 Ωm. The very low resistivity values suggest that the rocks have been weathered and infiltrated by water. The blue patches in the background green colour indicated possible areas of internal erosion and water seepages. Internal erosion and seepages are flash points of excessive water loss. The blue patches are prominent on the tomographic image of profile 4 (Fig. 6) at lateral distances equivalent to 85–100 m, 190–210 m. A fracture is delineated in the reservoir floor along profile 5 (Fig. 7) at about 300 m. The fracture is suggested by the vertical resistivity contrast (represented by yellow-green vertical lines) separating the green massive structures on the left from the brownish massive structure on the right. The fracture is vertically oriented and trending in the NE-SW direction. The fracture delineated in the resistivity model is supported by the fractures mapped during the geological fieldwork (Fig. 1d). The orientation of the fracture also corresponds to the fracture direction interpreted from the rosette diagram (Fig. 1e).
5 Conclusion
Subsurface geophysical investigations and surface geological mapping around University of Ilorin Dam revealed some interesting geological features and structures that represents zones of weakness and structural anomalies that may allow excessive water loss from the dam. Some of the structures/features revealed by the 2D resistivity models were characterized by anomalous low resistivities within the high resistivity competent host rock. Erosional channels and a fracture delineated in the dam reservoir area represent points of water seepage in the dam. A cavity was delineated in the downstream section of the dam. The cavity constitutes a potential threat to the dam and it has been referred to structural engineers for detailed study. Findings from geological mapping support the results of geophysical investigations. Overall the study confirms the appropriateness of electrical resistivity survey for investigating dam and similar engineering infrastructures. The methods and procedure used for the study can be applied to any dam and other similar engineering infrastructures to assess their safety status and proffer remedial action where necessary, in order to prevent sudden collapse of the infrastructure.
Conflict of interest
None.
Acknowledgements
The authors thankfully acknowledge the anonymous reviewers and the Editor-in-Chief for useful comments and timely review of the manuscript, respectively. No doubt comments from the reviewers contributed to the quality of this paper. We thank the postgraduate students who participated in geological field mapping and geophysical surveys.
References
- Direct current resistivity and very low frequency electromagnetic studies for groundwater development in a basement complex area of Nigeria. Sci. Focus. 2014;19(1):1-10.
- [Google Scholar]
- Determination of cave geometry by using a geoelectrical resistivity inverse model. Eng. Geol.. 2009;105:239e244.
- [Google Scholar]
- Application of 2-D resistivity survey to groundwater aquifer delineation in a sedimentary terrain: a case study of south-western Nigeria. Water Util. J.. 2017;17:71-79.
- [Google Scholar]
- AGI, 2010. EarthImager™ 2D and 3D, Resistivity and IP inversion software: Advanced Geosciences Incorporated, www.Agiusa.com.
- Thermo-tectonic evolution of the basement complex around Okene, Nigeria with special reference to the deformation mechanism. Precambrian Res.. 1985;28:73-77.
- [Google Scholar]
- Basement fracture pattern in the control of river channels. An example from central Nigeria. J. Min. Geol.. 1987;26(1):5-11.
- [Google Scholar]
- Hydrogeophysical Investigations at Hidden Dam, Raymond, California. J. Environ. Eng. Geophys.. 2011;16(4):145-164.
- [Google Scholar]
- Electrical Resistivity Imaging of suspected seepage channels in an Earthen Dam in Zaria, North – Western Nigeria. Open J. Appl. Sci.. 2013;3:145-154.
- [Google Scholar]
- Crossline resistivity tomography for the delineation of anomalous seepage pathways in an embankment dam. Geophysics. 2007;72:31-38.
- [Google Scholar]
- Electrical resistivity of concrete in the oceans. In: 9th Annual Offshore Technology Conference 2803, Houston. 1977. p. :581-588.
- [Google Scholar]
- Seepage monitoring in an earth embankment damrepeated resistivity measurements. Eur. J. Environ. Eng. Geophys.. 1996;1:229-247.
- [Google Scholar]
- Geophysical methods contributing to the testing of concrete dams, application at the Marathon Dam. J. Appl. Geophys.. 2002;50:247-260.
- [Google Scholar]
- Improved assessment of mass concrete dams using acoustic travel time tomography: Part II. Application. Constr. Build. Mater.. 2000;14:147-156.
- [Google Scholar]
- Application of geophysical methods to the safety analysis of an earth dam. J. Environ. Eng. Geophys.. 2007;12:221-235.
- [Google Scholar]
- Marine resistivity survey. Advanced Geosciences Inc.; 1998. web site (www.agiusa.com)
- Leakage detection of earth dam using geophysical methods. In: International Commission on Large Dams, 72th Annual Meeting. 2004. p. :212-224.
- [Google Scholar]
- Investigation of abnormal seepages in an earth dam using resistivity tomography. J. GeoEng.. 2013;8(2):61-70.
- [Google Scholar]
- Rapid least-squares inversion of apparent resistivity pseudosection by a quasi–Newton method. Geophys. Prospect. 1996;44:131-152.
- [Google Scholar]
- Loke, M. H. (2001) Tutorial: 2D and 3D electrical imaging surveys. lecture note/tutorial.
- Inversion of data from electrical resistivity imaging surveys in water-covered areas. Explor. Geophys.. 2004;35:266-271.
- [Google Scholar]
- Recent developments in the direct-current geoelectrical imaging method. J. Appl. Geophys.. 2013;95:135-156.
- [Google Scholar]
- Application of 2-D geoelectrical resistivity tomography for subsurface cavity detection in the eastern part of Saudi Arabia. Geosci. Front.. 2013;4:469-476.
- [Google Scholar]
- Geology and Mineral Resources of Nigeria, Lecture Notes in Earth Sciences 120. Berlin Heidelberg: Springer-Verlag; 2009. p. :221.
- Safety evaluation of rock-fill dam by seismic (MASW) and resistivity method. In: Proceedings of the 16th Annual Symposium on the Application of Geophysics to Engineering and Environmental Problems. 2003. p. :1377-1386.
- [Google Scholar]
- Geophysical studies on fractures of basement rocks at University of Ilorin, Southwestern Nigeria: application to groundwater exploration. Water Resour.. 2007;17:3-10.
- [Google Scholar]
- Seismic refraction tomography imaging of high permeability zones beneath an Earthen Dam, in Zaria Area, Nigeria. J. Appl. Geophys.. 2008;66:44-58.
- [Google Scholar]
- Detection and mapping of tunnels and caves. In: Fitch A.A., ed. Developments in Geophysical Exploration Methods-5. Applied Science Publishers Ltd; 1983. p. :161-258.
- [Google Scholar]
- The geology of Nigerian basement complex – a survey of our present knowledge of them. J. Nigerian Min. Geol. Metall. Soc.. 1964;1(2):87-102.
- [Google Scholar]
- The basement complex of Nigeria. In: Dessauvagie T.F.J., Whiteman A.J., eds. African Geology. Ibadan University Press; 1972. p. :66-102.
- [Google Scholar]
- Detection of seepage paths in earth dams using self-potential and electrical resistivity methods. Eng. Geol.. 2001;59(3–4):281-295.
- [CrossRef] [Google Scholar]
- Detection and Prevention of Leaks from Dams. A.A. Balkema Publishers; 2002. p. :1-419.
- Leakage Study at Lake LaLaja Chile. In: Hötzl, Werner, eds. Tracer Hydrology. Balkema; 1992. p. :378-396.
- [Google Scholar]
- Test methods for on site measurement of resistivity of concrete—a RILEM TC-154 technical recommendation. Constr. Build. Mater.. 2001;15:125-131.
- [Google Scholar]
- Review of the basement geology of southwestern Nigeria. In: Kogbe C.A., ed. Geology of Nigeria (2nd ed.). Lagos: Elizabethan Publication; 1976. p. :41-58.
- [Google Scholar]
- Review of electrical and gravity methods of near surface exploration for groundwater. Nigerian J. Technol. Dev.. 2014;11(2):31-38.
- [Google Scholar]
- Geophysical investigation for Basement Rock Structures around a proposed Dam site. Adamawa State Univ. J. Sci. Res.. 2017;5(2):38-49.
- [Google Scholar]
- Geophysical mapping of contaminant leachate around a reclaimed open dumpsite. J. King Saud Univ. – Sci.. 2017;29:348-359.
- [Google Scholar]
- Electrical resistivity mapping of oil spills in a coastal environment of Lagos, Nigeria. Arab. J. Geosci.. 2018;11:144.
- [CrossRef] [Google Scholar]
- Using the resistivity method for leakage detection in a blind test at the Røssvation embankment dam test facility in Norway. Bull. Eng. Geol. Environ.. 2010;69:643-658.
- [Google Scholar]
- Using resistivity measurements for dam safety evaluation at Enemossen tailings dam in southern Sweden. Environ. Geol.. 2005;49:267-273.
- [Google Scholar]
- Application of hydrogeological and geophysical methods to delineate leakage pathways in an earth fill dam. Explor. Geophys.. 2005;36:92-96.
- [Google Scholar]
- Hydrology of river Oyun and hydropower potential of Unilorin Dam, Ilorin, Kwara State, Nigeria. New York Sci. J.. 2011;4(1):69-78.
- [Google Scholar]
- Geotechnical Problems in Limestone Terrain with Emphasis on Cavities and Sinkholes. Seminar Geologi dan Sekitarn. Bangi: UKM, Puri Pujangga; 1996. p. :102-117.
- Applied Geophysics. New York: Cambridge University Press; 1990. doi: 10.1017/CBO9781139167932
- Cavity detection in the south-western hilly portion of Mexico City by resistivity imaging. J. Eng. Environ. Geophys.. 2002;7(3):130-139.
- [Google Scholar]
- A hybrid finite difference finite element method to incorporate topography for 2D direct current (DC) resistivity modeling. Phys. Earth Planet. Inter.. 2010;183:426-434.
- [Google Scholar]
- Elastic wave velocities in heterogeneous and porous media. Geophysics. 1956;21:41-70.
- [Google Scholar]
- Seismic travel time inversion for 2-D crustal velocity structure. Geophys. J. Int.. 1992;108:16-34.
- [Google Scholar]
- Effective electrode array in mapping karst hazards in electrical resistivity tomography. Environ. Geol.. 2002;42:922-928.
- [Google Scholar]


