

Crustal characteristics beneath the Tien Shan belt, Central Asia, using the seismic receiver function
-
Received: ,
Accepted: ,
This article was originally published by Elsevier and was migrated to Scientific Scholar after the change of Publisher.
Peer review under responsibility of King Saud University.
Abstract
The crustal structure beneath Tien Shan belt was evaluated using teleseismic waveforms from 20 broadband stations and gravity modeling as well. The crustal thickness varies from 36 km to 68 km where the crust thickens due north and the southwest of Tien Shan, while the central part has a thin crust. The area of interest has Vp/Vs ratio of 1.81 ± 0.025, indicating a mafic crust, detached by Moho from the mantle. Additionally, collision zone between Tien Shan and the Tarim Basin has the thickest crust and highest Φ values. The average Moho sharpness, R (0.17), is comparable to that of the typical crust and decreases due northwest. Stations east of the Talas-Fergana strike-slip fault show low Vp/Vs ratios and anomalously thin crust of about 42 km, probably suggesting delamination of the lower crust. The average Bouguer anomalies are large and negative, particularly near the stations in the southern part of Tien Shan where the elevations are the highest. The study suggests these large negative values beneath Tien Shan are a result of thickening of the lithosphere.
Keywords
Crustal structure
Moho
Vp/Vs ratio
Receiver function
Tien Shan

1 Introduction
The Tien Shan mountains belt is located in Central Asia and oriented E-W. It has 2500 km long and 300–500 km width (Fig. 1) with elevation of 7000 m (Molnar and Tapponnier, 1975). Recently, Tien Shan belt have a considerable earthquake activity where earthquakes with magnitudes greater than 8 have been recorded in this century (Molnar and Deng, 1984; Deng et al., 2000). Bump and Sheehan (1998) observed that earthquakes that take place in southern Tien Shan are mainly shallow (10–20 km), whereas those occurring on the northern side originate at depths of 40 km or deeper. Most earthquakes occur near the border fault zones and in the active faults within the mountain belt (Avouac and Tapponnier, 1993). Therefore, Tien Shan is a great example and provides significant information concerning the deformation of mountain building. Tien Shan has always been a subject of debate among scholars. Although several researchers investigate mantle structure, they have not studied the composition and structure of the crust underneath (Tapponnier and Molnar, 1979; Vinnik and Saipbekova, 1984; Lukk et al., 1995; Bump and Sheehan, 1998; Zhiwei et al., 2009).
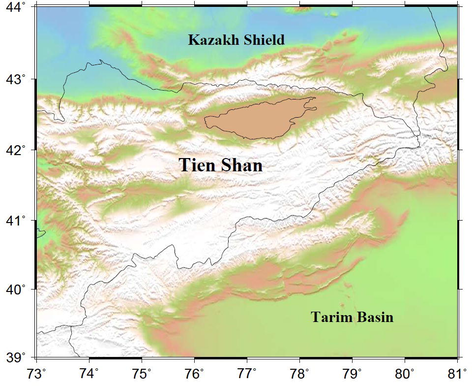
- Location map of the Tien Shan and Tarim basin.
Vinnik and Saipbekova (1984) used arrival times to calculate P wave travel-time residuals and concluded that there is a low wave speed in the uppermost mantle underneath Tien Shan assuming that the thickness of the crust varies linearly with mean elevation. They found a crustal thickness ranging from 55 to 60 km, by using data from 14 seismometers in central and western Tien Shan. Vinnik et al. (2006) stated that the crustal thickness is greatest (about 60 km) in the intersection of Tarim Basin and Tien Shan. They also detected that the crust-mantle boundary in this region changes rapidly because of an increasing thickness of lower crust. They applied the receiver functions inversion of P- and S-waves with teleseismic travel-time data. By applying the arrival time tomography techniques, Zhiwei et al. (2009) declared the presence of thin lithosphere (less than 100 km depth) underneath the central part of Tien Shan and proposed the high wave-speed regions broaden from the surface to a depth of 400 km, or even deeper. Omuralieva et al. (2009) noticed a low-velocity zone due to the flow of mantle upwelling.
Chen et al. (1997) have proposed that the Tien Shan may be characterized by lithosphere activity. They came to this conclusion based on the delay times of the Ps converted phases beneath the region. Bump and Sheehan (1998) revealed the crustal thickness ranges between 37 km and 60 km in north-central Tien Shan using receiver function analysis. They used teleseismic events between 30° and 90° with magnitudes greater than 6.0. They also observed that in general, the crust thickens with increasing elevation. Deyuan et al. (2000) revealed a two-layer crustal structure, namely the lower and upper crusts, based on deep seismic sounding profiling.
This study provides the latest determination of the crustal thickness (H), Poisson‘s ratio (σ) and quantifies the sharpness of Moho by stacking teleseismic P-to-S converted waves (PmS) and their multiples (PPmS and PSmS). Here we report results of such determinations using all the broadband seismic data archived at the IRIS Data Management Center. Moreover, the gravity data used to constrain the interpretations of the seismic data.
2 Regional geology and tectonics
Tectonically, the Tien Shan is situated between the active Tarim Basin from the south and from north by stable Kazakh Shield (Fig. 2). Tien Shan is dominated by an E-W trending structure with 10–15 mm/yr and 2–6 mm/yr reducing rate of southern and northern Tien Shan respectively (Buslov et al., 2004). The current topography is mainly a result of uplift in Cenozoic time in response to the India-Eurasia collision (Burchfiel and Royden, 1991; Yin et al., 1998). Strike-slip and normal fault types characterize most of the Tien Shan area (Omuralieva et al., 2009). Geological studies related to timing and sequences have proposed the distortion of Tien Shan initiated 20 Ma after Indo-Asian collision (Abdrakhmatov et al., 2002). Furthermore, geologists stated that the Tien Shan has stayed tectonically inactive for most of the Late Cretaceous and Cenozoic (Burtman et al., 1996).
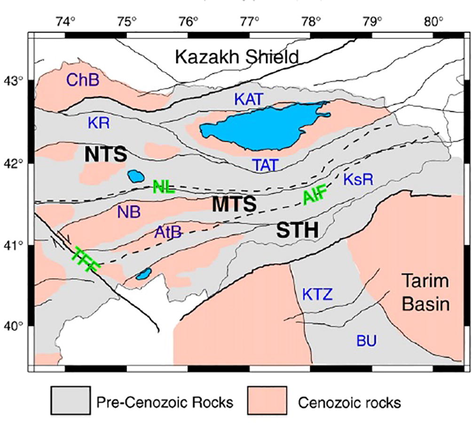
- Generalized geologic map of the Central Tien Shan and western Tarim Basin (after Omuralieva et al., 2009). Thick and thin black lines are regional and main local faults (courtesy of R. Mellors and S. Roecker). Dotted lines are approximate location of ancient faults. Closed blue areas stand for lakes. Basins and ranges (dark blue letters): ChB – Chu Basin, NB – Naryn Basin, AtB – Atbashi Basin, IK – Issyk Kul, KR – Kyrgyz Range, KAT – Kungey Ala Too, TAT – Terskey Ala Too, KsR – Kokshaaltoo Range, KTZ – Kelpintag Thrust Zone, BU – Bachu Uplift. Faults (green letters): NL – Nikolaev Line, AIF – Atbashi-Ingylchek Fault, TFF – Talas-Fergana Fault. Subdivisions within the Central Tien Shan (black letters): NTS – Northern Tien Shan, MTS – Middle Tien Shan, STH – South Tien Shan.
The tectonic structure of the largest part of the Tien Shan was formed in the late Paleozoic between the middle Carboniferous and the Permian (Chang, 1959; Burtman 1975). Its basement was assembled throughout a number of Palaeozoic addition procedures associated with the closing of the Palaeo-Asian Ocean (Buslov et al., 2001). Rocks of the Tien Shan were deformed in Late Paleozoic when Tarim Basin collided with Siberia (Burrett, 1974; Şengör et al., 1988; Windley et al., 1989). Igneous outcrops can be observed over the north and east of Tien Shan, while the southern and western parts of the Tien Shan consist of meta-sedimentary rocks (Fig. 2) (Vinnik et al., 2002; Wang et al., 2004). The long period of stability and tectonic inactivity, throughout Late Cretaceous and Cenozoic caused the incline of the topography and the decrease of local relief (Burtman 1975; Bally et al., 1986). The Talas-Fergana Fault Zone, a dextral strike-slip, divides Tien Shan into NE and SW parts. Across Kyrgyz Tien Shan, the shortening in rate ranges from 13 to 23 mm/yr (Abdrakhmatov et al., 1996). The Tien Shan is divided into three major blocks; northern Tien Shan, middle Tien Shan and southern Tien Shan.
3 Data
The used dataset through this study include teleseismic waveforms recorded by 20 broadband stations (Fig. 3). They were requested from data management center at IRIS and were recorded from August 1997 to August 2010 with epicentral distances ranging from 30° to 180° (Fig. 4). These data consist of three-component seismograms with a clear P-wave arrival. The seismograms were filtered between the frequency range of 0.05 Hz and 1.5 Hz and were converted into radial receiver functions by applying the technique of Ammon et al. (1990). The receiver functions were examined visually and those with clear first P arrival were used. Finally, more than 1424 radial receiver functions were chosen.
![Surface topography of the Tien Shan including the distribution of seismic stations [blue triangles], earthquakes [red stars], and existing faults [green lines].](/content/185/2020/32/3/img/10.1016_j.jksus.2020.02.022-fig3.png)
- Surface topography of the Tien Shan including the distribution of seismic stations [blue triangles], earthquakes [red stars], and existing faults [green lines].
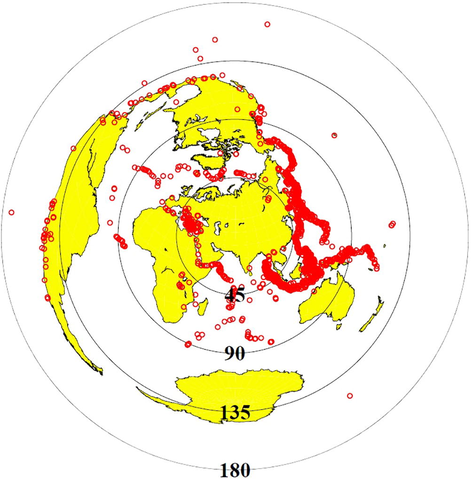
- Locations of the events used in the Tien Shan.
4 Receiver function analysis
Receiver function analysis is a robust method used to determine the Earth’s crustal structure. It utilizes the teleseismic waveforms, recorded by three components seismometer, to image the crustal structures beneath isolated seismic stations. The processing sequence detects the crustal/mantle boundary through recognizing P-to-S converted waves and their multiples from the Moho. Primary conversion (PmS or Ps) and multiple phases (PPmS, also called PpPs and PSmS, also referred as PpSs) often be recognized. The procedure of Zhu and Kanamori (2000) H-k stacking technique was applied through this study, where H denotes the Moho depth and Ф is Vp/Vs ratio. A series of depths, Hi, varies between 15 and 55 km for Afar and 35–75 km for Tien Shan with 0.1 km, and Фj from 1.70 to 2.10 for Afar and 1.65 to 1.95 for Tien Shan, increases of 0.0025 were used. The moveouts of PmS, PPmS, and PSmS were estimated for each (Hi, Фi) following Nair et al. (2006) method. The following Eqs. (1)–(4) were used for PmS, t1(i,j) estimation;
Moveouts, t2(i,j) of PPmS assessed by:
For each station, the receiver functions were stacked as:
The weighting factors w1, w2, and w3 in this study were set for both areas to 0.5, 0.3, and 0.2, respectively. A reference crustal velocity Vp(z) of 6.3 km/s was chosen for the Afar Depression and Tien Shan. To estimate the standard deviations of the resulting parameters, the bootstrap method (Efron and Tibshirani, 1986) has been applied in this study.
5 Results
The H-k stacking technique was applied to stack all the radial receiver functions recorded by the 20 stations. The results were categorized into two groups based on the quality of the H-k plots. Category A display stations with strong single peak and consequently H and k are identified. However, category B stations show clear PmS, but not PPmS or PSmS, and therefore an optimal pair of (H, Φ) cannot be determined. The crustal thickness (Hn) has been estimated with Φ of 1.80, which is approximately the mean Φ of Category A stations in the study area. Most receiver functions display a comprehensible peak of H-k plot and thus both H and Φ can be determined with great confidence for A stations. Category A stations include (ARA, KAZ, DGE, KARL, TERE, KASH, HARA, WUS, KSA, and AKSU) where majority of stations within this group presents precise crustal thickness. The crustal thickness underneath these stations ranges from 36.1 km (KAZ) to 68 km (HARA). The values of Ф ranges from 1.724 at DGE to 1.85 at HARA. The R-value ranges from 0.098 (AKSU) to 0.336 (KASH). While category B stations include (AML, AAK, KAI, ULHL, ANA, AHQI, KENS, KOPG, KAR, and POGR). The stations are described by crustal thickness in the range of 46 km (KAI and KOPG) to 65.7 km (ANA) and R values between 0.084 (ULHL) and 0.267 (KOPG).
The crustal thickness varies in a range from 36 km (east of the Talas Fergana fault) to about 68 km (northwestern corner of the Tarim Basin) (Fig. 5). The crust thickens in the north and the southwest side of Tien Shan, while the central part has a thin crust. The crustal thickness beneath KAZ is among the smallest in the region (36.1 km), but the Φ = 1.84 and R = 0.281 measurements are close to the average value for the entire study area. The northwestern corner of the Tarim Basin, beneath HARA, shows the thickest crust, highest Φ, and average R-values. In most cases, the crustal thickness values increase from north to south with increasing elevation. ARA, DGE, KARL, HARA, and KSA show a well-defined crustal thickness and normal Moho amplitude. The Moho can be clearly noticeable even on individual receiver functions. Most of the stations in this study show well pronounced PmS.
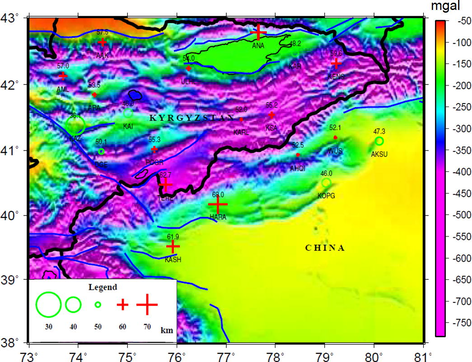
- Resulting crustal thickness (H) and Bouguer gravity anomalies (background) for the Tien Shan. Circles represent stations with a smaller thickness and pluses represent stations with a larger thickness. Solid symbols are category A stations and dotted ones are the category B stations.
The resulting Vp/Vs values range from 1.72 to 1.85, with a mean of 1.81 ± 0.025 (Fig. 6). The northwestern corner of the Tarim basin has the highest values at 1.81–1.85. The largest Φ values (1.85) in the study area are found beneath the northwestern corner of the Tarim basin HARA. The regions of thickened crust show high value of Vp/Vs. The amplitude ratio R-values have a mean of 0.14 with a range of 0.084–0.336, with KASH showing the highest amplitude value of R = 0.336 at the northwestern corner of the Tarim basin.
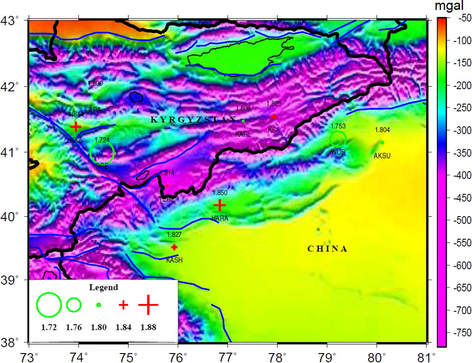
- Resulting crustal Vp/Vs (Ф) for category A stations for the Tien Shan.
Some of the PmS amplitudes are unusually large at stations KAZ, DGE, KASH, and KOPG, which might be indicative of the presence of other multiple interfering arrivals. In general, our results show that R-value decreases gradually towards the northwest (Fig. 7). The R-values observed in stations AAK, AML and ARA located at the northwest corner of the area are among the lowest. The amplitude ratio shows changeable Moho across Tien Shan.
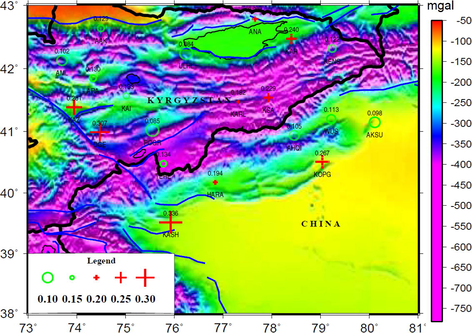
- Resulting ratio (R) of the stacking amplitude corresponding to the optimal pair of (H, Φ) over that of direct P-wave on the radial component for the Tien Shan. R is calculated for all the stations.
6 Discussions
The crustal thickness determined from the method of receiver function analysis in this study shows an average of 53 km. The crustal thickness varies from 36 km easting of Talas Fergana Fault to 68 km in the northwestern corner of Tarim Basin. It was observed that the crust is much thicker in the north and the southwest; however, it is quite thin in the central part of Tien Shan. Bump and Sheehan (1998) used receiver functions analysis and obtained measurements of crustal thickness at AAK and AML. They observed large variations with back azimuth at AAK and minimal changes in depth with back azimuth at AML. In general, there are increasing in the crustal thickness southward with increasing elevation. Northwestern corner of the Tarim Basin (HARA) shows the thickest crust, highest Φ, and average R-values. The crustal thickness beneath KAZ is among the smallest (36.1 km), Φ (1.84) and R (0.281). ARA, DGE, KARL, HARA, and KSA stations show a well-defined crustal thickness.
The results of the crustal thickness for AAK and AML are close to the results of Bump and Sheehan (1998). They found that the crustal thicknesses beneath these two stations are 51 km and 60 km respectively (Table 1). The H measurements, from this study, are correlated well with those obtained by Bump and Sheehan (1998), with a difference of a few kilometers. The largest crustal thickness (68 km) is found in the Tarim-Tien Shan junction zone and is possibly under-thrusting.
| Station | Lat. (North) | Long. (East) | Elevation (m) | Crustal thickness (km) | Reference |
|---|---|---|---|---|---|
| AAK | 43.72 | 74.49 | 1687 | 51 | Bump & Sheehan (1998) |
| 50 | Vinnik et al. (2004) | ||||
| 43 | Vinnik et al. (2006) | ||||
| 57 | This study | ||||
| AML | 42.08 | 74.69 | 3400 | 60 | Bump & Sheehan (1998) |
| 62 | Vinnik et al. (2004) | ||||
| 56 | Vinnik et al. (2006) | ||||
| 57 | This study | ||||
| ARA | 41.85 | 74.33 | 1484 | 50 | Vinnik et al. (2004) |
| 53 | Vinnik et al. (2006) | ||||
| 53 | This study | ||||
| DGE | 40.99 | 74.47 | 2941 | 45 | Vinnik et al. (2004) |
| 46 | Vinnik et al. (2006) | ||||
| 50 | This study | ||||
| KAI | 41.57 | 75.01 | 2016 | 56 | Vinnik et al. (2004) |
| 53 | Vinnik et al. (2006) | ||||
| 46 | This study | ||||
| POGR | 41.02 | 75.55 | 2357 | 55 | Vinnik et al. (2004) |
| 51 | Vinnik et al. (2006) | ||||
| 55 | This study | ||||
| ULHL | 42.25 | 76.24 | 2040 | 53 | Vinnik et al. (2004) |
| 52 | Vinnik et al. (2006) | ||||
| 54 | This study | ||||
| KASH | 39.52 | 75.92 | 1310 | 57 | Vinnik et al. (2004) |
| 60 | Vinnik et al. (2006) | ||||
| 62 | This study | ||||
| HARA | 40.17 | 76.84 | 1585 | 65 | Vinnik et al. (2004) |
| 64 | Vinnik et al. (2006) | ||||
| 68 | This study | ||||
| KSA | 41.54 | 77.93 | 3398 | 58 | Vinnik et al. (2004) |
| 56 | Vinnik et al. (2006) | ||||
| 55 | This study | ||||
| KENS | 42.32 | 79.24 | 2805 | 55 | Vinnik et al. (2004) |
| 53 | Vinnik et al. (2006) | ||||
| 59 | This study | ||||
| WUS | 41.20 | 79.22 | 1457 | 51 | Vinnik et al. (2004) |
| 53 | Vinnik et al. (2006) | ||||
| 52 | This study | ||||
| KOPG | 40.51 | 79.04 | 1114 | 61 | Vinnik et al. (2004) |
| 54 | Vinnik et al. (2006) | ||||
| 46 | This study | ||||
| AKSU | 41.14 | 80.11 | 1109 | 44 | Vinnik et al. (2004) |
| 46 | Vinnik et al. (2006) | ||||
| 47 | This study |
The Vp/Vs distribution in this study is, in fact, reasonable all over the study area. Stations TERE, HARA, and KASH at the northwestern corner of the Tarim Basin have high values of Vp/Vs up to 1.85, with the highest in the entire study area at HARA (1.85). It seems that the observed Φ values in this area, to some extent, are related to crustal thickness. For example, the crust beneath HARA has the highest values of Φ and H. Most of the category A stations have high values of Poisson’s ratio ranging from (0.24–0.29), indicating the presence of intermediate mafic components in the crust.
The results of this study suggest variations in the stacking amplitude (R) beneath the stations. The average resulting R (0.17) is similar to that of typical crust and decreases towards the northwest. The Moho depths at AML, ARA, and KAI, located at the east of the Talas Fergana fault, appear to be a relatively constant depth. From TERE through KASH, the Moho depth increases towards the junction zone between Tarim Basin and southern Tien Shan, indicating that the Moho is deepening and agreeing with a previous study by Vinnik et al. (2004).
Gravity data shows that the average Bouguer anomalies are large and negative, particularly near the stations in the southern part of Tien Shan where the elevations are the highest. Burov et al. (1990) explained the large negative values because of the flow in the asthenosphere that pulls Tien Shan down causing deepening of the Moho. The results of this study support what they found. They assumed that the local isostatic compensation is nearly complete and concluded that Tien Shan differs from the surrounding region in terms of deep structure. The results of the gravity inversion done by Bratfisch et al. (2010) indicated that Tien Shan has a mountain root with a thickness of about 70 km. They observed that the Moho is shallow under the basin and the crust thickness is homogeneous at a small scale. Here we observed that the eastern Tien Shan Bouguer gravity anomalies are too small compared to the western side. The large negative gravity anomalies over Tien Shan would be clarified by the sinking of the lithosphere root caused by normal stresses resulting from the flow in the asthenosphere. It is assumed that the large negative Bouguer gravity anomalies beneath Tien Shan are due to the thickening of the lithosphere.
7 Conclusions
The study area is characterized by large Vp/Vs of 1.81 ± 0.025 and large overall stacking amplitude of the P-to-S converted phases beneath most stations, suggesting a mafic crust, which is separated from the mantle by a sharp Moho. Central Tien Shan is mostly different from southern and the northern parts in terms of crustal thickness and Moho sharpness. Additionally, the collision zone between Tien Shan and Tarim Basin has the thickest crust and highest Φ values. The thickest crust of 68 km recorded below Tarim Basin. Distribution of earthquakes suggests that this area is among the seismically most active in Tien Shan. In most cases, crustal thickness increases from north to south, with increasing elevation. The average resulting R (0.17) is similar to the typical crust and decreases towards the northwest. Stations east of the Talas-Fergana strike-slip fault show low Vp/Vs ratios and anomalously thin crust of about 42 km, probably suggesting delamination of the lower crust. The average Bouguer anomalies are large and negative, particularly near the stations in the southern part of Tien Shan where the elevations are the highest. The study suggests these large negative values beneath Tien Shan are a result of thickening of the lithosphere.
Acknowledgment
The authors would like to extend their sincere appreciation to the Deanship of Scientific Research at King Saud University for its funding this research group No. RGP-1436-010.
Declaration of Competing Interest
The authors declare that they have no known competing financial interests or personal relationships that could have appeared to influence the work reported in this paper.
References
- Relatively recent construction of the Tien Shan inferred from GPS measurements of present-day crustal deformation rates. Nature. 1996;384:450-453.
- [Google Scholar]
- Origin, direction, and rate of modern compression of the Central Tien Shan. Geol. Geophys. (Russian). 2002;42(10):1585-1609.
- [Google Scholar]
- On the non-uniqueness of receiver function inversions. J. Geophys. Res. 1990 95, 15, 303–15, 318
- [Google Scholar]
- Active thrusting and folding along the northern tien shan and late cenozoic rotation of the tarim relative to Dzungaria and Kazakhstan. J. Geophys. Res.. 1993;98(B4):6755-6804.
- [Google Scholar]
- Notes on sedimentary basins in China; report of the American Sedimentary Basins Delegation to the People’s Republic of China. U.S. Geol. Survey Open-File Report. 1986;86–327:93-95.
- [Google Scholar]
- A 3D Moho depth model for the Tien Shan from EGM2008 gravity data. Geophys. Res. Abstr.. 2010;12:442.
- [Google Scholar]
- Crustal thickness variations across the northern Tien Shan from teleseismic receiver functions. Geophys. Res. Lett.. 1998;25(7):1055-1058.
- [Google Scholar]
- Tectonics of Asia 50 years after the death of Emile Argand. Eclogae Geol. Helv.. 1991;84:599-629.
- [Google Scholar]
- Late Cenozoic slip on the Talas-Ferghana fault, the Tien Shan, central Asia. Geol. Soc. Am. Bull.. 1996;108(8):1004-1021.
- [Google Scholar]
- Gravity anomalies, the deep structure, and dynamic processes beneath the Tien Shan. Earth Planet. Sci. Lett.. 1990;96:367-383.
- [Google Scholar]
- Evolution of the Paleo-Asian Ocean (Altai-Sayan Region, Central Asia) and collision of possible Gondwana-derived terrenes with the southern marginal part of the Siberian continent. Geosci. J.. 2001;5(3):203-224.
- [Google Scholar]
- Cenozoic tectonics and geodynamic evolution of the Tien Shan Mountain belt as response to India-Eurasia convergence. Himalayan J. Sci.. 2004;2(4):106-107.
- [Google Scholar]
- Chang, Ta, 1959. The Geology of China. 623 p, CCM Information Corporation, New York.
- Elevation of the 410- km discontinuity beneath the central Tien Shan; evidence for a detached lithospheric root Geophys. Res. Lett.. 1997;24:1531-1534.
- [Google Scholar]
- Active Tectonics of the Chinese Tian Shan Mountains. Beijing (in Chinese with English Abstract): Seismology Press; 2000.
- A deep seismic sounding profile across the Tianshan Mountains. Chin. Sci. Bull.. 2000;45(22)
- [Google Scholar]
- Bootstrap methods for standard errors, confidence intervals, and other measures of statistical accuracy. Stat. Sci.. 1986;1(1):54-75.
- [CrossRef] [Google Scholar]
- Earthquake focal mechanisms, deformation state, and seismotectonics of the Pamir-Tien Shan region, central Asia. J. Geophys. Res. 1995 100, 20,321 – 20,343
- [Google Scholar]
- Cenozoic tectonics of Asia; effects of continental collision. Science. 1975;189:419-426.
- [Google Scholar]
- Faulting associated with large earthquakes and the average rate of deformation in central and eastern Asia. J. Geophys. Res.. 1984;89:6203-6227.
- [Google Scholar]
- Southern African crustal evolution and composition: constraints from receiver function studies. J. Geophys. Res.. 2006;111 ISSN: 0148-0227
- [CrossRef] [Google Scholar]
- Three-dimensional seismic velocity structure of the crust beneath the central Tien Shan, Kyrgyzstan: implications for large- and small-scale mountain building. Tectonophysics. 2009;465:30-44.
- [Google Scholar]
- Şengör, A.M.C., Altincr, D., Cin, A., Ustömer, T., Hsu, K.J., 1988. Origin and assembly of the Tethyside orogenic collage at the expense of Gondwana Land. In: Gondwana and Tethys. M.G. Audley-Charles and A. Hallam, eds., Geol. Soc. London. Spec. Publ. 37, 119–181.
- Active faulting and Cenozoic tectonics of the Tien Shan. J. Geophys. Res.. 1979;48(B7)
- [Google Scholar]
- Structure of the lithosphere and asthenosphere of the Tien Shan. Ann. Geophys.. 1984;2:621-626.
- [Google Scholar]
- Towards 3-D fabric in the continental lithosphere and asthenosphere: the Tien Shan. Geophys. Res. Lett.. 2002;29:16.
- [CrossRef] [Google Scholar]
- Receiver function tomography of the central Tien Shan. Earth Planet. Sci. Lett.. 2004;225:131-146.
- [Google Scholar]
- (2006) Crust and Mantle of the Tien Shan from data of the receiver function tomography. Phys. Solid Earth. 2006;42(8):639-651.
- [Google Scholar]
- Crustal structure of the northern margin of the eastern Tien Shan, China, and its tectonic implications for the 1906 M∼7.7 Manas earthquake. Earth Planet. Sci. Lett.. 2004;223:187-202.
- [Google Scholar]
- Paleozoic accretion and Cenozoic redeformation of the Chinese Tien Shan Range, Central Asia. Geology 1989
- [Google Scholar]
- Late Cenozoic tectonic evolution of the southern Chinese Tian Shan. Tectonics. 1998;17:1-27.
- [Google Scholar]
- Tomographic image of the crust and upper mantle beneath the western Tien Shan from the MANAS broadband deployment: possible evidence for lithospheric delamination. Tectonophysics. 2009;477:49-57.
- [Google Scholar]
- Moho depth variation in southern California from teleseismic receiver functions. J. Geophys. Res.. 2000;105(B2):2969-2980.
- [Google Scholar]
Appendix A
Supplementary data
Supplementary data to this article can be found online at https://doi.org/10.1016/j.jksus.2020.02.022.
Appendix A
Supplementary data
The following are the Supplementary data to this article:


