

Translate this page into:
Cost-benefit analysis of shale development in India: A best-worst method based MCDM approach
⁎Corresponding author. gulzarullhasan@mits.ac.in (Md. Gulzarul Hasan)
-
Received: ,
Accepted: ,
This article was originally published by Elsevier and was migrated to Scientific Scholar after the change of Publisher.
Abstract
India has recently started shale exploration in fifty blocks of the country. The shale reserves are exploited by hydraulic fracturing. Most of the shale reserve regions are well-cultivated land for farming. Hydraulic fracturing technology requires a massive amount of water and land, making it controversial in a highly-populated country like India. In this work, the identification of consequences as cost and benefit due to the development of shale production has been carried out. In the existing literature, we have not found any work in the context of India concerning the identification and prioritization of cost and benefit factors due to shale production. This paper incorporates the environmental, economic, and social dimensions of shale development to assess its overall viability. A total of 24 factors (12 costs and 12 benefits) are identified based on an exhaustive literature review. Furthermore, these factors are evaluated and ranked using a multi-criteria decision-making method, i.e., the Best-Worst method. A priority-based taxonomy of factors and their respective categories with mapping to their individual local and global weights has also been presented. It has been found that economic benefit is the highly ranked category followed by environmental and social benefit, whereas in cost, the social cost is more important to emphasize, followed by environmental and economic cost. Among cost factors, “the disturbance of local ecosystem along with local communities” and among benefits “reduction of oil import bill” are the most critical factors. The “generation of high salaried jobs” and “high drilling cost” is the least important benefit and cost factor, respectively. The obtained results will help policymakers, researchers, industrialists, non-governmental organizations, etc., for better decision-making. The obtained results would also be of interest to those countries that are considering shale development.
Keywords
Shale development
Cost-benefit analysis
Sustainable factors
MCDM
Best-worst method
India

1 Introduction
The shale gas is an unconventional source of energy that is trapped inside the sedimentary shale formations deep beneath the earth’s surface. Conventional oil and gas are located between the rock formations and are free-flowing. A rig can be drill straight deep down to the oil pool, and simply natural pressure is needed to pump out the oil and gas from the pool. But in the case of unconventional oil and gas, it is located between the layers and is scattered in small quantities instead of one big pool. To reach into the layers, Horizontal drilling is used, and instead of drilling, method of fracking is used to pump out the oil and gas by creating fractures in the layers, and rock formations around the oil, which makes it easier for oil to move freely and extraction of oil becomes easier (Saniere and Lantz, 2007).
The combination of hydraulic fracturing and horizontal drilling with evolving multi-stage high-pressure fracturing has led to cost-effective oil and gas production in US (Eia et al., 2011). The boom in the US oil and gas due to shale has revolutionized the US energy market with easy access to natural gas supplies. The shale gas development has led to dramatically fall in gas price (Wang and Krupnick, 2015; Lemons, 2014). Once the USA was one of the largest importers of oil and gas, but in the current scenario, the USA is a net exporter of natural gas, all thanks to the shale developments. The USA ranks second in the lowest energy cost, just behind the middle east countries. The spillover effect of low energy cost is widespread in different industries (Wang and Krupnick, 2015). The availability of cheap energy implies higher industrial output at a lower price. The petrochemical industry, manufacturing, and other industries also get benefited from the cheap availability of shale gas. This has increased the USA’s competitiveness and thus has resulted in higher GDP growth. The shale gas development has additionally created a high wage of jobs in the energy sector. The investment in drilling new wells, infrastructure development, pipelines, road, and railway network could generate more jobs in the oil and natural gas sector (Nyquist and Lund, 2014).
As the world has seen the “US shale gas revolution,” many countries are replicating the US model of energy independence and tapping their shale reserves for commercial development of shale oil and gas. The USA experiences a lower import bill, energy independence, job creation through support services, and lower oil price resulted in lower input cost; thus, the competitive gains have been observed in manufacturing, industrial, and other allied services, thus contributing to GDP growth by the shale developments. These positive benefits of shale gas production have influenced other countries for the commercial production of shale.
1.1 Shale gas in India
India is the second-largest populated country in the world. The dichotomy of increasing population and maintaining a healthy growth path at the same time increased the role of energy in India. It makes India, third-largest consumer of energy after China and USA (Dudley et al., 2018). From 1990 to 2018, the primary energy consumption in India is tripled with an equivalent estimated oil consumption of 916 million tons. India needs gas as fuel for its industrial processes. It is expected that in 2019–25, Asia, specifically India and China, will remain the driver of global demand growth of gas with half of the incremental consumption (IEA, 2020). Due to the high import costs of Natural Gas, the government wants to make the country self-dependent by cutting its gas import. It is expected that India’s share in global primary energy demand will reach 11% by 2040, nearly double of its current consumption level (Outlook, 2019). The twin problem of rising oil imports and declining domestic production pose a concern to minimize the adverse impact of oil import on the foreign exchange reserve and the exchange rate simultaneously. One of the primary concerns of India is energy security, so there is a need to enhance the domestic production of petroleum, and natural gas (Jain et al., 2016). Energy import is a threat to the economy. Also, Energy security will become serious over time. Elevated pollution requires a clean source of energy.
Thus, the present need of India is to enhance the domestic production of oil and gas. The government’s strategy for reducing imports includes increasing oil and gas production, improving energy efficiency and productivity, replacing demand, improving refining processes, and promoting biofuels and alternative fuels. A number of steps have also been taken by the government to promote the use of alternative fuels and to encourage ethanol and bio-diesel production. In order to increase the availability of biofuels and encourage advanced biofuels in the country, the government has notified the National Bio-Fuel Policy 2018 (PIB, 2019).
Shale gas acts as one of the unconventional and clean sources of energy. In the last decade, a lot of ups and downs in the hope of finding shale gas has happened in India. Replicating the USA and China, India also has carried out multiple searches for shale gas reservoirs by different National and International agencies. It has been found that India has multiple sedimentary basins having a rich amount of shale. As reported in the EIA report, (EIA, 2015) Indian basins, namely Cambay, Krishna-Godavari, Cauvery, and Damodar Valley, has a good amount of shale gas. If India is able to exploit shale gas to the fullest, it can fulfill the natural gas demand and supply gap. In 2013, The Government issued “Policy Guidelines for Exploration and Exploitation of Shale Gas and Oil by National Oil Companies under Nomination regime.”.
In 2018, the Government of India had approved the policy (https://www.ndrdgh.gov.in/NDR/?page_id=11624). In the first phase, ONGC has started Shale oil and gas exploration in 50 blocks of the country in four basins of seven states of India ( http://www.dghindia.org/index.php/page?pageId=37).
So, In this work, an identification of costs & benefits of shale gas production and their analysis in the context of India using the Multi-criteria decision-making (MCDM) method is presented. In the next section, the motivation and purpose of this research are discussed.
2 Research motivation and objectives
Multiple studies related to shale gas production development by applying MCDM techniques were carried out on different countries like USA (Yang et al., 2017), China (Ren et al., 2015; Yang et al., 2017; Li et al., 2016), Poland (Adamus and Florkowski, 2016), Australia (Cruz et al., 2018) etc. A brief tabulation of research work on shale development with the method, description, and country of study is presented in Table 1. Studies related to the identification and prioritization of the costs and benefits of shale gas production based on extensive literature review were lacking in previous studies. Also, as per our knowledge and thorough study of literature, no previous study was carried out for guiding the general implementation, identification, and prioritization of factors concerning shale development in India. We have not found any concrete work on the costs and benefits due to shale development in India. So, there is a need to study shale development with respect to its serious and unintended consequences and benefits. This study explores and evaluates a comprehensive and unified criteria framework for costs and benefits of shale development by prioritizing the factors and their categories in the Indian context using a Multi-criteria decision-making approach known as best-worst method (Rezaei, 2015).
Reference
MCDM Technique
Brief Description
Country of Study
(Cooper et al., 2018)
Simple Multi-attribute Rating Technique (SMART) method
The objective of this study was to assess the sustainability factors of shale gas in relative comparison to other electricity options. It studies the shale gas exploration effect on sustainibility of future electricity mix. They have presented an investigative study by considering three criteria, namely economic, environmental and social and 18 sub-criteria with nine alternatives.
UK
(Cruz et al., 2018)
Analytic Hierarchy Process (AHP) and System dynamics modeling
This is about decision making for selecting the best water resource to use in shale exploration to balance the factors affecting the regional system. A total of four criteria technical, social, environmental, and economic, nine sub-criteria, and four alternatives are considered.
Australia
(Ren et al., 2015)
fuzzy Analytic Network Process and Interpretative Structural Modeling
This study are about analyzing four criteria (namely economic, environmental, socio-political, and technological) and eighteen sub-criteria of barriers that are affecting the sustainable shale gas revolution in china. It also identified and prioritized eight strategic measures.
China
(Yang et al., 2017)
fuzzy-AHP
The objective was to study the differences of the integrated value of shale gas production development between the United States of America and China. They have considered four criteria (Market prospects, Environmental impacts, Conditions of resource occurrence, and Conditions of extraction & utilization) and twenty-one sub-criteria.
USA & China
(Li et al., 2016)
AHP-Entropy-TOPSIS model
Five types of risks have been identified for overseas shale gas investments, and ten indices have been chosen to assess the risk of foreign shale investments. It also developed an integrated model for assessing the risk using AHP, Entropy weight, and TOPSIS methods. A total of five risk criteria, namely, economic, political, geological, technological, and internal management risks, along with seventeen sub-criteria are considered.
China
(Adamus and Florkowski, 2016)
AHP
The purpose of this study was to determine the alternatives for energy security. It has considered four Merits to study namely Benefits with four criteria and eighteen sub-criteria, Opportunities with three criteria and eleven sub-criteria, Costs with four criteria and sixteen sub-crietria, and finally Risks with three criteria and twelve sub-criteria) with four criteria of political, social, environmental, and economical aspect.
Poland
The aims of this study are: (1) to identify the costs and benefits of shale production in India via an extensive literature review; and (2) to develop a prioritization-based taxonomy for the identified factors using the Best worst method. Following Research Questions (RQ) have been developed to address the objectives of the study:
RQ1: What are the potential costs and benefits of shale development reported in the literature?
RQ2: How can we calculate the priorities of identified cost and benefit factors and their categories?
RQ3: How we can develop a robust taxonomy of the identified factors and their categories?
The remainder layout of the paper is as follows: Section 3 presents the Research methodology. Section 4 describes the results and analysis of our study. In Section 5, we provide a discussion and summary of the results. Section 6 is about research implications and threats to the validity of this research. Finally, Section 7 is the conclusion and future research directions.
3 Research methodology
The outline of the research methodology approach used in this study is presented in Fig. 1. In the first phase, we have identified the Benefits and Costs criteria (category) and sub-criteria (factors) associated with Shale gas development in India using an extensive literature review. Next, we conducted a questionnaire survey study with experts (researchers) to receive feedback on the identified factors and their categories. The responses are collected based on the requirement of the MCDM technique, i.e., Best Worst Method (BWM). The step-by-step procedure of the Best Worst method is discussed in the next section. After collecting responses, we have used the Best Worst Method to rank the Costs and Benefits. Finally, a discussion of policy implications is presented.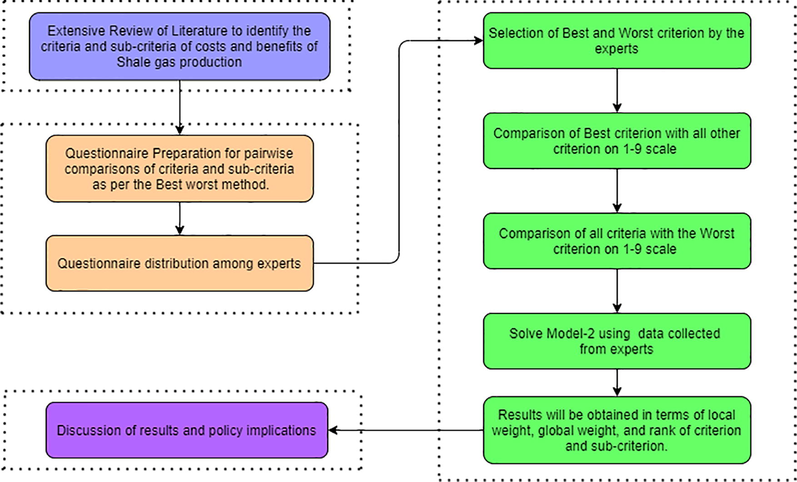
Research Methodology.
3.1 The choice of best-worst method
The conflicting trade-off between multiple factors due to the variability of perceptions of experts makes the decision-making process complex. This complexity is handled by Multi-criteria decision-making methods (MCDM). MCDM methods help decision-makers to make appropriate decisions in complex situations. It helps to determine the order in terms of ranking of factors and their criteria. The ranking of factors depends upon the weights of the criteria for the decision-making process. The weights and ranking of the criteria vary based on pairwise comparisons of experts. For ranking of cost and benefits of shale gas production, the best-worst method has been applied. In Table 1, we can see that most of the authors have applied the AHP approach or in a combination of some other technique. Here for this study BWM approach has been utilized. There are many advantages of BWM over the very famous MCDM technique, i.e., AHP (Rezaei, 2015; Rezaei et al., 2015; Shameem et al., 2020). Because of fewer pairwise comparisons, BWM provides lesser data collection, calculation, and analysis time than the AHP method. It provides results with better reliability and minimal inconsistency. The best-worst method (BWM) is a newly developed MCDM technique proposed by Rezaei (Rezaei, 2015), in 2015. Rezaei (Rezaei, 2015) applied the BWM approach for a mobile phone selection problem. Following its inception, numerous researchers successfully used BWM methodology to solve many real-world decision-making problems. Some of the recent applications are in Wireless ad hoc networks (Ahmad and Hasan, 2021), Terminal location selection (Liang et al., 2021), Robot selection (Ali and Rashid, 2021), Analysis and prioritization of Lean Six Sigma enablers (Singh et al., 2021), Sustainable waste disposal technology selection (Torkayesh et al., 2021), Prioritizing the strategies to handle covid-19 pandemic (Ahmad et al., 2021), and Supply chain management (Amiri et al., 2021). In the next subsection, the step-by-step procedure of the Best Worst approach is explained.
Steps of BWM
This section illustrates the step-by-step procedure of Best Worst Method (BWM) (Rezaei, 2015). In BWM, initially, the Decision Maker determines the best and worst criterion out of the set of criteria. After that, the pairwise comparisons between best criterion and other criteria, also between other criteria and worst criterion are required from the DM. These comparisons are based on the linguistic scale given in Table 2. The scale varies from equally important to extremely important, with numeric values from 1 to 9. Based on these comparisons, a mathematical model has been formulated and solved for collected responses. The mathematical solving model provides us the results in terms of optimal weights of criteria.
Scale
Linguistic term
Scale
Linguistic term
1
Equally Important
6
Intermediate
2
Intermediate
7
Very Important
3
Moderately Important
8
Intermediate
4
Intermediate
9
Extremely Important
5
Important
In BWM, we assume n criteria regarding the decision problem. The step by step procedure of the BWM algorithm are presented as follows:
Step 1. The set of decision criteria i.e. which are needed to be prioritized are identified.
Step 2. Each decision-maker should select the most important (the best) criterion and the least important (the worst) criterion from the set of criteria of step 1.
Step 3. The pairwise comparison of preferences between the best criterion and all other criteria and a pairwise comparison of all criteria with the worst criterion are performed using the comparison scale given in Table 2. The comparisons are collected from each DM on a scale of 1 to 9, i.e., equally to extremely important.
The Best to Others (
) and Others to Worst (
) preferences are shown in Eqs. (1) and (2).
Here, and represents the pairwise preference value between best to other criterion j and j to worst criterion, j = 1, 2, 3,…, n, respectively.
Step 4. The pairwise comparisons obtained in linguistic form are converted to numeric form using Table 2. To find the optimal weights ( ) for ranking of criteria, we will utilize the following mathematical programming model of BWM.
Model 1:
Here, and are the weights of best or most important and worst or least important criterion, respectively. Also, J is the index for criteria. The weight of criterion j is represented by . The inconsistency in pairwise comparisons provided by DM is denoted by . So the linear programming model of model 1 is formulated as model 2. Solving model 2 will provide optimal weight values and inconsistency values for each decision-maker.
Model 2:
Step 5. After solving model 2, the optimal values of
are utilized to determine consistency ratio (CR) for each decision maker. A comparison is said to be fully consistent when
. where,
is the preference of best criterion over criterion j,
is the preference of criterion j over worst criterion and
is the preference of best criterion over worst criterion. The reliability of pairwise comparisons has been checked using the Consistency ratio
. The formulation for CR of
decision maker and group is given by
3.2 The expert’s survey for pairwise comparisons
The experts are selected based on their knowledge of energy, commerce, and the economic state of India. A total of fourteen experts are included. Their expertise area and working experience are provided in Table 3. The number of experts from commerce, economics, and management domains is seven, six, and one. All responses are collected through an online questionnaire survey.1 The survey questionnaire was prepared and the data has been collected through kobotoolbox.2 The data was collected during 7th may 2020 to 31st may 2020. After preparing the questionnaire, it has been checked by the experts and improvements are made in the questionnaire. The data has been collected from a total of 22 experts. After collection of data, all the responses were manually checked to identify incomplete entries. Due to missing values and mistakes in information provided by the experts, only 14 expert’s responses are considered. The questions are designed as per the requirement of BWM. The experts have expressed their responses in terms of pairwise comparisons between equally important to extremely important, i.e., numerically on 1–9 scale. The data has been collected and further analyzed. CR has been evaluated to check the reliability of pairwise comparisons. The results in terms of weights and ranking of cost and benefits of shale gas production in India are evaluated using an excel solver for BWM.
Expert
Experience
Domain
Expert
Experience
Domain
Expert 1
4–6 years
Commerce
Expert 8
0–2 years
Management
Expert 2
2–4 years
Commerce
Expert 9
0–2 years
Economics
Expert 3
4–6 years
Commerce
Expert 10
2–4 years
Economics
Expert 4
2–4 years
Commerce
Expert 11
2–4 years
Economics
Expert 5
2–4 years
Commerce
Expert 12
4–6 years
Economics
Expert 6
0–2 years
Commerce
Expert 13
0–2 years
Economics
Expert 7
4–6 years
Commerce
Expert 14
0–2 years
Economics
4 Result and analysis
The first phase of research methodology is to identify the criteria and sub-criteria of costs and benefits of shale production.
4.1 Identification of cost and benefit factors and their categories due to shale development
The categories and their factors for the benefits and costs of shale production are identified and summarized on the basis of a systematic review of the literature. The identification is based on existing research work and is tabulated in Table 4. The costs and benefits factors were categorized in three sustainable criteria, namely economic, social and environmental categories.
Benefit Criteria (BC)
Benefit Sub-Criteria (BSC)
Literature support
Economic Benefit (BC1)
1. Improve in energy security (BSC1)
(Adamus and Florkowski, 2016)
2. Decline in fuel price (BSC2)
(Mason et al., 2015)
3. Reduction of Oil import bill (BSC3)
(Grecu et al., 2018)
4. GDP growth due to Shale Gas production (BSC4)
(Moore et al., 2014)
Social Benefit (BC2)
1. Skill development in manpower (BSC5)
(Choudhary, 2016)
2. Generation of High salaried jobs. (BSC6)
(Maniloff et al., 2014)
3. Job Creation (BSC7)
(Cooper et al., 2018)
4. Socio-economic development of shale available region. (BSC8)
(Maniloff et al., 2014)
Environmental Benefit (BC3)
1. Less Carbon dioxide emission due to Shale gas production (BSC9)
(Mason et al., 2015).
2. Less water consumption as compared to consumption in Oil and Coal extraction (BSC10)
(Nicot and Scanlon, 2012)
3. Less Green house gas emission due to shale gas production (BSC11)
(Cooper et al., 2016)
4. Benefit of Shale Gas as a Clean energy (BSC12)
(Sovacool, 2014)
Cost Criteria (CC)
Cost Sub-Criteria (CSC)
Literature support
Economic Cost (CC1)
1. High initial cost of setting up of Infrastructure. (CSC1)
(Grecu et al., 2018)
2. High drilling cost. (CSC2)
(Wang, 2018)
3. Cost on Research and Development. (CSC3)
(Mason et al., 2015)
Social Cost (CC2)
1. Health hazards (CSC4)
(Cooper et al., 2016)
2. Less land for farming and agricultural activities (CSC5)
(Grecu et al., 2018)
3. Disturbance in local ecosystem as well as life of local communities (CSC6)
(Gallegos et al., 2015)
4. More Traffic jams (CSC7)
(McCawley, 2015)
Environmental Cost (CC3)
1. Disturbance of Wildlife habitat (CSC8)
(Cooper et al., 2016)
2. Increased earthquake possibilities due to Drilling activities (CSC9)
(Sovacool, 2014)
3. Reduction in availability of ground water due to fracturing (CSC10)
(Grecu et al., 2018)
4. Air Pollution (CSC11)
(McCawley, 2015)
5. Water Pollution (CSC12)
(Moore et al., 2014)
4.1.1 Benefits of shale development
This section is about the benefits factors of shale production. A total of 12 factors are identified with four factors in each category, see Table 4. Replicating the benefits of shale production in other countries, we have chosen these factors in the context of India. The energy boom due to shale gas production has led to a decrease in imports of oil and gas into the USA, which has lowered the energy prices in the country. The exploration of the shale gas reserves has led to economic development and low energy prices. As an alternative to the unconventional source of energy in India, shale gas provides enhanced energy security to the country. The exploitation of shale gas puts declination in other fuel prices. It will also put a reduction of oil imports and subsequently reduce importing prices. The production will affect the GDP to grow by the development of industries.
The development of shale gas has created thousands of jobs and revenues in billions in the Pennsylvania state of America. During 2009, producers in the Marcellus region spent $4.5 billion for exploration of shale gas which generated $3.9 billion in value-added, $389 million in state and local tax revenues, and has created more than 44,000 jobs (Considine et al., 2010). There is higher growth in jobs in the counties having shale gas and tight oil wells. Between 2000 to 2010, Shale oil and boom have created an estimated 2,39,596 net local jobs with 6% higher wages in shale development counties and 10% hike in wages of countries having boom due to shale production (Maniloff et al., 2014). In Arkansas, the natural gas market generated about 40,546 jobs in 2015, which is 3.4% of total Arkansas jobs. (API 2017b). The abundance of oil and gas has increased the local wages, and cumulative social welfare of the local community (Allcott and Keniston, 2018).
In India, In terms of social benefit, due to shale gas production, the manpower will become skilled by the exposure to new technology and machines (Choudhary, 2016). It will create high salaried jobs along with a large number of job creations from low to higher grade. The production region will also be benefited from the development of infrastructure such as roads, electricity, water supply, local markets, colonies, etc.
The shale gas development may create a positive impact on the environment too. The low natural gas prices relative to other fuels due to abundant production and increased supply of shale gas may lead to substitution of coal by gas. Coal or oil generates more carbon dioxide emissions than gas per unit of energy produced. Further, there are lower emissions of air pollutants such as fine particulate matter and mercury (Mason et al., 2015). Carbon dioxide emission is an additional burden and increases the cost per unit of energy produced in the form of the carbon tax. Coal generates twice as much carbon dioxide as natural gas (Cullen and Mansur, 2013). Thus, natural gas can substitute coal as it emits less carbon dioxide relative to other fuels (Sovacool, 2014).
4.1.2 Costs of shale development
This section is about the cost factors. A total of 12 factors are identified with 3, 4, and 5 factors in the economic, social, and environmental category, respectively, see Table 4. Replicating the costs of shale production in other countries, we have chosen these factors in the context of India. The economic cost of shale gas production consists of the High initial cost of Infrastructure setting, drilling and fracturing, and the cost of research development to further minimize the production cost and maximize the extraction. Apart from this, there is a threat that the shale gas region may change the natural landscape by bringing industrialization, heavy traffic, and excess noise. Other industries which are not compatible with the high industrialization, like tourism, fishing, and agriculture, will bear the cost. Many studies have suggested that potentially large tax revenues and higher employment but negative externalities associated with must not be ignored.
The production of shale gas affects social life in a negative way also by putting health hazards due to Waste. The extraction will occupy land and will diminish agricultural activities. It will create disturbance in the local ecosystem and communities. Also, transportation will become worse due to more traffic jams. Heavy transportation may damage the roads. A regular cost will have to bear on the maintenance and repairing of state highways and interstate highways.
As an environmental cost, the wildlife habitat will get disturbed. The fracturing and drilling activities may possibly increase the chance of earthquakes. Further, it has been found that the process of injecting water and extracting the fluids from the ground can increase the chance of seismic tremors; however, the magnitude and intensity may be minimal. The other studies show that the pattern and seismic intensity generated due to shale extraction are uncertain. The groundwater will be reduced due to water requirements in fracturing. Air pollution and water pollution will be increased. The use of water as fluid for injecting into the earth’s surface is prime. High use of water for extraction may reduce the water for public use and reduce water availability for other uses.
4.2 Application of best worst method for prioritizing the identified costs and benefits of shale gas production
The Best Worst method has been applied to determine the prioritized order of costs and benefits. The questionnaire has been prepared as per the requirement of the BWM approach. The step-by-step procedure is as follows.
Step-1 (Proposed hierarchy structure of identified factors and their categories)
This step is the identification of the hierarchy structure. By considering identified costs and benefits, the developed hierarchy structure of factors and their categories is presented in Fig. 2. The goal of this current study is to prioritize the identified criteria (category) and sub-criteria (factors) of costs and benefits due to shale development. The hierarchy structure is divided into four sections where the first one is the goal, the second one is costs and benefits, the third is category, and finally, the fourth is factors.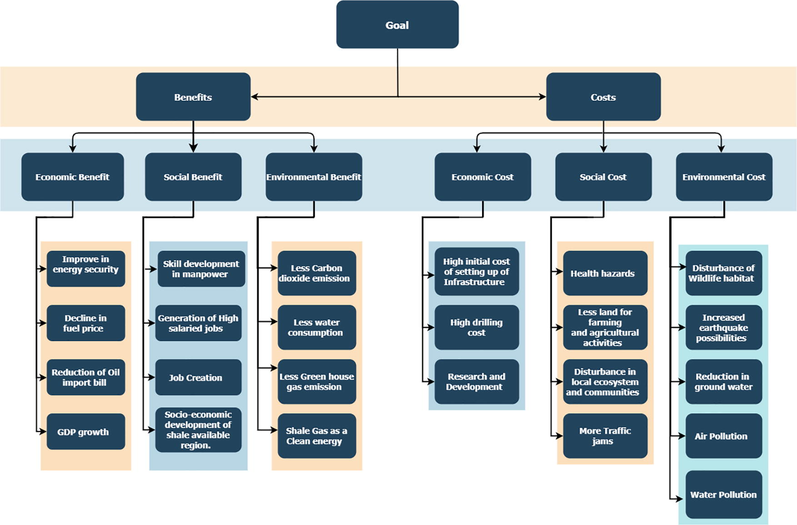
Hierarchy structure of shale gas production development.
Step-2 (Conducting the pairwise comparison)
After structuring the hierarchy of costs and benefits of shale production, a questionnaire has been prepared as per the requirement of the Best Worst Method. This questionnaire is circulated among experts to collect the responses. The information is collected in terms of linguistic responses, which are numerically on a 1–9 scale. The linguistic scale along with the numerical value is given in Table 2.
Initially, the expert has to choose the best and worst criterion from the set of criteria. After this, the response for the pairwise reference comparison of best to all other criteria and all other criteria to worst criterion has been collected. The advantage of the BWM approach while collecting responses is that the number of responses is reduced in comparison to the AHP approach. For example, if there are four criteria, then the total responses collected from an expert for BWM is , i.e., five responses, whereas, in AHP, it becomes , i.e., 10. This property of BWM leads to less inconsistency over the AHP approach. After collecting the responses from the experts, the responses are transformed into numerical form for calculating the weights of criteria and sub-criteria. Along with weights, the consistency ratio using step 5 of Section 3.1 for each expert is also determined and found acceptable.
Local Weight (LW) is used to assess the ranking of a factor within its particular category, and the priority of a factor on the overall objective of the study is expressed by Global Weight (GW). GW is used to determine the final priority ranking of a factor in comparison to all the investigated 12 costs and 12 benefit factors beyond their categories, respectively.
Step-3 (Calculating the local priority weight of factors and their respective categories)
To find out the weights from collected data, the mathematical programming model 2, as explained in step 4 of Section 3.1 has been utilized. We have used the BWM solver for obtaining the weights for each expert. At first, the local priority weight of criteria is calculated then the local weights of sub-criteria of categories are calculated. The local weights obtained from responses of each expert by solving the model for criteria and sub-criteria of benefit and cost category are tabulated in Table 5. The local weights with their rankings for both categories are presented in Table 5. The maximum weight value refers to a more important criterion. The ranks are given based on the largest to smallest weight order.
Benefit Criteria
Weight
BSC
Local weight
Local Rank
Global weight
Global Rank
Economic Benefit (BC1)
0.5000
BSC1
0.2498
3
0.1248
3
BSC2
0.2667
2
0.1332
2
BSC3
0.3017
1
0.1508
1
BSC4
0.1818
4
0.0908
4
Social Benefit (BC2)
0.2386
BSC5
0.2017
3
0.0481
11
BSC6
0.1808
4
0.0431
12
BSC7
0.3236
1
0.0772
6
BSC8
0.2939
2
0.0701
8
Environmental Benefit (BC3)
0.2614
BSC9
0.2070
3
0.054
9
BSC10
0.1921
4
0.0501
10
BSC11
0.2872
2
0.075
7
BSC12
0.3138
1
0.082
5
Cost Criteria
Weight
CSC
Local weight
Local Rank
Global weight
Global Rank
Economic Cost(CC1)
0.2446
CSC1
0.4911
1
0.1201
2
CSC2
0.2246
3
0.0549
12
CSC3
0.2842
2
0.0695
8
Social Cost (CC2)
0.4069
CSC4
0.2621
2
0.0641
10
CSC5
0.2415
3
0.0982
3
CSC6
0.336
1
0.1367
1
CSC7
0.1602
4
0.0651
9
Environmental Cost(CC3)
0.3483
CSC8
0.1795
4
0.073
6
CSC9
0.1619
5
0.0563
11
CSC10
0.2448
1
0.0852
4
CSC11
0.2111
2
0.0735
5
CSC12
0.2025
3
0.0705
7
Step-4 (Calculating the global priority weights.)
The global weights of factors are obtained by multiplying the local weight of factors with the weight of the respective category. For example, In Table 5, the weight of Social benefit is 0.2386 and of BSC5 is 0.2017, then the global weight of BSC5 will become .
Step-5 (Final ranking) The final priority order is determined to rank the identified costs and benefits concerning their significance for the development of shale production in India. To determine the final ranking order in costs and benefits categories, the global weights are utilized and presented in Table 6.
Benefit Sub-Criteria
Weight
Rank
Reduction of Oil import bill
BSC3
0.1508
1
The decline in fuel price
BSC2
0.1332
2
Improve in energy security
BSC1
0.1248
3
GDP growth due to Shale Gas production
BSC4
0.0908
4
The benefit of Shale Gas as a Clean energy
BSC12
0.082
5
Job Creation
BSC7
0.0772
6
Less Greenhouse gas emission due to shale gas production
BSC11
0.075
7
Socio-economic development of shale available region.
BSC8
0.0701
8
Less Carbon dioxide emission due to Shale gas production
BSC9
0.054
9
Less water consumption as compared to consumption in Oil and Coal extraction
BSC10
0.0501
10
Skill development in manpower
BSC5
0.0481
11
Generation of High salaried jobs.
BSC6
0.0431
12
Cost Sub-Criteria
Weight
Rank
Disturbance in local ecosystem as well as the life of local communities
CSC6
0.1367
1
The high initial cost of setting up Infrastructure.
CSC1
0.1201
2
Less land for farming and agricultural activities
CSC5
0.0982
3
Reduction in availability of groundwater due to fracturing
CSC10
0.0852
4
Air Pollution
CSC11
0.0735
5
Disturbance of Wildlife habitat
CSC8
0.073
6
Water Pollution
CSC12
0.0705
7
Cost on Research and Development.
CSC3
0.0695
8
More Traffic jams
CSC7
0.0651
9
Health hazards
CSC4
0.0641
10
Increased earthquake possibilities due to Drilling activities
CSC9
0.0563
11
High drilling cost
CSC2
0.0549
12
5 Discussion and summary
This work sheds light on the costs and benefits due to development activities of shale production. This work will help the researchers, government, and policymakers to implement the development project in a more effective way by considering the identified factors based on their respective priorities. Moreover, The application of the MCDM technique provides the prioritized costs and benefits factors. A taxonomy of the costs and benefit factors by considering their global and local priorities is also presented. The identified cost and benefit criteria were classified in three sustainable categories, namely economic, social and environmental. Also, In each category, factors are identified. The local and global weights of these factors were determined based on the weights of their respective category. A summary of findings of this study are as follows:
Research Question 1 (Identification of costs and benefits of shale development)
We have conducted an exhaustive review of the literature to explore and identify the cost and benefit factors along with categories due to shale development. A total of 24 factors (12 cost and 12 benefit factors) that are critical to address before setting the production plant were identified. We have classified these costs and benefits in three sustainable categories, i.e., economic, social, and environmental.
Research Question 2 (Prioritization of identified criteria and sub-criteria)
We have used the protocols of the Best Worst method in step by step manner to prioritize the identified costs and benefits criteria (category) and their sub-criteria (factors). A questionnaire survey based on BWM has been conducted for collecting information in terms of pairwise comparison from experts to determine the local and global ranks of identified costs and benefits criteria and their sub-criteria. By considering the calculated weight, i.e., priorities using Best Worst Method, we have ranked the identified criteria and their sub-criteria. The selection of the Best Worst Methodology is because of its better understanding of the experts and decision-maker along with less inconsistency in results.
The weights and ranks of Benefit criteria and sub-criteria are presented in Table 5. It shows that the most important benefit criterion is economical, whereas the least important is the social benefit criterion. Among the sub-criteria of economic, social, and environmental benefits, in local ranking BSC3 (Reduction of Oil import bill), BSC7 (Job Creation), and BSC12 (Benefit of Shale Gas as Clean energy) are the highest-ranked factors, respectively. Whereas BSC4 (GDP growth due to Shale Gas production), BSC6 (Generation of High salaried jobs.), and BSC10 (Less water consumption as compared to consumption in Oil and Coal extraction) are the least important factors, respectively. In the global final ranking, BSC3 (Reduction of Oil import bill) is highest ranked followed by BSC2 (Decline in fuel price), BSC1 (Improve in energy security), BSC4 (GDP growth due to Shale Gas production), and other factors as shown in Table 6. The lowest ranking factor is BSC6 (Generation of High salaried jobs). The results indicated that the experts strongly acknowledged the reduction of import bills as a most important benefit due to shale gas production.
The weights and ranks of Cost criteria and sub-criteria are presented in Tables 5 and 6. It shows that the highest-ranked cost criterion is a social cost, followed by environmental cost and economic cost. Among the sub-criteria of economic, social, and environmental costs, in local ranking CSC1 (High initial cost of setting up of Infrastructure), CSC6 (Disturbance in local ecosystem as well as the life of local communities), and CSC10 (Reduction in availability of groundwater due to fracturing) are the highest-ranked factors, respectively. Whereas CSC2 (High drilling cost), CSC7 (More Traffic jams), and CSC9 (Increased earthquake possibilities due to Drilling activities) are the least important factors, respectively. In the global final ranking, CSC6 (Disturbance in local ecosystem as well as the life of local communities) is highest ranked followed by CSC1 (High initial cost of setting up of Infrastructure), CSC5 (Less land for farming and agricultural activities), CSC10 (Reduction in availability of groundwater due to fracturing) and other factors as shown in Table 6. The lowest-ranked factor is CSC2 (High drilling cost). The results indicated that the experts strongly acknowledged the disturbance of the local ecosystem as well as the life of local communities as the highly impacted cost factor due to shale production. Also, the High drilling cost is considered as the least important cost factor due to shale gas production.
Research Question 3 (Taxonomy of identified costs and benefits due to shale development)
The taxonomy of identified criteria and their sub-criteria has been further established by considering their importance for the development of shale. A mapping of the costs and benefits with three key categories, namely, i.e., “Economical,” “Social,” and “Environmental” is presented in Figs. 3 and 4.
Priority based taxonomy of Identified benefit criteria and their sub-criteria due to shale gas production.

Priority based taxonomy of Identified cost criteria and their sub-criteria due to shale gas production.
The taxonomy developed for Benefits, as shown in Fig. 3, indicates that ‘Economic Benefit’ (weight = 0.5) is the highest-ranked category. Moreover, we noted that the ‘Environmental benefit category’ (weight = 0.2614), and ‘Social benefit category’ (weight = 0.2386) is ranked as the second and third most significant categories of identified benefits due to shale production.
Furthermore, the taxonomy of identified factors in the local and global context with respective ranks is also shown in Fig. 3. This demonstrates the importance of a particular factor within the category and for the categories overall. For example, BSC12 (Benefit of Shale Gas as Clean energy) is ranked as the first significant benefit factor in the environmental category, but in comparison to all 12 benefit factors, it is ranked as the fifth most important benefit. Similarly, we noted that BSC6 (Generation of High salaried jobs.) is declared as the least-ranked benefit in global ranking within 12 factors of all categories, and according to local ranking, BSC6 is also declared as the fourth-ranked benefit within the social category. The highest priority benefits within the category and for overall categories are highlighted (Fig. 3). Fig. 3 shows that the four important benefits in global ranking out of 12 benefits of all categories are from the economic category.
Similar to the Benefits category, the developed taxonomy for identified costs is presented in Fig. 4. It indicates that the obtained hierarchy of priority is social (weight = 0.4069) than environmental (weight = 0.3483) and finally economic (weight = 0.2446) criterion for shale production. The local and global ranks are mapped to the respective sub-criteria of each criterion. A total of 12 factors with 3 in economic, 4 in social, and 5 in environmental criteria are identified and mapped. It has been found that CSC6 (Disturbance in local ecosystem as well as the life of local communities) is the highest-ranked factor locally and globally within 4 and 12 factors, respectively. Whereas CSC2 (High drilling cost) is the least important factor locally as well as globally (Fig. 4).
Therefore, the global and local ranks as presented in Figs. 3 and 4, will assist the researchers, government, and policymakers to draft and implement a policy considering the most and least important cost and benefit factors while setting up the shale development activities successfully.
6 Research implications and threat to validity
This research contributes by identification and priority-based taxonomy of the cost and benefit factors with their respective categories for understanding the impact of shale development in context of India. The priority-based taxonomy of costs and benefits factors will help in pathway choice and policy modeling for the realization of development targets of shale in India and other countries too. Regulatory bodies should formulate an integrated policy while considering the cost and benefit factors. The policies should incorporate the factors which are highly important. The conceptual framework developed in terms of factors and their categories would provide policy implications to be regulated as well as best practices to potential shale development, which eventually accelerate the deployment of projects. The results and conclusions will be helpful for the government, policymakers, and developers to formulate the best policies for the development of shale in a sustainable way. The study is valuable, and therefore deserving of near research attention as well.
Like any other research study, this study also has its own threats and restrictions. The scope of this study is limited to sustainable factors and their categories, i.e., economic, environmental, and social aspects. The inclusion of more or fewer factors and categories will change the results of the study. Although the factors included are not yet studied in any existing work. The factors are included by considering the research gap in previous studies. A thorough and exhaustive literature review was carried out for the identification of factors and their categories by all authors. By using the appropriate keywords and exploring Google Scholar and search engines for relevant studies, we attempted to remove this threat. In addition, this given threat is also minimized by including all the authors in the review process and verifying the findings.
Another threat is the expertise of respondents for data collection. This study involved data collection from 21 experts, but the results are obtained from the responses of fourteen of them. The left expert’s responses are denied because of incomplete information. Due to the lack of available experts in highly specialized shale topics since the shale revolution remains current in India, the results may vary by the inclusion of more experts and their specialty. We have taken care of this threat and included researchers working in the field of economics, commerce, and management based on their research experience.
7 Conclusion and future direction
The overall sustainability of the exploitation of shale is unclear. Shale is a new and unconventional source of energy. Many countries, including India, have started exploring their shale reserves as the economy is driven by energy. Successful shale exploitation would increase energy security and reduce the import bill of India. But, like other energy sources, shale development also has its own benefits and costs. The shale reserves are exploited by hydraulic fracturing and consume a large amount of land and water. The use of hydraulic fracturing technology, the requirement of a huge amount of water and land is controversial in a highly-populated country like India. Also, shale is a clean source of energy, and its exploitation will reduce the energy import bill, decline the fuel price and improve energy security. In the present work, we have identified the factors in terms of costs and benefits. As per our knowledge and research, this is the first work in the context of India and other countries concerning the identification along with prioritization based taxonomy of cost and benefit factors due to shale development. To address the research gap, this paper investigates and evaluates the overall sustainability factors, i.e., environmental, social, and economic categories of shale development. The identification of factors is based on an exhaustive literature review. More specifically, we performed a comprehensive cost-benefit identification and analysis, considering a total of 24 (12 costs and 12 benefits) factors.
Furthermore, these factors are evaluated (local and global weight) and ranked using an MCDM technique, i.e., the Best worst method. The advantage of the best worst method is that it reduces the inconsistency of results due to fewer pairwise comparisons. For evaluation of weights and ranking, responses are collected from experts using a questionnaire survey. Following data collection, the selected responses were coded in numerical form, and the consistency of responses was checked by measuring the Consistency ratio. Finally, a priority-based taxonomy of factors with mapping to their respective local and global ranks has also been presented in Figs. 3 and 4. The obtained results will serve to inform Indian policymakers, researchers, industry, and non-governmental organizations, etc., for better decision making. The obtained results were also of interest to countries considering shale development in the future. Furthermore, it has academic value in terms of enriching the comprehensive evaluation and strategy of shale development research systems. After evaluation and ranking, it has been found that economic benefit is the highly ranked category followed by environmental and social benefit, whereas in cost, the social cost is more important to emphasize, followed by environment and economic cost. In cost and benefit factors, “the disturbance of local ecosystem along with local communities” and “reduction of oil import bill” are the most important factors, respectively. The “generation of high salaried jobs” and “high drilling cost” is the least important benefit and cost factor, respectively.
Future studies may benefit by involving more experts. The selected number of factors and their categories can be further increased or decreased, allowing for researchers and policymakers to evaluate regional or country-specific outcomes for better policy drafting and decision making. Further extension can also be made by analyzing through other MCDM methods such as AHP, ELECTRE, fuzzy-AHP, fuzzy-BWM, Intuitionistic fuzzy-BWM, etc. A comparison of results for different MCDM methods under deterministic and uncertain information may provide more insight into the prioritization-based taxonomy of factors.
Author Contributions: Conceptualization, formal analysis, investigation, methodology, software, validation, visualization, writing–original draft, review and editing by MGH; Conceptualization, formal analysis, investigation, methodology, validation, writing–original draft, review and editing by MRN; Conceptualization, investigation, methodology, validation, writing–original draft, review and editing, funding acquisition by ARAG All authors have read and agreed to the published version of the manuscript.
Funding: The Research Work is supported by the Deanship of Scientific Research, College of Science-Research Center, King Saud University, Riyadh, Saudi Arabia.
Acknowledgment
The authors are thankful to the journal editor, anonymous referees, and assistant editor for their fruitful constructive comments and suggestions for the improvement of the manuscript. The Project was supported by King Saud University, Deanship of Scientific Research, College of Science-Research Center.
Declaration of Competing Interest
The authors declare that they have no known competing financial interests or personal relationships that could have appeared to influence the work reported in this paper.
References
- The evolution of shale gas development and energy security in poland: Presenting a hierarchical choice of priorities. Energy Research & Social Science. 2016;20:168-178.
- [Google Scholar]
- Self-adaptive query-broadcast in wireless ad-hoc networks using fuzzy best worst method. Wireless Networks. 2021;27:765-780.
- [Google Scholar]
- Identification and prioritization of strategies to tackle covid-19 outbreak: A group-bwm based mcdm approach. Applied Soft Computing. 2021;111:107642
- [Google Scholar]
- Dutch disease or agglomeration? the local economic effects of natural resource booms in modern america. The Review of Economic Studies. 2018;85:695-731.
- [Google Scholar]
- A new fuzzy bwm approach for evaluating and selecting a sustainable supplier in supply chain management. International Journal of Sustainable Development & World Ecology. 2021;28:125-142.
- [Google Scholar]
- More than 19 lakh people to be trained over next 10 years in oil and gas sector. India: The Economic Times; 2016. URL:https://economictimes.indiatimes.com/jobs/more-than-19-lakh-people-to-be-trained-over-next-10-years-in-oil-and-gas-sector/articleshow/52663744.cms?from=mdr
- The economic impacts of the pennsylvania marcellus shale natural gas play: an update. Department of Energy and Mineral Engineering, The Pennsylvania State University; 2010.
- Shale gas: a review of the economic, environmental, and social sustainability. Energy Technology. 2016;4:772-792.
- [Google Scholar]
- Sustainability of uk shale gas in comparison with other electricity options: Current situation and future scenarios. Science of the Total Environment. 2018;619:804-814.
- [Google Scholar]
- Water resource selection and optimisation for shale gas developments in australia: A combinatorial approach. Computers & Industrial Engineering. 2018;124:1-11.
- [Google Scholar]
- Will carbon prices reduce emissions in the us electricity industry? evidence from the shale gas experience. Work. Pap.. 2013.
- Dudley, B., et al., 2018. Bp statistical review of world energy. BP Statistical Review, London, UK, accessed Aug 6, 00116.
- Annual energy outlook 2011 with projections to 2035. Washington DC: Energy Information Administration, United States Department of Energy; 2011.
- Technically recoverable shale oil and shale gas resources: India and pakistan. US Energy Information Administration; 2015.
- Hydraulic fracturing water use variability in the u nited s tates and potential environmental implications. Water Resources Research. 2015;51:5839-5845.
- [Google Scholar]
- The economic, social and environmental impact of shale gas exploitation in romania: a cost-benefit analysis. Renewable and Sustainable Energy Reviews. 2018;93:691-700.
- [Google Scholar]
- IEA, June 2020. Gas 2020:analysing the impact of the covid-19 pandemic on global natural gas markets URL:https://www.iea.org/reports/gas-2020/2021-2025-rebound-and-beyond.
- Jain, A.K., Aayog, N.I.T.I. and Ram, R., 2016. Shale gas in India: challenges and prospects.
- Lemons, K., 2014. The shale revolution and opec: Potential economic implications of shale oil for opec and member countries.
- Inland terminal location selection using the multi-stakeholder best-worst method. International Journal of Logistics Research and Applications 2021:1-23.
- [Google Scholar]
- Assessing risk in chinese shale gas investments abroad: Modelling and policy recommendations. Sustainability. 2016;8:708.
- [Google Scholar]
- The local economic impacts of hydraulic fracturing and determinants of dutch disease. In: Division of Economic and Business Working Paper Series, Colorado School of Mines. 2014.
- [Google Scholar]
- The economics of shale gas development. Annual Review of Resource Economics. 2015;7:269-289.
- [Google Scholar]
- Air contaminants associated with potential respiratory effects from unconventional resource development activities. In: Seminars in Respiratory and Critical Care Medicine. Thieme Medical Publishers; 2015. p. :379-387.
- [Google Scholar]
- Moore, V., Beresford, A., Gove, B., 2014. Hydraulic fracturing for shale gas in the uk: Examining the evidence for potential environmental impacts. The Royal Society for the Protection of Birds (RSPB), London, UK Retrieved from: https://www.rspb.org.uk/Images/shale_gas_report_evidence_tcm9-365779.pdf.
- Water use for shale-gas production in texas, us. Environmental Science & Technology. 2012;46:3580-3586.
- [Google Scholar]
- Nyquist, S., Lund, S., 2014. Shale revolution: opportunity to jump-start economic growth. Available from: http://www. forbes. com/sites/realspin/2014/11/19/the-shale-revolution-is-an-opportunity-to-jumpstart-economic-growth-in-us.[Last retrieved on 2014 Nov 19].
- Outlook, B.E., 2019. Bp energy outlook 2019 edition the energy outlook explores the forces shaping the global energy transition out to 2040 and the key uncertainties surrounding that. BP Energy Outlook 2019.
- PIB, D., Feb 2019. Reducing crude oil and gas imports URL:https://pib.gov.in/Pressreleaseshare.aspx?PRID=1564247.
- Sustainability, shale gas, and energy transition in china: assessing barriers and prioritizing strategic measures. Energy. 2015;84:551-562.
- [Google Scholar]
- Linking supplier development to supplier segmentation using best worst method. Expert Systems with Applications. 2015;42:9152-9164.
- [Google Scholar]
- Saniere, A., Lantz, F., 2007. Conventional and non conventional oil supply to 2030: a world-wide economic analysis based on a modelling approach, in: Developing & Delivering Affordable Energy in the 21st Century, 27th USAEE/IAEE North American Conference, Sept 16–19, 2007, International Association for Energy Economics.
- Analytic hierarchy process based prioritisation and taxonomy of success factors for scaling agile methods in global software development. IET Software. 2020;14:389-401.
- [Google Scholar]
- Analysis and prioritization of lean six sigma enablers with environmental facets using best worst method: A case of indian msmes. Journal of Cleaner Production. 2021;279:123592
- [Google Scholar]
- Cornucopia or curse? Reviewing the costs and benefits of shale gas hydraulic fracturing (fracking) Renewable and Sustainable Energy Reviews. 2014;37:249-264.
- [Google Scholar]
- Sustainable waste disposal technology selection: The stratified best-worst multi-criteria decision-making method. Waste Management. 2021;122:100-112.
- [Google Scholar]
- Shale gas exploitation: Status, problems and prospect. Natural Gas Industry B. 2018;5:60-74.
- [Google Scholar]
- A retrospective review of shale gas development in the united states: What led to the boom? Economics of Energy & Environmental Policy. 2015;4:5-18.
- [Google Scholar]
- Integrated value of shale gas development: A comparative analysis in the united states and china. Renewable and Sustainable Energy Reviews. 2017;76:1465-1478.
- [Google Scholar]


