

Translate this page into:
Copper and mercury exposure alters rectum microbiota in female adult mice
⁎Corresponding authors. ahrar1122@yahoo.com (Ahrar Khan), Pingliujx@163.com (Ping Liu), hgljx3818@jxau.edu.cn (Guoliang Hu)
-
Received: ,
Accepted: ,
This article was originally published by Elsevier and was migrated to Scientific Scholar after the change of Publisher.
Abstract
Objectives
Copper (Cu) and mercury (Hg) are major pollutants worldwide, but the gastrointestinal damage caused by copper and mercury exposure is unclear. We are committed to scientific research on the harm and transformation of copper and mercury exposure to the rectal microbial population of female mice.
Methods
Kunming mice (n = 24) were randomly divided into four equal groups, i.e., 1) Rectal Colon Control (RCK) group, 0 mg/kg of Cu and Hg), 2) Rectal Copper (RCu group), 5 mg/kg weight of Cu), 3) Rectal Mercury (RHg) group, 2 mg/kg weight of Hg) and 4) Rectal copper-mercury (RCH) group, 2.5 and 1 mg/kg weight of Cu and Hg. On the 90th day, the rectal and intestinal tissues were analyzed for pathophysiology, and quantitative analysis by PCR, then a library was prepared, and sequencing was carried out.
Results
The rectal tissue of the RCu and RCH group had histopathological and physiological damage, including low weight, low pH value, increased thickness of the outer muscle layer, smooth muscle tissue, widening of the submucosal layer, reduction of goblet cells, blunt intestinal villi and severe aging of the central mammary duct. In addition, Sequencing results of 16S rRNA genes compared with RCK showed that the abundance of the Treponema, Coprococcus, and Dehalobacterium in RCu was more significant than the RCK. Still, the bacillus, Jeotgalicoccus, Salinicoccus, Staphylococcus, and Ignatzschineria was just the opposite. The abundance of Butyricimonas, Streptococcus, Dehalobacterium, Coprococcus, Oscillospira, and Helicobacter in RHg was more significant than in the RCK. Still, Corynebacterium, Bacillus, Jeotgalicoccus, Salinicoccus, Staphylococcus, Lactococcus, and Ignatzschineria were the opposite. We found some similar exciting things. The abundance of the Dehalobacterium, Coprococcus, and Oscillospira was significantly more significant than the RCK. Still, the Corynebacterium, Salinicoccus, Jeotgalicoccus, Staphylococcus, Lactococcus, Sutterella, and Ignatzschineria were the opposite. In addition, the Staphylococcus in RCu was increased than in the RCH, and the Streptococcus in RCu was increased than in the RCH.
Conclusion
The results of the present study furnish a source for a more precise validation of the risk of digestive tract diseases driven by Cu and Hg.
Keywords
Mice
Intestinal microbiota
Copper
Mercury
Rectum
16S rRNA

- ONP
-
Nitrophenol
- RCK
-
Rectal Colon Control group
- Cu
-
Copper
- Hg
-
Mercury
- RCu
-
Rectal Copper group
- RHg
-
Rectal Mercury group
- RCH
-
Rectal copper-mercury group
- OTUs
-
Operation classification modules
- PG
-
Nitrobenzene-β-D-galactopyranoside
- SOD
-
Superoxide dismutase
- GI
-
tract gastrointestinal
- CAT
-
Catalase
Abbreviations
1 Introduction
Heavy metal pollution is a specific source of air pollution, such as environmental pollution, mining, environmental quality, and animal concentrate (Zulkafflee et al., 2019). Heavy metals such as copper and mercury are environmental pollutants causing health problems for humans and other animals. Copper and mercury are two heavy metal environmental pollutants. Copper is a key mining component and a common phenomenon (Kim et al., 2000). On the other hand, essential minerals such as copper are nutrient elements that can promote growth and development and assist in treating anemia. Still, it is also an uncertain harmful substance, which depends on the amount of touch.
Mercury is a non-ferrous metal element but is also one of the heavy metals with the highest toxic and side effects in the natural environment. Mercury is a toxic and harmful pollutant, which is challenging to metabolize after entering the body and can harm fetal growth beyond the embryo (Wang et al., 2017).
Many studies focus on transforming microbial strains and green plant rhizome groups in areas polluted by copper and mercury (Uriu-Adams and Keen, 2005). Still, little attention is paid to animals' physical and mental health. According to bioconcentration, because they are also victims of copper and mercury pollution, animals have a similar system to adjust heavy metals, namely intestinal microbiota. The intestinal microbiota is a wide variety of microbial strains that settle on the length and total width of the digestive tract of lactating animals (Lee and Hase, 2014). Today, the intestinal microbiota endangers the host organ/system and shows everyone's interdependence and coevolution (Song et al., 2018). The uptake of copper and mercury is carried out through the intestines and stomach. Therefore, copper and mercury pollution will undoubtedly have a beneficial or harmful impact on intestinal microorganisms. Some new information is likely to appear in transforming intestinal bacteria in animals polluted by copper and mercury.
This experiment was studied to investigate the harm and transformation of copper and mercury to the microbial population of mouse rectum. To achieve this better, we investigated the composition of intestinal bacteria by evaluating the 16S rRNA transcriptome sequence. Hopefully, results will help better understand the potential efficacy of copper and mercury in gastrointestinal diseases.
2 Materials and Methods
2.1 Compliance with ethical standards
The Animal Health Care and Application Federation of Animal Science and Technology, School of Jiangxi Agricultural University, approved all animal experiments.
2.2 Samples collection
We have made every effort to minimize the pain of animals. All animals have obtained the permission of the Animal Welfare Federation of Guangxi University. Twenty-four adult female mice (7 days old; mean weight = 27.40 g) were randomly divided into four equal groups: 1) Rectal Colon Control (RCK) group, 0 mg/kg of Cu and Hg), 2) Rectal Copper (RCu group), 5 mg/kg weight of Cu), 3) Rectal Mercury (RHg) group, 2 mg/kg weight of Hg and 4) Rectal copper-mercury (RCH) group, 2.5 and 1 mg/kg weight of Cu and Hg. Mice were trapped in iron cages (n = 6/cage) and had access to a basic diet (Zhengzhou Tuduo Feed Technology Co., Ltd., Zhengzhou, Henan Province, China) and water ad libitum. This study used copper chloride (CuCl2) and mercury chloride (HgCl2). On day 90, all mice were weighed and euthanized before cervical dislocation. Colon contents from each mouse were harvested in an Eppendorf tube (1.5 mL) under sterile conditions and stored at –80 °C for further analysis.
2.3 Intestinal pathophysiological examination
Morbid organs were collected for histopathology. The colon was dried, cleaned, and placed in 10% neutral buffered formalin for fixation. Tissues were then washed, dehydrated in ascending grades of alcohol, cleared in xylene, impregnated, and embedded in paraffin tissues. Sections 4–5 μm thick were cut and stained with hematoxylin and eosin (Ahmad et al., 2021) and we examined tissue sections under a microscope (Anderson et al., 2022).
2.4 DNA acquisition and amplification
The total gene DNA of the mouse colon was obtained by Agilent high sensitive DNA detection kit (Agilent, USA). Agilent 2100 (Agilent, USA) was used for DNA quantitative analysis and detected DNA purity on 1 % agarose electrophoresis. We diluted the DNA with diluent to 1 ng/mL with sterile water according to the concentration. The primers of 16S V4 were designed as 520f (5-aytggydtaaagng-3) and 802r (5-tacnvgggtatctacc-3). PCR Eppindorff tube total volume was 50 µL composed of 25 µL Phusion composition of high-fidelity audio PCR main mixture (New England Science Laboratory), 0.2 mm forward and reverse primer design, and 10 ng DNA template. The RT-qPCR curve is as follows: 98 °C for 1 min, 30 circulation systems at 98 °C for 10 s, 50 °C for the 30 s, and 72 °C for 60 s.
2.5 Quantitative evaluation and purification of PCR substances
Mix the same volume of 1x loading buffer solution (Quant it PicoGreen dsDNA analysis and detection kit, Invitrogen, file directory # p7589) with PCR substances. Then, we tested it by electrophoresis on 1% agarose electrophoresis. We selected the samples with the main band chromaticity in the middle of 400–450 base pairs for further testing. The PCR materials were mixed with equal relative density and then purified with a genejet suspect gel acquisition detection kit (Thermo Scientific). The increased substance was found on 1 % agarose. According to the manufacturer's instructions, gelgreendna was used to color the suspected glue in 1x Tris-acetate-EDTA (TAE) buffer solution. Then cleaned with wizard, SV suspected glue, and PCR cleaning system software (Chambonel Les Promega in France).
2.6 Library preparation and sequencing in advance
Sequencing and analysis were carried out by M/S Parsonabio (Shanghai, China). In short, according to the manufacturer's proposal, NEB NEXT1 ultratm DNA library applicable to Illumina (Nebraska, USA) is applied to prepare the detection kit in advance, convert it into a sequencing library, and add database index coding. Cupid dog evaluated the quality of the library @ 2.0 fluorometer (Thermo Scientific) and Agilent 2100 system software (Agilent 2100). Finally, the library was sequenced on Illumina miseq service platform and transformed into 250 bp/300 bp matched tail reading code.
2.7 DNA-based data analysis
Used Flash (V1.27) to splice paired tail reads from initial DNA fragments. https://ccb.kju.edi/software/flash, the design scheme combines the pair's tail-end reading when at least a part of the reading coincides with the task transformed from the other end of the same DNA fragment. Assign matching end reading values to each sample according to the unique barcode. Sequence analysis was carried out with uparse mobile phone software. Sequences with 97 % homogeneity were assigned to consistent, practical operation classification modules (OTUs). We selected a representative sequence for each OTU and annotated the classification information network for each usual sequence using RDP support vector machine (Table 1). According to the results of the OTU table, Chao1 index and Shannon index are calculated. Originpro 8 data visualized the relative abundance of pathogen diversity patterns from door to species.
Sample ID
Effective sequence
High quality
Ratio(%)
Sample ID
Effective sequence
High quality
Ratio (%)
RCK 1
28,319
23,714
83.74
RCU 1
51,133
42,394
82.91
RCK 2
35,225
28,821
81.82
RCU 2
27,034
21,757
80.48
RCK 3
30,576
25,357
82.93
RCU 3
27,765
23,100
83.20
RCK 4
70,192
57,896
82.48
RCU 4
29,821
24,024
80.56
RCK 5
28,709
23,319
81.23
RCU 5
29,790
24,590
82.54
RCK 6
27,159
21,454
78.99
RCU 6
78,235
64,589
82.56
RHG 1
52,914
43,455
82.12
RCH 1
48,119
37,368
77.66
RHG 2
37,184
29,415
79.11
RCH 2
27,598
21,376
77.45
RHG 3
46,203
35,738
77.35
RCH 3
28,858
23,049
79.87
RHG 4
54,016
38,715
71.67
RCH 4
28,337
21,360
75.38
RHG 5
50,433
42,046
83.37
RCH 5
51,190
39,552
77.27
RHG 6
29,493
24,516
83.12
RCH 6
46,804
35,999
76.91
2.8 Measures of microbial diversity
Alpha diversity analysis was carried out to assess whether the identified 16S rRNA coding sequence contained all the bacteria in the sample. It was investigated using the microbial strain biological quantitative analysis insight (QIIME) package (version 1.7.0). To better evaluate alpha diversity, we used Chao 1 estimator and an ace to analyze community richness and the Shannon index and Simpson index to analyze community diversity (Casquilho, 2016). The rarity curve illustrates that the total number of distinctive bacterial species is challenging to increase with the increase of the number of identified coding sequences (Xu et al., 2014). Unlike alpha diversity, beta diversity is a community structure used to study the homogeneity between different samples scientifically. Total diversity (gamma diversity) is determined by diversity at two levels: α Diversity and β Diversity. Principal component analysis (PCA), multi-dimensional limit analysis (MDS), and cluster analysis were used to consider sample differences. The detailed data has been submitted to NCBI short reading archives database for query, and the login name is prjna418397.
2.9 Statistical analysis
Application SPSS19 0 for windows for statistical analysis. Nonparametric one-way ANOVA, Mann Whitney U test, or trainee test was applied where appropriate. P < 0.05 was considered statistically significant.
3 Results
3.1 Body weight
The weight of mice in the copper test group (29.25 ± 0.25 g) was significantly lower than that in the control group (31.49 ± 0.37 g). Compared with the RCK group, the colon of the three treatment groups (RCU, RHg, and RCH groups) showed histopathological damage (Fig. 1). The histopathological lesions comprised increased thickness of inner and outer musculature, enlargement of the submucosa, mild to moderate necrosis of enterocytes, and decreased number of goblet cells. There was slight to mild and moderate atrophy of intestinal somatic cells, stunting and fusion of intestinal villi, and severe deterioration of the middle mastoidal. Moreover, the length of the glands was significantly lower in the treatment groups than in the control group.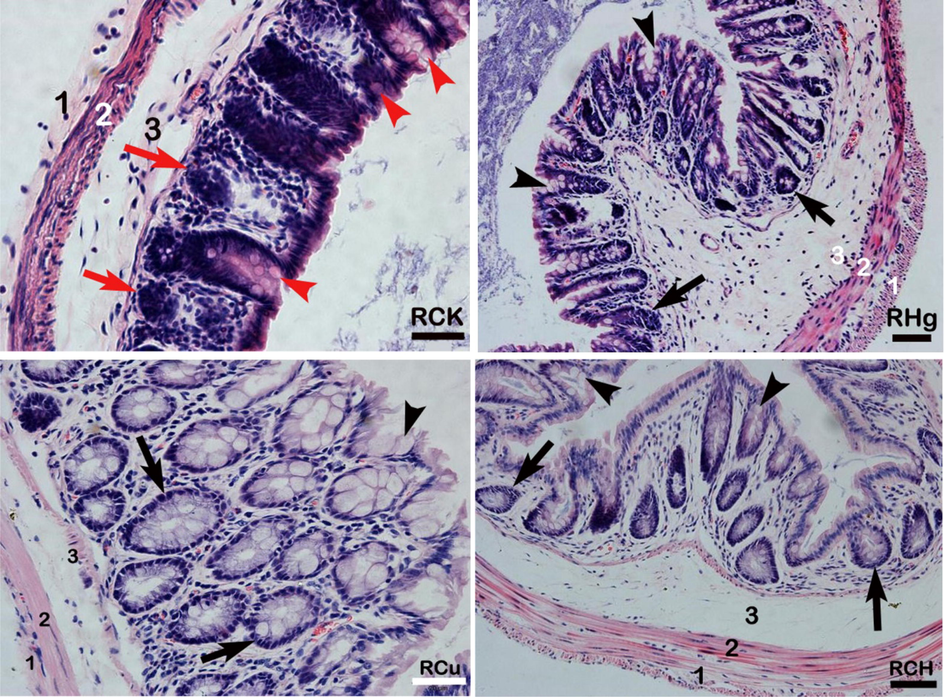
Pathological analysis of colon mechanism. Control group (RCK group), copper group (RCu group), mercury group (RHg group), and copper-mercury group (RCH group). The numbers in the figure represent 1) the inner muscle layer, 2) the outer muscle layer, 3) the submucosal layer, goblet cells (arrowheads), intestinal glands (arrows), villi, and intermediate papillae. H & E, Bar = 20 µm.
3.2 Beta diversity analysis
The partial least squares discriminant analysis (PLS-DA) method is carried out on all four groups (Fig. 2). The PLS-DA method is used to classify each group of samples, which shows that people's classification method has a good performance.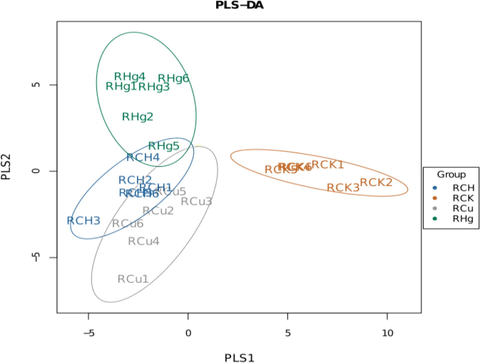
Principal component analysis (PCA) of samples. The top 2 PCs are used as X and Y coordinates. Each sample represents a point. Samples from different sources have different colors: 1) RCH group (blue), 2) RCK group (orange), 3) RCu group (gray), and 4) RHg group (green).
3.3 Sequence data and OTUs
As shown in Fig. 3a, the OTUs were marked at the phylum to species and unclassified by the RDP classifier, the 16S rRNA sequence, and the Green Gene database. The variations of all 2912 were shown in the Venn diagrams Fig. 3b. A total of 1510 unique phylum OTUs were presented in the Venn diagrams Fig. 3b. At the taxonomic genus level, 545 unique bacterial genera were identified in all the samples. The OTUs (43.99 %) were highly similar to the bacterial community structures, but each group had some unique OTUs. It can be seen that unique OTUs in RCH, RCu, RHg, and RCH are 11.29, 0.66, 1.33, and 2.69 %, respectively. This process demonstrated the distinctiveness, resemblance, and overlap of the OTUs arrangement of the samples.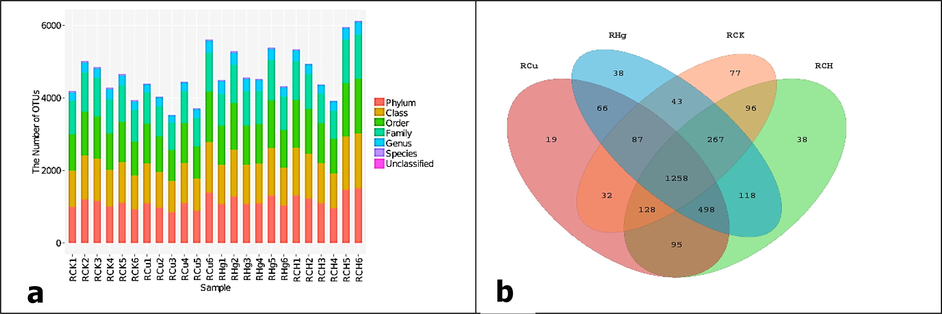
a) OTU identification and category data analysis results. OTU number of phyla, class, order, family, genus, and species. The number of OTUs that cannot be classified into all known groups is specified as “unclassified”. b) The Venn diagram shows different groups' unique and shared OTUs.
3.4 Alpha diversity of the sequencing data
According to the sparse analysis of OTU, as shown in Fig. 4 below, the recycled sequence well represents the diversity of the four groups of bacterial biological communities. The rarity curves of the observed species number (Fig. 4A), tide index value (Fig. 4b), and Shannon index (Fig. 4C) achieve a service platform, depending on the identified sequence, is likely to be enough to cover the bacteria in the sample plate. The level evolution rate curve (Fig. 4D) and species accumulation curve are becoming more and more stable, indicating that species are evenly distributed.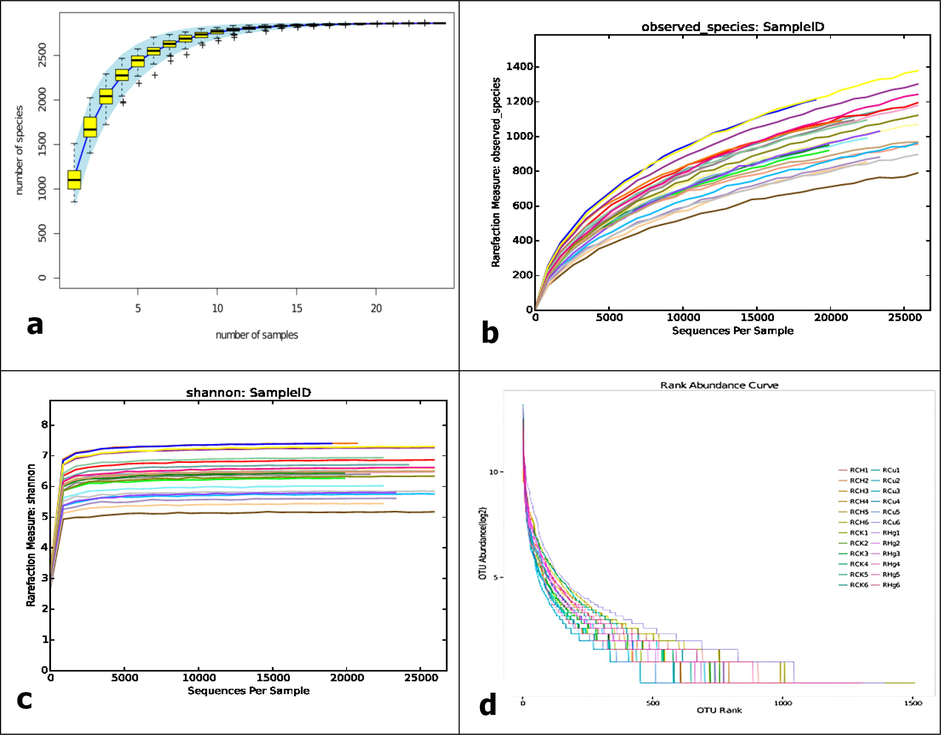
a & b) Observe the rarity curve of alien species. c) Shannon curve. With the increase in identification sequences, the Shannon curve has become a service platform, which shows that the identification sequence can adequately cover the bacteria in the sample. d) Rank evolution rate curve. Each curve represents OTU distribution in one sample. The smoother the curve, the higher the symmetry of the plot.
3.5 The analysis is based on the phylum level
As shown in Fig. 5, 10 different doors are seen in the gastrointestinal contents. Firmicutes, Proteobacteria, Bacteroidetes, and Acidobacteria exist in the bacterial community as four significant dominant bacteria with an abundance ratio > 1 visible. Among them, Bacteroidetes and Firmicutes were the two most predominant bacterial groups. On the contrary, the other 6 species were detected but showed lower relative abundance, composed of TM7, Verrucomicrobia, Spirochaetes, Tenericutes, Deferribacteres, and Cyanobacteria. The comparison of the homogeneity spacing of bacterial communities reveals some interesting findings. However, the abundance of bacteria changed in the three groups but not significantly relative to the RCK group, except for Spirochaetes.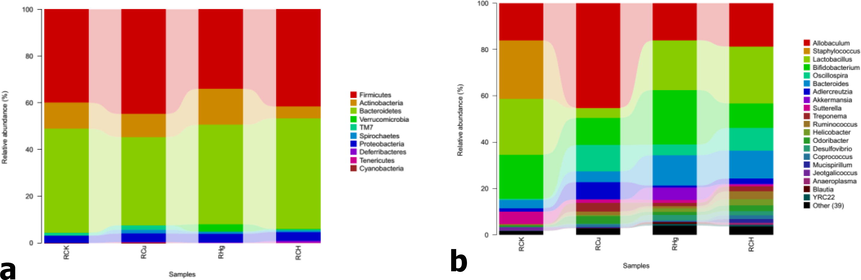
A) Relative abundances at the phylum level and b) Relative abundances under the bacterial genus.
3.6 The analysis based on the genus level
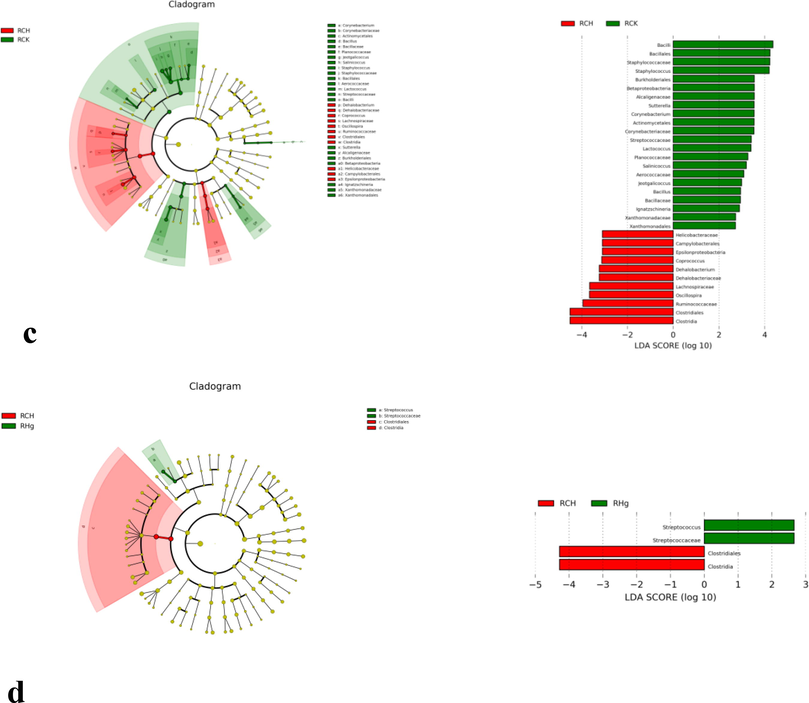
It can be seen from Fig. 6a that a total of above 20 genera are identified in samples and composed of Allobaculum (11.26 ± 5.61 %), Lactobacillus (8.9 ± 4.34 %), Bifidobacterium (8.17 ± 3.82 %), Bacteroides (3.95 ± 2.20 %), Staphylococcus (3.40 ± 5.83 %), Oscillospira (2.87 ± 1.81 %), Adlercreutzia (1.37 ± 1.22 %), Sutterella (1.13 ± 0.99 %). And the low abundance is composed of 39 species of other bacteria. However, in contrast to the smaller changes in the phylum level, the abundance of bacteria dramatically changes at the genus level. It can be seen from the graph the dominant genus had different abundances among the four samples. There was a significant abundance of Treponema, Coprococcus, and, Dehalobacterium in RCu compared to the RCK group. Still, the bacillus, Jeotgalicoccus, Salinicoccus, Staphylococcus, and Ignatzschineria was just the opposite. The abundance of Butyricimonas, Streptococcus, Dehalobacterium, Coprococcus, Oscillospira, and Helicobacter in RHg was significantly larger than in the RCK group. Still, Corynebacterium, Bacillus, Jeotgalicoccus, Salinicoccus, Staphylococcus, Lactococcus, and Ignatzschineria were the opposite. And then, we can find some similar exciting things, the abundance of the Dehalobacterium, Coprococcus, and Oscillospira was also obviously larger than the RCK, but the Corynebacterium, Salinicoccus, Jeotgalicoccus, Salinicoccus, Staphylococcus, Lactococcus, Sutterella and Ignatzschineria was just the opposite. In addition, the abundance of Staphylococcus in RCu was larger than in the RCH, and the quantity of Streptococcus in RCu was significantly larger than in the RCH.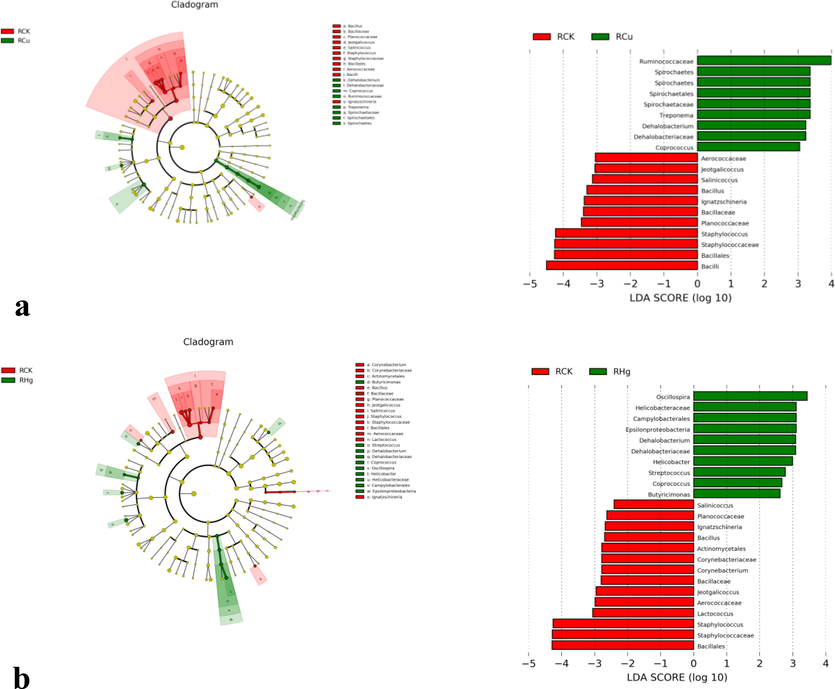
The branch diagram of significant differences between groups, including the comparison between the control group and RCU group (a), control group and rhG group (b), control group and RCH group (c) and its RCH group and rhG group (d). The branch diagram shows the level association of the template from door to genus (from inner ring line to outer ring line in the diagram). The size of the connection point indicates the mean relative abundance. The Yellow connecting point suggests that there is no significant difference between the two groups (P > 0.05), but other colors (such as emerald green and bright red) indicate that this OTU has a significant difference between the two groups (P < 0.05). LDA score means that there are different classification groups after copper or/and mercury solution (only classification groups conforming to LDA) ≥ as shown in Figure 2.5 below).
The branch diagram of significant differences between groups, including the comparison between the control group and RCU group (a), control group and rhG group (b), control group and RCH group (c) and its RCH group and rhG group (d). The branch diagram shows the level association of the template from door to genus (from inner ring line to outer ring line in the diagram). The size of the connection point indicates the mean relative abundance. The Yellow connecting point suggests that there is no significant difference between the two groups (P > 0.05), but other colors (such as emerald green and bright red) indicate that this OTU has a significant difference between the two groups (P < 0.05). LDA score means that there are different classification groups after copper or/and mercury solution (only classification groups conforming to LDA) ≥ as shown in Figure 2.5 below).
4 Discussion
In humans, healthy gut microbiota plays a vital role in the host, giving kinetic energy, nutrients, and immune maintenance (Safari and Younessi, 2017). In addition, it has certain tolerance and some extreme standards that can change them, such as heavy metal pollution (Li et al., 2019). Copper is an essential nutrient for all animals, and too much may lead to anorexia, nausea, vomiting, always wanting to sleep, and gastrointestinal bleeding (Ding et al., 2019). Mercury has strong toxic side effects in cell biology and physiology. Mercury in organic form can cause corrosive esophagitis, intestinal bleeding, and GI tract diseases, such as corrosive esophagitis and fecal bleeding. The damaged GI tract threatens the digestion and assimilation of nutrients, resulting in weight loss (Wu et al., 2020). It is reported that excessive exposure to copper will lead to the release of active substances of microbial strains, such as biological macromolecular humic acid and acid-rich or microbial strain exudate (Ruan et al., 2019). Water-soluble mercury salt is strong and highly toxic, which can cause general corrosive harm to the gastrointestinal tract. In RCu and RHg groups, the thickness of adventitia, muscle fibers, the submucosal layer, and the aging of intestinal villi increased significantly, indicating that copper and mercury have damaged the intestinal tract of mice.
4.1 Copper effects on intestinal microbial community
In our study, compared with RCK, Treponema, Coprococcus, and Dehalobacterium, the total number of dehalogenation bacteria in the colon of RCU patients increased significantly. Micrococcus is a pathogenic bacterium that can cause diarrhea. Sueyoshi and Adachi (1990) also found that gastrointestinal damage promotes the production of Micrococcus according to the synergistic effect between gastrointestinal mucosal digestion and absorption injury, metabolic improvement, and growing immature squamous epithelial cells. Dehalogenation bacteria are Gram-positive bacteria with negative bacteria. Gram-positive and negative bacteria have a unique intake system for inorganic copper on periplasmic protein (Trueba Santiso et al., 2017). The resistance of inorganic copper is located on transposons, plasmids, and bacterial sex chromosomes and is encoded by the gene of mer operon. However, the protein MERP can transfer harmful positive ions to the mercury transporter Mert and transport it to the nucleus to avoid the toxic effect of Gram-positive bacteria (Biondi et al., 2016). It documented that the harm of copper environmental pollution to the growth and development of Gram-negative bacteria is lower than that of Gram-positive bacteria (Khalid et al., 2021). This is consistent with other researcher's results; that is, the evolution rate of Gram-negative bacteria will be relatively increased, while the evolution rate of Gram-positive bacteria will be reduced (Vincent et al., 2018). Coprococcus is the key cause of bacterial infection, but its pathogenesis is unclear.
In contrast, bacillus, worldwide bacteria, Gram-negative bacteria, Staphylococcus aureus, and ignatzschineria decreased significantly. Some reports indicate that Bacillus microbial strains are part of traditional Chinese medicine preparations of compound probiotics, such as Bacillus subtilis and Bacillus licheniformis. With the abundance of iodine ions, galactosidase activity is inhibited, and the concentration of Bacillus subtilis decreases, which may be a key reason for the decrease of Bacillus subtilis. β-Galactosidase can catalyze the reaction of PG (nitrobenzene-β-D-galactopyranoside) reaction that hydrolyzes galactose and nitrophenol (ONP) Streptococcus can cause.
In the absence of inducers, Bacillus subtilis (Warmerdam et al., 2013). It immediately brought opportunities for the growth of bacteria. In the phylogenetic tree analysis of previous scientific research, there are some similar characteristics between Jeotgalicocus and Salinicoccus (Papadioti et al., 2017). These two bacteria are regarded as potentially beneficial for humans, producers, and operators. They may be one of the main functional groups of intestinal microbiota and play a leading role in human health (Zhang et al., 2015). In addition, it is reported that diffuse copper exposure can affect the composition of immunity-related fish intestinal microbiota (Babcock et al., 2014). Therefore, reducing these bacteria may also endanger the main role of all normal microbial populations in the colon, endanger colon metabolism, and cause digestive and absorption nerve dysfunction. Staphylococcus aureus is a Gram-positive bacterium belonging to the Staphylococcaceae family (Jin et al., 2020; Bierowiec, 2020). Though Staphylococcus aureus is mostly copper-resistant due to metal homeostasis and resistance systems (Al-Tameemi et al., 2021), very few reports indicate that Gram-positive bacilli are likely to be endangered in the condition of copper environmental pollution.
4.2 Mercury effects on intestinal microbial community
The Butyricimonas, Streptococcus, Dehalobacterium, Coprococcus, Oscillospira, and Helicobacter in RHg significantly exceeded RCK, but the Corynebacterium, Bacillus, Jeotgalicoccus, Salinicoccus, Staphylococcus, Lactococcus and Ignatzschineria was just the opposite. The way bacteria resist heavy metals is different; Cu2 + is likely to accumulate according to Cora-Mg2 + transporter. In addition, Cu2 + accumulates according to P-type ATPase in the case of copper starvation (Lunin et al., 2006). The drug resistance system similar to Pseudomonas cop system software is still unclear, but in Gram-positive bacteria, P-type ATPase seems to detoxify copper according to emissions. Pseudomonas copper resistant system software usually numbers four proteins, which fuse copper in the periplasm or near the outer membrane. Hg2 is converted into metallic mercury, spreading from somatic cells and ring mirrors. Copper and positive mercury ions are important inflammatory factors.
The reduction of excessive heavy metal–oxygen ions will cause the formation of oxygen free radicals. In addition, both copper and mercury decrease the body's content and activity of superoxide dismutase (SOD) (Liu et al., 2019). These all lead to a reduction in oxygen. So, we can see the increase of anaerobes, and the decrease of aerobic and facultative anaerobic in our results, such as the increase of Treponema, Dehalobacteriaceae, Oscillospira, Helicobacter, Streptococcus, Coprococcus, and Dehalobacteriaceae, while the decrease of Bacillus, Staphylococcus, Salinicoccus, Ignatzschaineria, and Corynebacterium. Moreover, some studies found that both copper and mercury can cause liver and kidney damage by lipid peroxidation and immune injury, thus leading to low immunity (Aksu et al., 2017; Jurczuk et al., 2004). At the same time, transforming the human immune system on the surface of the mucous membrane is fundamental, especially the gene mutation of microbial population, which may increase the number of pathogenic bacteria, such as Treponema and Butyricimonas, and Helicobacter. It can also indirectly lead to decreased beneficial and harmless bacteria because of the interaction between bacteria groups, such as Bacillus, Staphylococcus, and Corynebacterium.
Some of the pesticides are copper based (Tegenaw et al., 2019) and usually lead to the development of reactive oxygen species and free radicals (Kiaune and Singhasemanon, 2011); in return, there is oxidative stress (Arnal et al., 2011). It has been documented that those pesticides and their metabolites showed oxidative stress damage by inhibiting CAT and SOD and increasing malondialdehyde (Wei et al., 2021). Catalase is an important antioxidant enzyme that protects from oxidative stress and catalyzes hydrogen peroxide into water and oxygen, consequently completing the detoxification process emulated by superoxide dismutase (Li et al., 2022).
At the same time, some scientific researchers have found that excessive positive ions of heavy metals produce side effects that are too dangerous for all physiological parameters, including nitric oxide synthase (Gu et al., 2018; Chi et al., 2020). Even nutrient elements with a good reputation, such as Zn2+, especially Cu2+, are harmful at higher concentrations. The change of pH value greatly harms the growth and development of bacteria. In this study, we found that the pH value of mice in the copper group was lower. These two aspects may also be the primary reason for the transformation of beneficial bacteria.
4.3 The effects of copper and mercury on the intestinal microbial community
Interestingly, we found commonalities similar to the RCu and RHg groups at the phylum, but some differences are. Copper is a sword with two edges, not only toxic but also nutritious. There could be other reasons for increased Coprococcus, the only beneficial bacteria in the RCu group. But mercury is the heavy metal with the strongest toxicity, so the bacteria change is larger than that of copper, no matter which way it is. In addition, gram-negative bacteria are more resistant to metals than gram-positive bacteria (Safari and Younessi, 2017). Thus, most of the mutant bacteria in our results were gram-positive bacteria. Lactococcus had copper resistance but no resistance to mercury, so there was a change in the RHg group but no in the RCu group. Bacillus is mostly soil organisms, some of which are used to produce antibiotic substances and are not normal components of the local microflora, and their variation is reasonable. OscilloSpira is related to body weight and was found to increase in the intestines of fasted animals. In our results, the weight of the RHg group was lower than that of other groups. In addition, we also observed the transformation of other genera, including Butyricimonas. However, this genus is rarely reported to be related to copper and mercury poisoning in animal models.
5 Conclusion
Overall, it is seen that high intakes of copper and mercury are likely to reduce the body weight of mice. In addition, it also causes significant intestinal pathophysiological damage. The histopathological lesions comprised of increased thickness of inner and outer musculature, enlargement of the submucosa, and decreased number of goblet cells. There was slight to mild and moderate atrophy of intestinal somatic cells, stunting and fusion of intestinal villi, and severe deterioration of the middle mastoidal. Moreover, the length of the glands was significantly lower in the treatment groups than in the control group. In addition, higher concentrations of copper and mercury changed the diversity of the microbial population in the whole process of female mouse attack, which may be the theoretical basis for describing the poisoning system.
Authors contribution
Ping Liu, and Sufang Cheng: conceived and designed the experiment. Pei Liu, Xiaoquan Guo, Guoliang Hu, Xiaolu Hou, Lin Li, Cong Wu, and Zheng Xu: carried out bacterial sample collection, bacterial DNA acquisition, PCR amplification, and high-throughput sequencing. Pei Liu, Guyue Li, and Fan Yang: analyzed data and wrote papers; Ping Liu and Ahrar Khan: critically adjusted the manuscript of essential professional knowledge information. All authors approved the final version.
7 Novelty statement
Normal rectum microbiota of various species has been studied extensively. Heavy metals such as copper and mercury usually lead to pathological, hemato-biochemical, and genotoxicity changes in humans and animals. However, scanty information about the effect of copper and mercury on microbiota in the rectum is available, and this study has elucidated this information.
Acknowledgment
This project was supported by the National Natural Science Foundation of China grant (No. 31492266, Beijing, P.R. China) awarded to Ping Liu, the Natural Science Foundation of Jiangxi Province grant (No. 20171ACB21026) awarded to Ping Liu, and the Technology R&D Program of Jiangxi Province grant (No. GJJ170243, No. GJJ191400, Nanchang, P.R. China) awarded to Sufang Cheng.
Declaration of Competing Interest
The authors declare that they have no known competing financial interests or personal relationships that could have appeared to influence the work reported in this paper.
References
- The effect of different repeated doses of cypermethrin on the behavioral and histological alterations in the brain of rabbits (Oryctolagus cuniculi) Int. J. Vet. Sci.. 2021;10(4):347-354.
- [CrossRef] [Google Scholar]
- Effect of pomegranate (Punica granatum L.) juice on kidney, liver, heart and testis histopathological changes, and the tissues lipid peroxidation and antioxidant status in lead acetate-treated rats. Cell. Mol. Biol. (France). 2017;63(10):33-42.
- [CrossRef] [Google Scholar]
- Staphylococcus aureus lacking a functional MntABC manganese import system has increased resistance to copper. Mol. Microbiol.. 2021;115(4):554-573.
- [CrossRef] [Google Scholar]
- Histological study on the effects of orlistat on left ventricular myocardium of high fat diet-fed adult male Wistar rats. Int. J. Vet. Sci.. 2022;11(4):544-547.
- [CrossRef] [Google Scholar]
- Clinical parameters and biomarkers of oxidative stress in agricultural workers who applied copper-based pesticides. Ecotoxicol. Environ. Saf.. 2011;74(6):1779-1786.
- [CrossRef] [Google Scholar]
- aldh7a1 regulates eye and limb development in zebrafish. PloS One.. 2014;9(7):e101782.
- [CrossRef] [Google Scholar]
- Isolation and genetic characterization of staphylococcus haemolyticus from cats. Pak. Vet. J.. 2020;40(3):375-379.
- [CrossRef] [Google Scholar]
- Laboratory evolution of artificially expanded DNA gives redesignable aptamers that target the toxic form of anthrax protective antigen. Nucleic Acids Res.. 2016;44(20):9565-9577.
- [CrossRef] [Google Scholar]
- A methodology to determine the maximum value of weighted Gini-Simpson index. Springerplus.. 2016;5:1143.
- [CrossRef] [Google Scholar]
- Impact Assessment of heavy metal cations to the characteristics of photosynthetic phycocyanin. J. Hazard. Mater.. 2020;391:122225
- [CrossRef] [Google Scholar]
- Heavy metal-induced co-selection of antibiotic resistance genes in the gut microbiota of collembolans. Sci. Total Environ.. 2019;683:210-215.
- [CrossRef] [Google Scholar]
- Metal-organic framework as an efficient filter for the removal of heavy metal cations in water. Phys. Chem. Chem. Phys.. 2018;20:30384-30391.
- [CrossRef] [Google Scholar]
- Raman spectroscopy of potential bio-hazards commonly found in bio-aerosols. Spectrochimica Acta Part A: Mol. Biomol. Spectro.. 2020;243:118753
- [CrossRef] [Google Scholar]
- Antioxidant enzymes activity and lipid peroxidation in liver and kidney of rats exposed to cadmium and ethanol. Food Chem. Toxicol.. 2004;42:429-438.
- [CrossRef] [Google Scholar]
- Synergistic effects of Cu-doped ZnO nanoantibiotic against Gram-positive bacterial strains. PloS One.. 2021;16(5):e0251082.
- [Google Scholar]
- Pesticidal copper (I) oxide: environmental fate and aquatic toxicity. Rev. Environ. Contam. Toxicol.. 2011;213:1-26.
- [CrossRef] [Google Scholar]
- Effects of metal ions on the activity of protein tyrosine phosphatase VHR: highly potent and reversible oxidative inactivation by Cu2+ ion. Arch. Biochem. Biophys.. 2000;382:72-80.
- [CrossRef] [Google Scholar]
- Gut microbiota-generated metabolites in animal health and disease. Nat. Chem. Biol.. 2014;10:416-424.
- [CrossRef] [Google Scholar]
- Heavy metal exposure causes changes in the metabolic health-associated gut microbiome and metabolites. Environ. Int.. 2019;126:454-467.
- [CrossRef] [Google Scholar]
- Evaluation of DNA damage, biomarkers of oxidative stress and status of antioxidant enzymes in freshwater fish (Labeo rohita) exposed to pyriproxyfen. Oxid. Med. Cell. Longev. 2022 (Article ID 5859266)
- [CrossRef] [Google Scholar]
- USP36 protects proximal tubule cells from ischemic injury by stabilizing c-Myc and SOD2. Biochem. Biophys. Res. Commun.. 2019;513:502-508.
- [CrossRef] [Google Scholar]
- Crystal structure of the CorA Mg2+ transporter. Nature.. 2006;440(7085):833-837.
- [CrossRef] [Google Scholar]
- 'Jeotgalicoccus saudimassiliensis' sp. nov., a new bacterial species isolated from air samples in the urban environment of Makkah, Saudi Arabia. New Microbes. New Infect.. 2017;15:128-130.
- [CrossRef] [Google Scholar]
- High doses of copper and mercury changed cecal microbiota in female mice. Biol. Trace Elem. Res.. 2019;189:134-144.
- [CrossRef] [Google Scholar]
- Antibiotic resistance of bacteria isolated from heavy metal-polluted soils with different land uses. J. Glob. Antimicrob. Resist.. 2017;10:247-255.
- [CrossRef] [Google Scholar]
- Dietary copper-fructose interactions alter gut microbial activity in male rats. Am. J. Physiol. Gastrintest. Liver Physiol.. 2018;314:G119-G130.
- [CrossRef] [Google Scholar]
- Diarrhea induced by Treponema hyodysenteriae: a young chick cecal model for swine dysentery. Infect. Immun.. 1990;58:3348-3362.
- [CrossRef] [Google Scholar]
- Characterization of colloid-size copper-based pesticide and its potential ecological implications. Environ. Pollut.. 2019;253:278-287.
- [CrossRef] [Google Scholar]
- Molecular and carbon isotopic characterization of an anaerobic stable enrichment culture containing Dehalobacterium sp. during dichloromethane fermentation. Sci. Total Environ.. 2017;581–582:640-648.
- [CrossRef] [Google Scholar]
- Copper, oxidative stress, and human health. Mol. Aspects Med.. 2005;26:268-298.
- [CrossRef] [Google Scholar]
- Contact killing and antimicrobial properties of copper. J. Appl. Microbiol.. 2018;124(5):1032-1046.
- [CrossRef] [Google Scholar]
- Toxicity of mineral Chinese medicines containing mercury element. Zhongguo Zhong Yao Za Zhi (China J. Chinese Mat. Med.). 2017;42:1258-1264.
- [CrossRef] [Google Scholar]
- Effects of carbohydrates on the oNPG converting activity of β-galactosidases. J. Agric. Food Chem.. 2013;61:6458-6464.
- [CrossRef] [Google Scholar]
- Toxicity and fate of chiral insecticide pyriproxyfen and its metabolites in zebrafish (Danio rerio) Environ. Pollut.. 2021;280:116894
- [CrossRef] [Google Scholar]
- Effects of heavy metals on the bioaccumulation, excretion and gut microbiome of black soldier fly larvae (Hermetia illucens) Ecotoxicol. Environ. Saf.. 2020;192:110323
- [CrossRef] [Google Scholar]
- An approach to detecting species diversity of microfaunas in colonization surveys for marine bioassessment based on rarefaction curves. Mar. Pollut. Bull.. 2014;88:268-274.
- [CrossRef] [Google Scholar]
- A phylo-functional core of gut microbiota in healthy young Chinese cohorts across lifestyles, geography and ethnicities. ISME J.. 2015;9:1979-1990.
- [CrossRef] [Google Scholar]
- Heavy metal in paddy soil and its bioavailability in rice using in vitro digestion model for health risk assessment. Int. J. Environ. Res. Public Health.. 2019;16:4769.
- [CrossRef] [Google Scholar]
Appendix A
Supplementary material
Supplementary data to this article can be found online at https://doi.org/10.1016/j.jksus.2023.102776.
Appendix A
Supplementary material
The following are the Supplementary data to this article:


