Translate this page into:
Contribution to the hydrogeology of the Lower Cretaceous aquifer in east Central Sinai, Egypt
*Address: Al-Quwiayiyh Community College, Shaqra University, Saudi Arabia. Tel.: +966 504364882 saadyounes@marktoob.com (Saad Y. Ghoubachi)
-
Received: ,
Accepted: ,
This article was originally published by Elsevier and was migrated to Scientific Scholar after the change of Publisher.
Available online 27 May 2010
Peer review under responsibility of King Saud University.
Abstract
The Lower Cretaceous aquifer (Malha sandstone aquifer) represents the main aquifer in east Central Sinai. The hydrogeological evaluation of the aquifer is based on the data of 14 selected deep wells. The objective of this paper aims to elucidate the hydrogeological characteristics of the Lower Cretaceous aquifer. The groundwater of Lower Cretaceous aquifer exists under confined conditions. The top surface of the Lower Cretaceous dips steeply towards the southwest direction. The average sand percent of the penetrated aquifer attains 54%. The groundwater flow direction of Lower Cretaceous aquifer is concentric to the center of study area related to the influence of the graben block. The general hydraulic gradient reaches 0.0011 in southwestern portion, while it reaches 0.0028 in central portion of study area. The average effective porosity and transmissivity and hydraulic conductivity of the Lower Cretaceous aquifer are 17.3%, 416 m2/day and 1.4 m/day, respectively. They increase towards the northeast direction with increasing of the sand percentage.
Durov diagram plot revealed that the groundwater has been a final stage evolution represented by an NaCl water type. The groundwater salinity increases towards the central portion of study area coinciding with groundwater flow. The groundwater salinity of the Lower Cretaceous aquifer is brackish water and varies from 2510 to 5256 ppm. It is unsuitable for drinking and domestic purposes.
Keywords
Hydrogeology
Lower Cretaceous aquifer
Groundwater
East Central Sinai
Egypt
1 Introduction
The Lower Cretaceous aquifer in Central Sinai represents the main aquifer. During the last few decades groundwater exploitation in the Sinai Peninsula has increased dramatically, mainly due to an increase in irrigated agriculture, tourism and industry. To meet the needs of drinking water for future generations, sustainable watershed management is essential for drinking water supply especially in semiarid areas, and requires a more detailed knowledge about the hydrogeology of the Lower Cretaceous aquifer. The Lower Cretaceous aquifer in the study area is considered to be the most important groundwater reservoir in this area providing large amounts of water for the development of this promising area. This paper describes the hydrogeology of Lower Cretaceous aquifer in east Central Sinai.
The study area lies in the east Central Sinai and extended to the eastern Egyptian border (Fig. 1). It is located between longitudes 34°00′E and 34°30′E and latitudes 30°15′N and 30°45′N.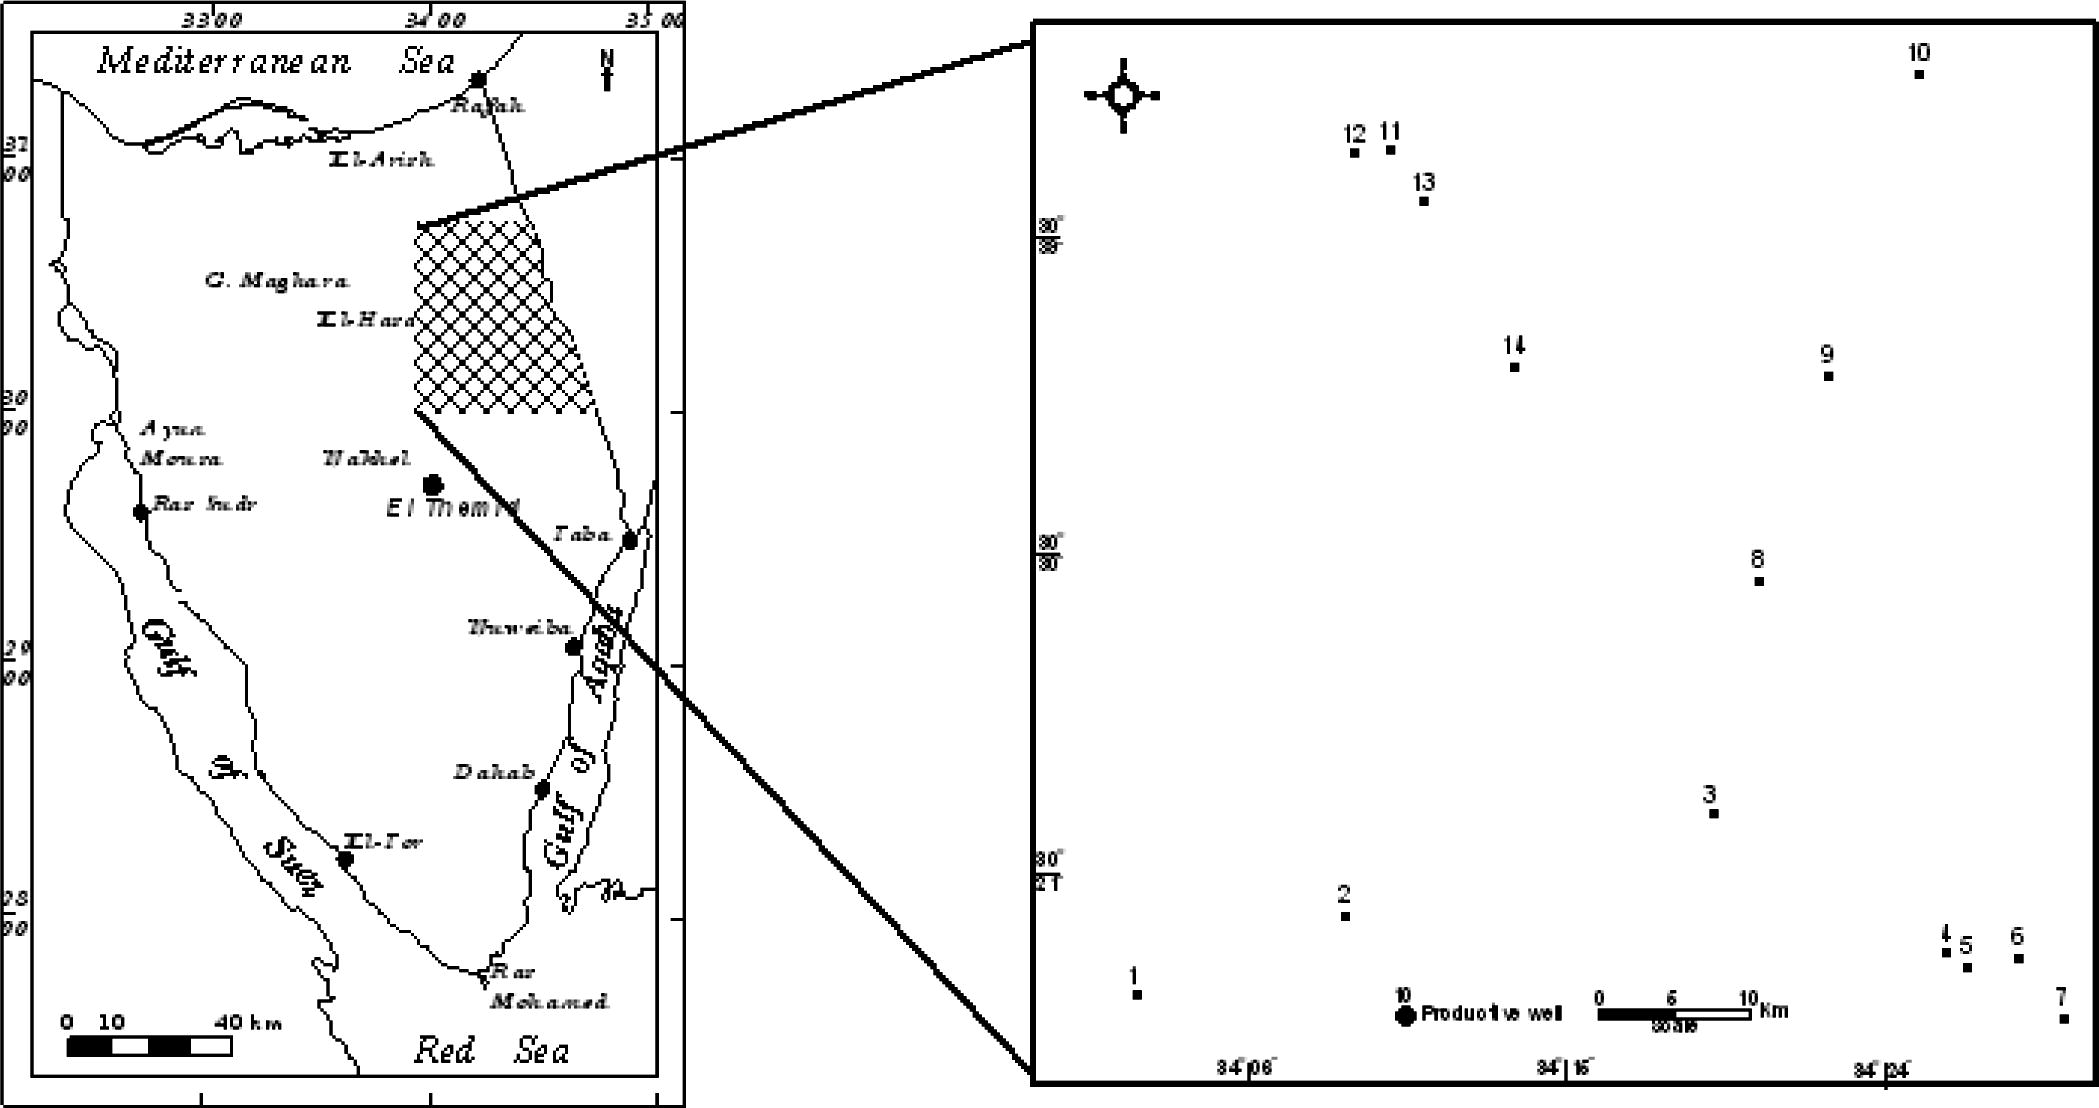
Location and well location map of study area.
This area lies in an arid transitional climatic zone between the influence of the Sahara and the Mediterranean systems of North Africa. The rainfall attains a relatively low precipitation ranges between 14 and 26 mm/year, however, the pluvial paleo-climate has its effect on the hydrologic regime of the area. The average temperature ranges between 8 and 15 °C in winter and between 21 and 27 °C in summer. The natural evaporation ranges between 6.5 and 15 mm/day in winter and summer, respectively (WRRI, 1995).
The present work aims to elucidate the hydrogeological characteristics of the Lower Cretaceous aquifer. This depends on the new hydrogeological and hydrologic data for 14-deep drilled wells as well as hydrochemical analyses of representative groundwater samples.
1.1 Geomorphological setting
Several geomorphological studies have been made for individual parts of the investigated area. The most important studies were made by Shata (1960), Said (1962), Hammad (1980), and Hassanin (1997). The surface of study is geomorphologically subdivided into distinct geomorphic units according to Hassanin (1997) as shown in Fig. 2.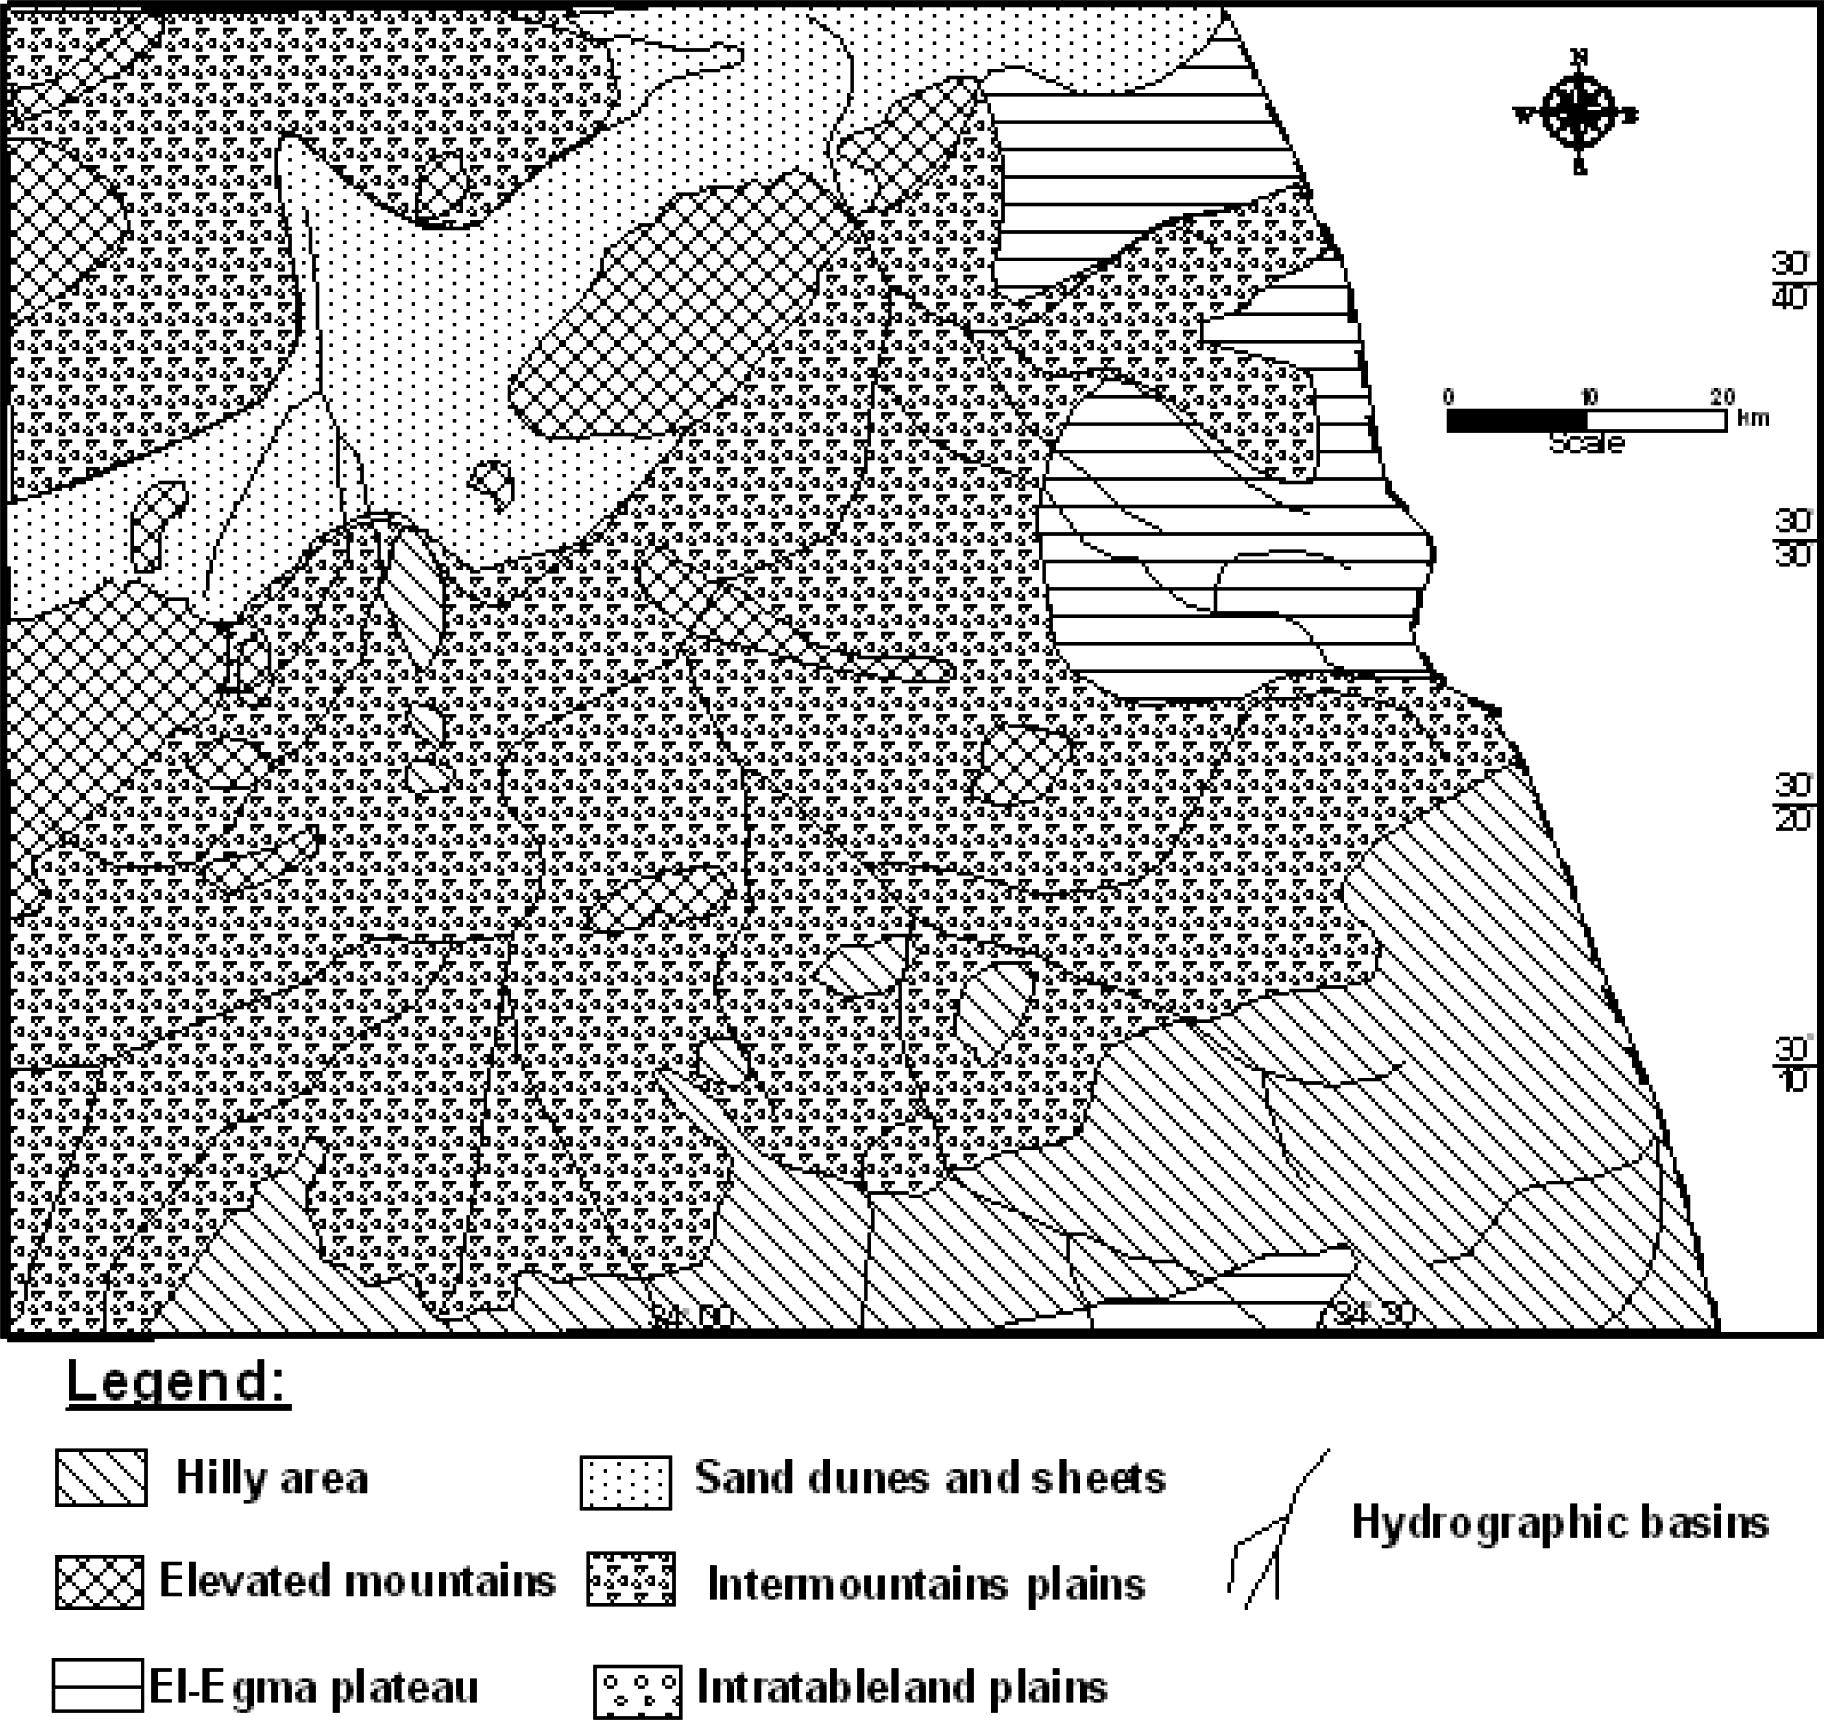
The main geomorphological units of study area (after Hassanin, 1997).
1.1.1 The watershed areas (highlands)
These units receive the rainwater and classified into the Egma plateau, hilly area and elevated mountain. El-Egma plateau represents the principal watershed area in the study area. This plateau is mainly composed of Lower Eocene chalky limestone with chart bands. Its surface is dissected by many consequent drainage lines that form the intake portion of Wadi El-Arish.
Hilly areas constitute very prominent land features represented by the folded blocks. These folded blocks are formed of elevated and isolated mountains arranged in several rows running in northeast southwest direction (Syrian Arc trend). Numerous wadis that are mostly developed along the fault lines excavate these mountains. Some of these wades have fair groundwater supplies and favorable soil potentialities.
An elevated mountain reveals wide variations in its size and composition depending upon the local structural setting and the weathering processes. The core of the elevated mountain exposes of Triassic formation (Gebel Arif El-Naqa) and Lower Cretaceous sandstone (Gebel El-Halal).
1.1.2 The water collectors areas
The water collectors are represented by the lowland areas (hydrographic system, intermountains plains and sand dunes and sheets). These lowland areas store and collect the surface water and recharge the groundwater.
2 Geological setting
The main surface geology is described in the geological map of Sinai at a scale 1:500,000, performed by (CONOCO, 1987) and is shown in Fig. 3. The study area is mostly covered by Quaternary deposits composed of alluvium and sand dunes deposits. The Lower Eocene Thebes Formation extensively covers El-Egma plateau, which it locally called Egma limestone. Paleocene deposits including Esna Shale Formation, which is composed of marly shale. The Upper Cretaceous is represented by Sudr Formation, which is composed of chalk of Maastrichtian age, Duwai Formation composed of alternated carbonate and clastic of Campanian age, Matullah Formation, which is composed of limestone of Conician–Santonian age, and Wata Formation, composed of dolomitic limestone of Conician–Turonian deposits. Halal Formation that belongs to Cenomanian age is composed of limestone (Fig. 4). Its stratigraphy and structures are strongly interrelated and have a great impact on the groundwater quality and potential.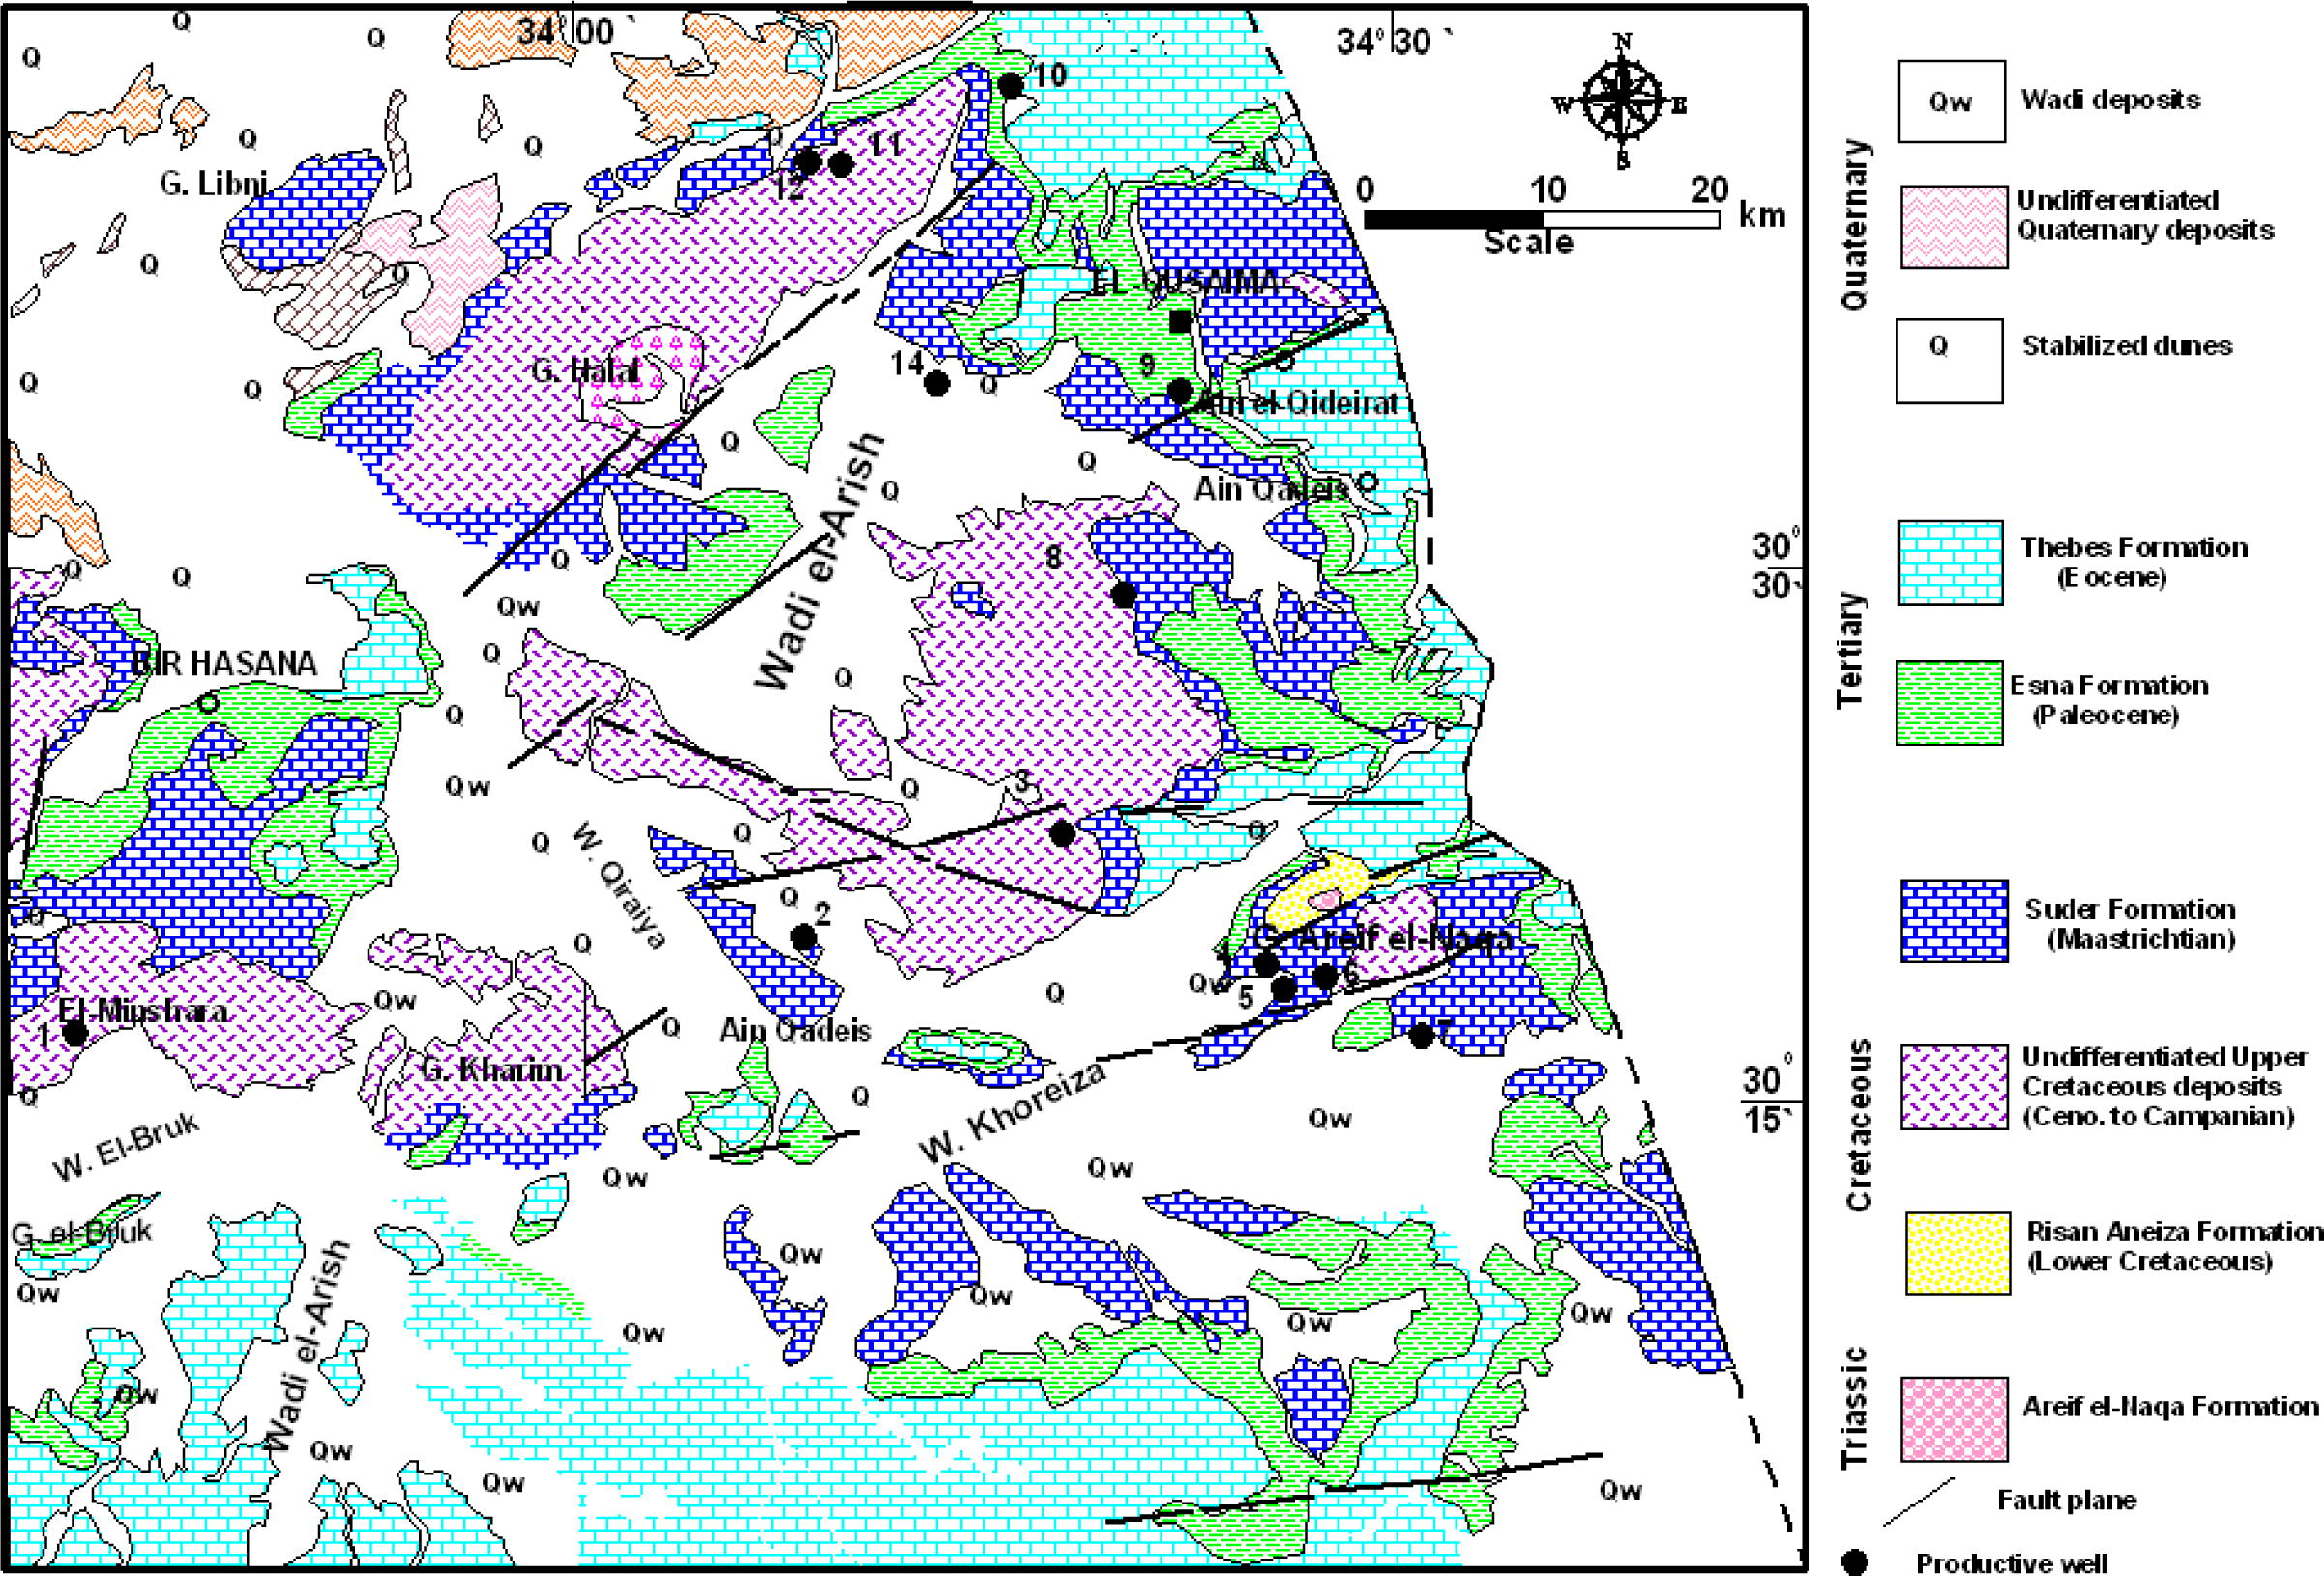
Geological map of the study area (modified after CONOCO, 1987).
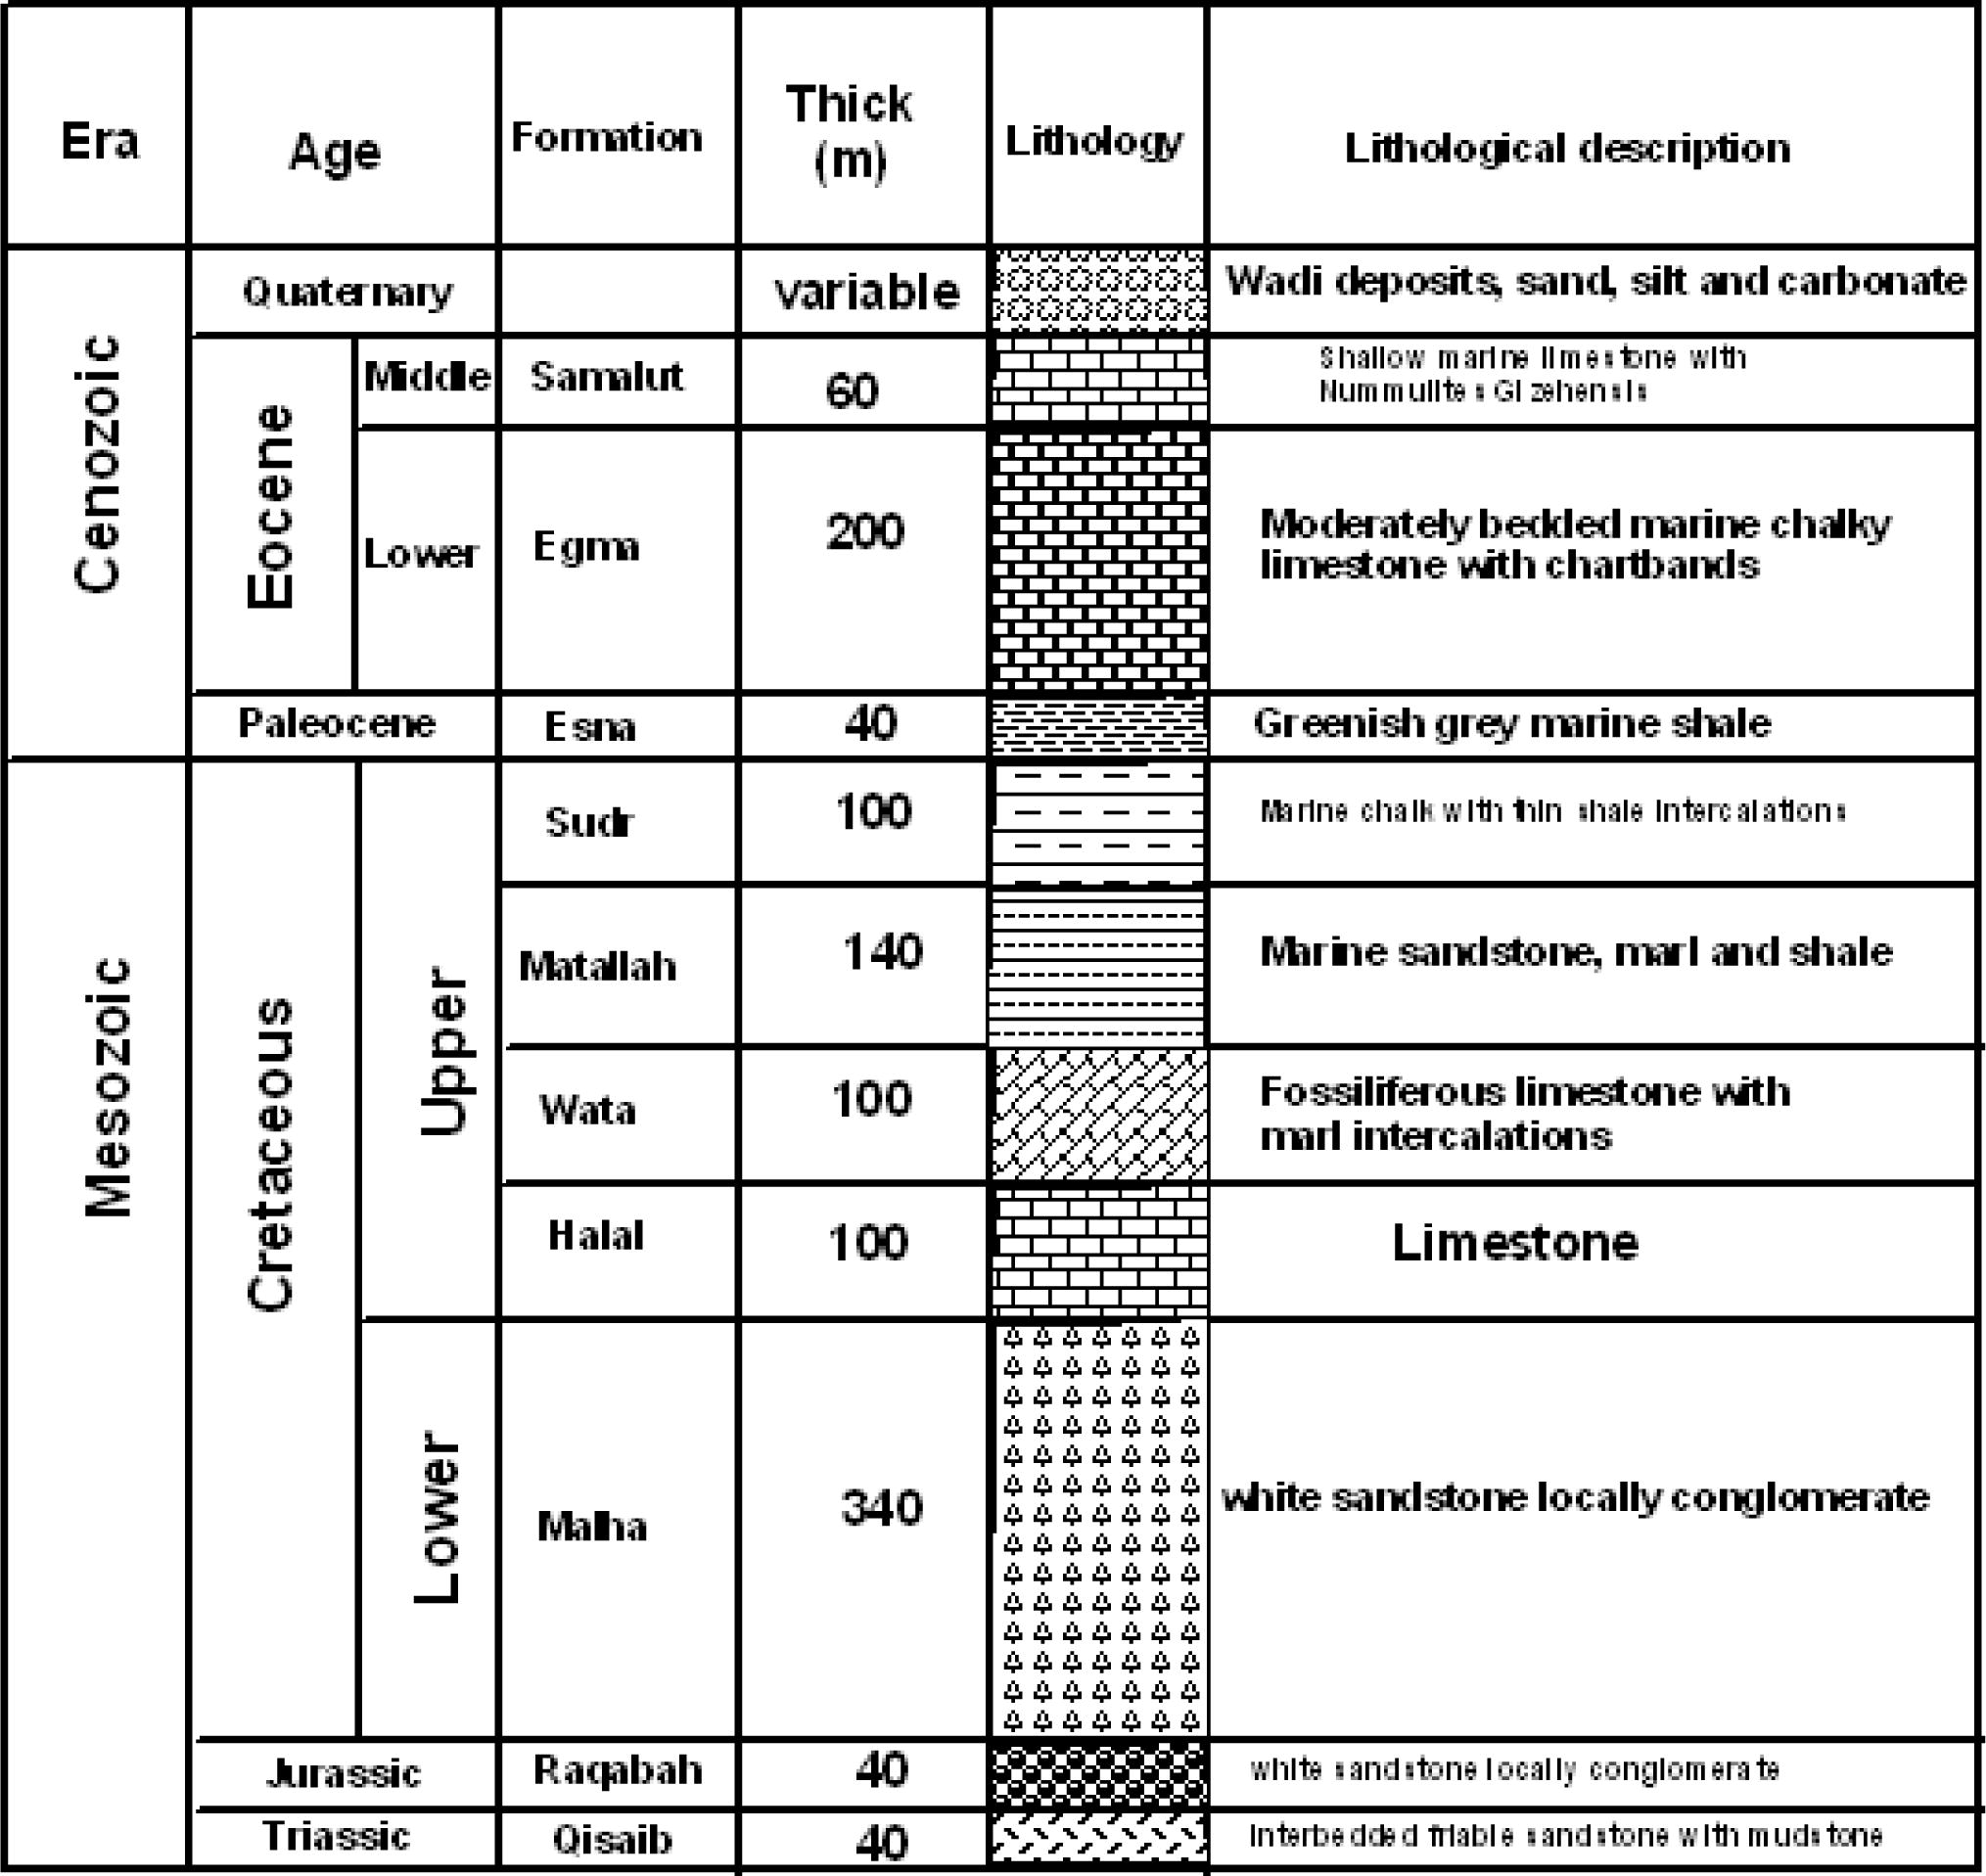
Stratigraphic succession in study area (modified after WRRI, 1995).
The geology of Central Sinai is delineated by different authors among them are: Shata (1956), Said (1962, 1990), El-Shazly et al. (1974), El-Ghazawi (1989), Hassanin (1997) and Ali (2006).
Lower Cretaceous is represented by Malha Formation, which is composed sandstone and clay succession that were formerly lumped under the Nubia sandstone. In other word, the sandstone succession of Lower Cretaceous Formation in the south gradually changes in facies into shaly and calcareous sequence in north which is locally called as Risan Aneiza Formation (Said, 1971). The Triassic sediments outcrop only in the core of Gebel Arief El-Naqa. Areif El-Naqa Formation is composed of sandstone with interbeds of variegated shale.
The structural pattern of east Central Sinai shows that folding is much more pronounced than faulting. The area of study displays the strongly folded province (Shata, 1956). This structure plays a great role to the influence on the hydrogeologic setting. This is reflected on the groundwater occurrence, replenishment, movement and potentialities. This belt is characterized by extensive anticline mountain arranged in parallel lines oriented in ENE–WSW direction separated by vast synclinal flat plains (Hassanin, 1997). Faulting is common and has a pronounced influence on the local topographic and groundwater flow.
A panel diagram (Fig. 5) is constructed for the subsurface of Lower Cretaceous Formation (Nubia Formation) and post-Nubia Formations in the study area. This diagram shows that the thickness of post-Nubia Formations increases towards the southwest direction, while the thickness of Lower Cretaceous Formation decreases in the same direction.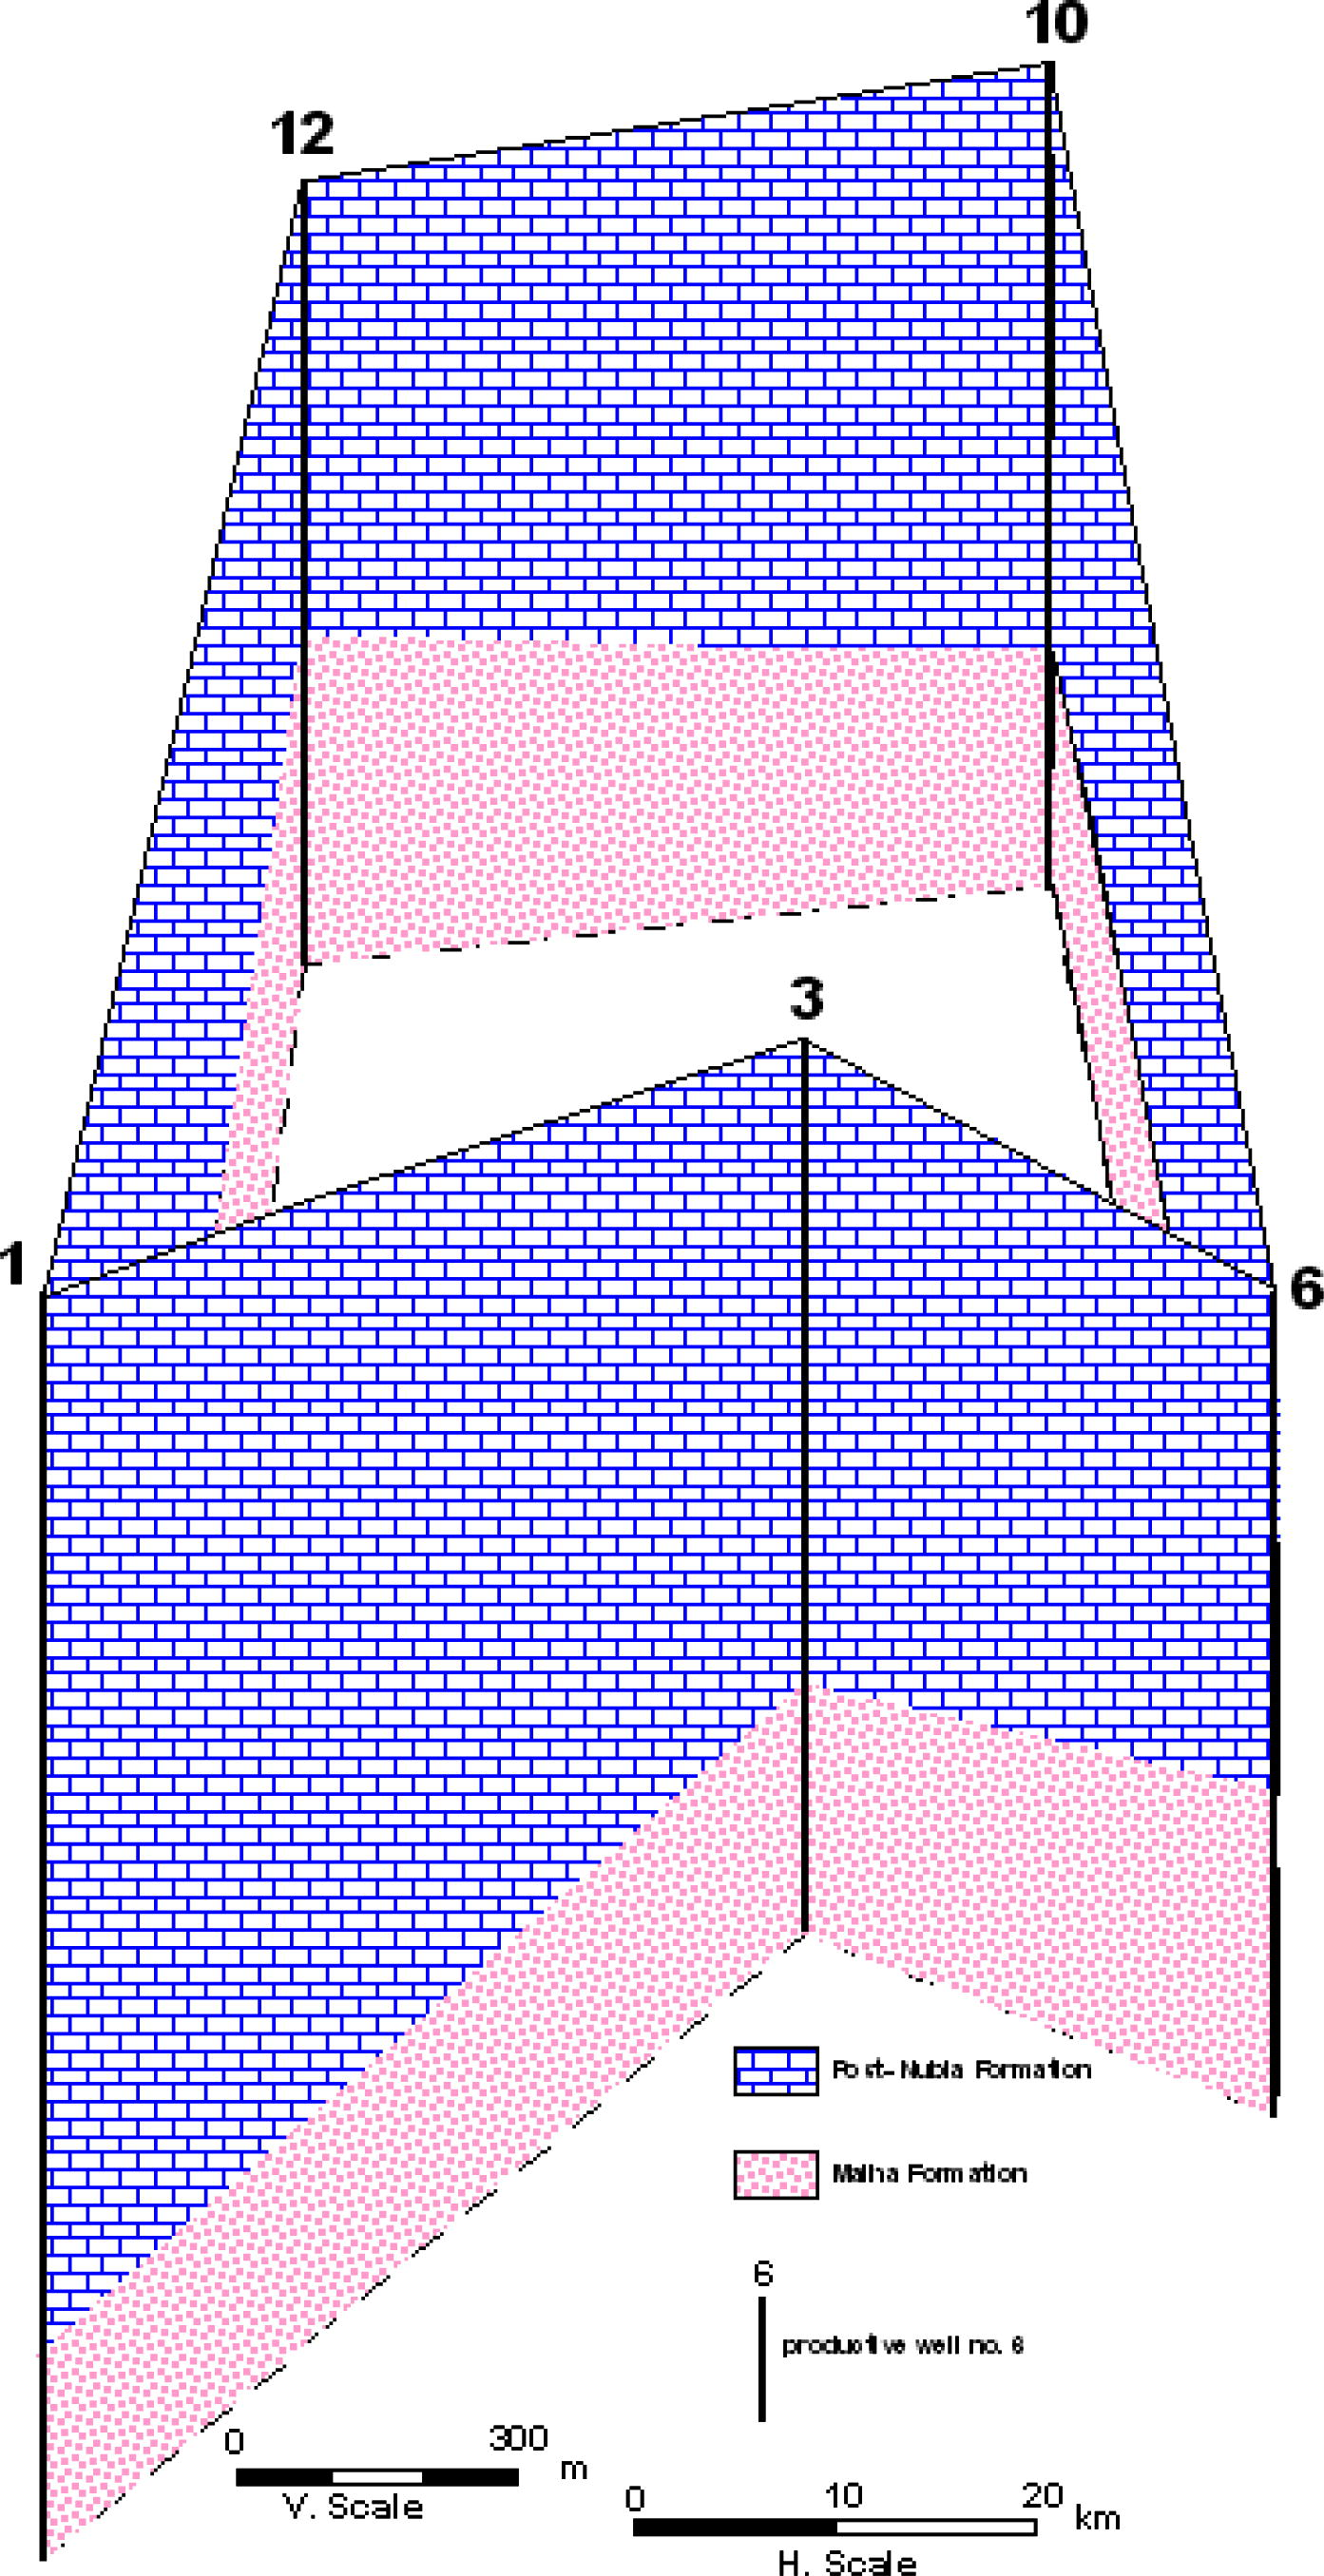
Panel diagram showing subsurface in east Central Sinai.
3 Hydrogeological setting
Lower Cretaceous aquifer in the study area is represented by Malha sandstone aquifer. It is considered as the main aquifer in the investigated area. Accordingly, the evaluation of this aquifer in the study area is very important for the development of this area.
Lower Cretaceous aquifer is directly rested on the Jurassic sandstone aquifer (Ali, 2006). The Jurassic aquifer is characterized by high groundwater salinity. The concerned aquifer is mainly composed of vari-colored, medium to coarse-grained sandstone with dark, sticky claystone interbeds. It was deposited under continental fluviatile environment.
The penetrated thickness of the investigated aquifer ranges from 140 m (well no. 9) to 327 m (well no. 4). The sand percentage of the penetrated thickness of this aquifer varies from 42% (well no. 5) to 66% (well no. 3) and its average reaches 54%. Generally, this sand percentage of this aquifer increases towards the east direction (Fig. 6). The total depth of the drilled wells ranges from 842 m in well no. 9 to 1375 m in well no. 1 (Table 1). The top surface of Lower Cretaceous aquifer is recorded at depths ranging between −875 m under sea level at well no. 1 and −15 m at well no. 4 (Table 1). The top surface of the Lower Cretaceous dips steeply towards the southwest direction (Fig. 7).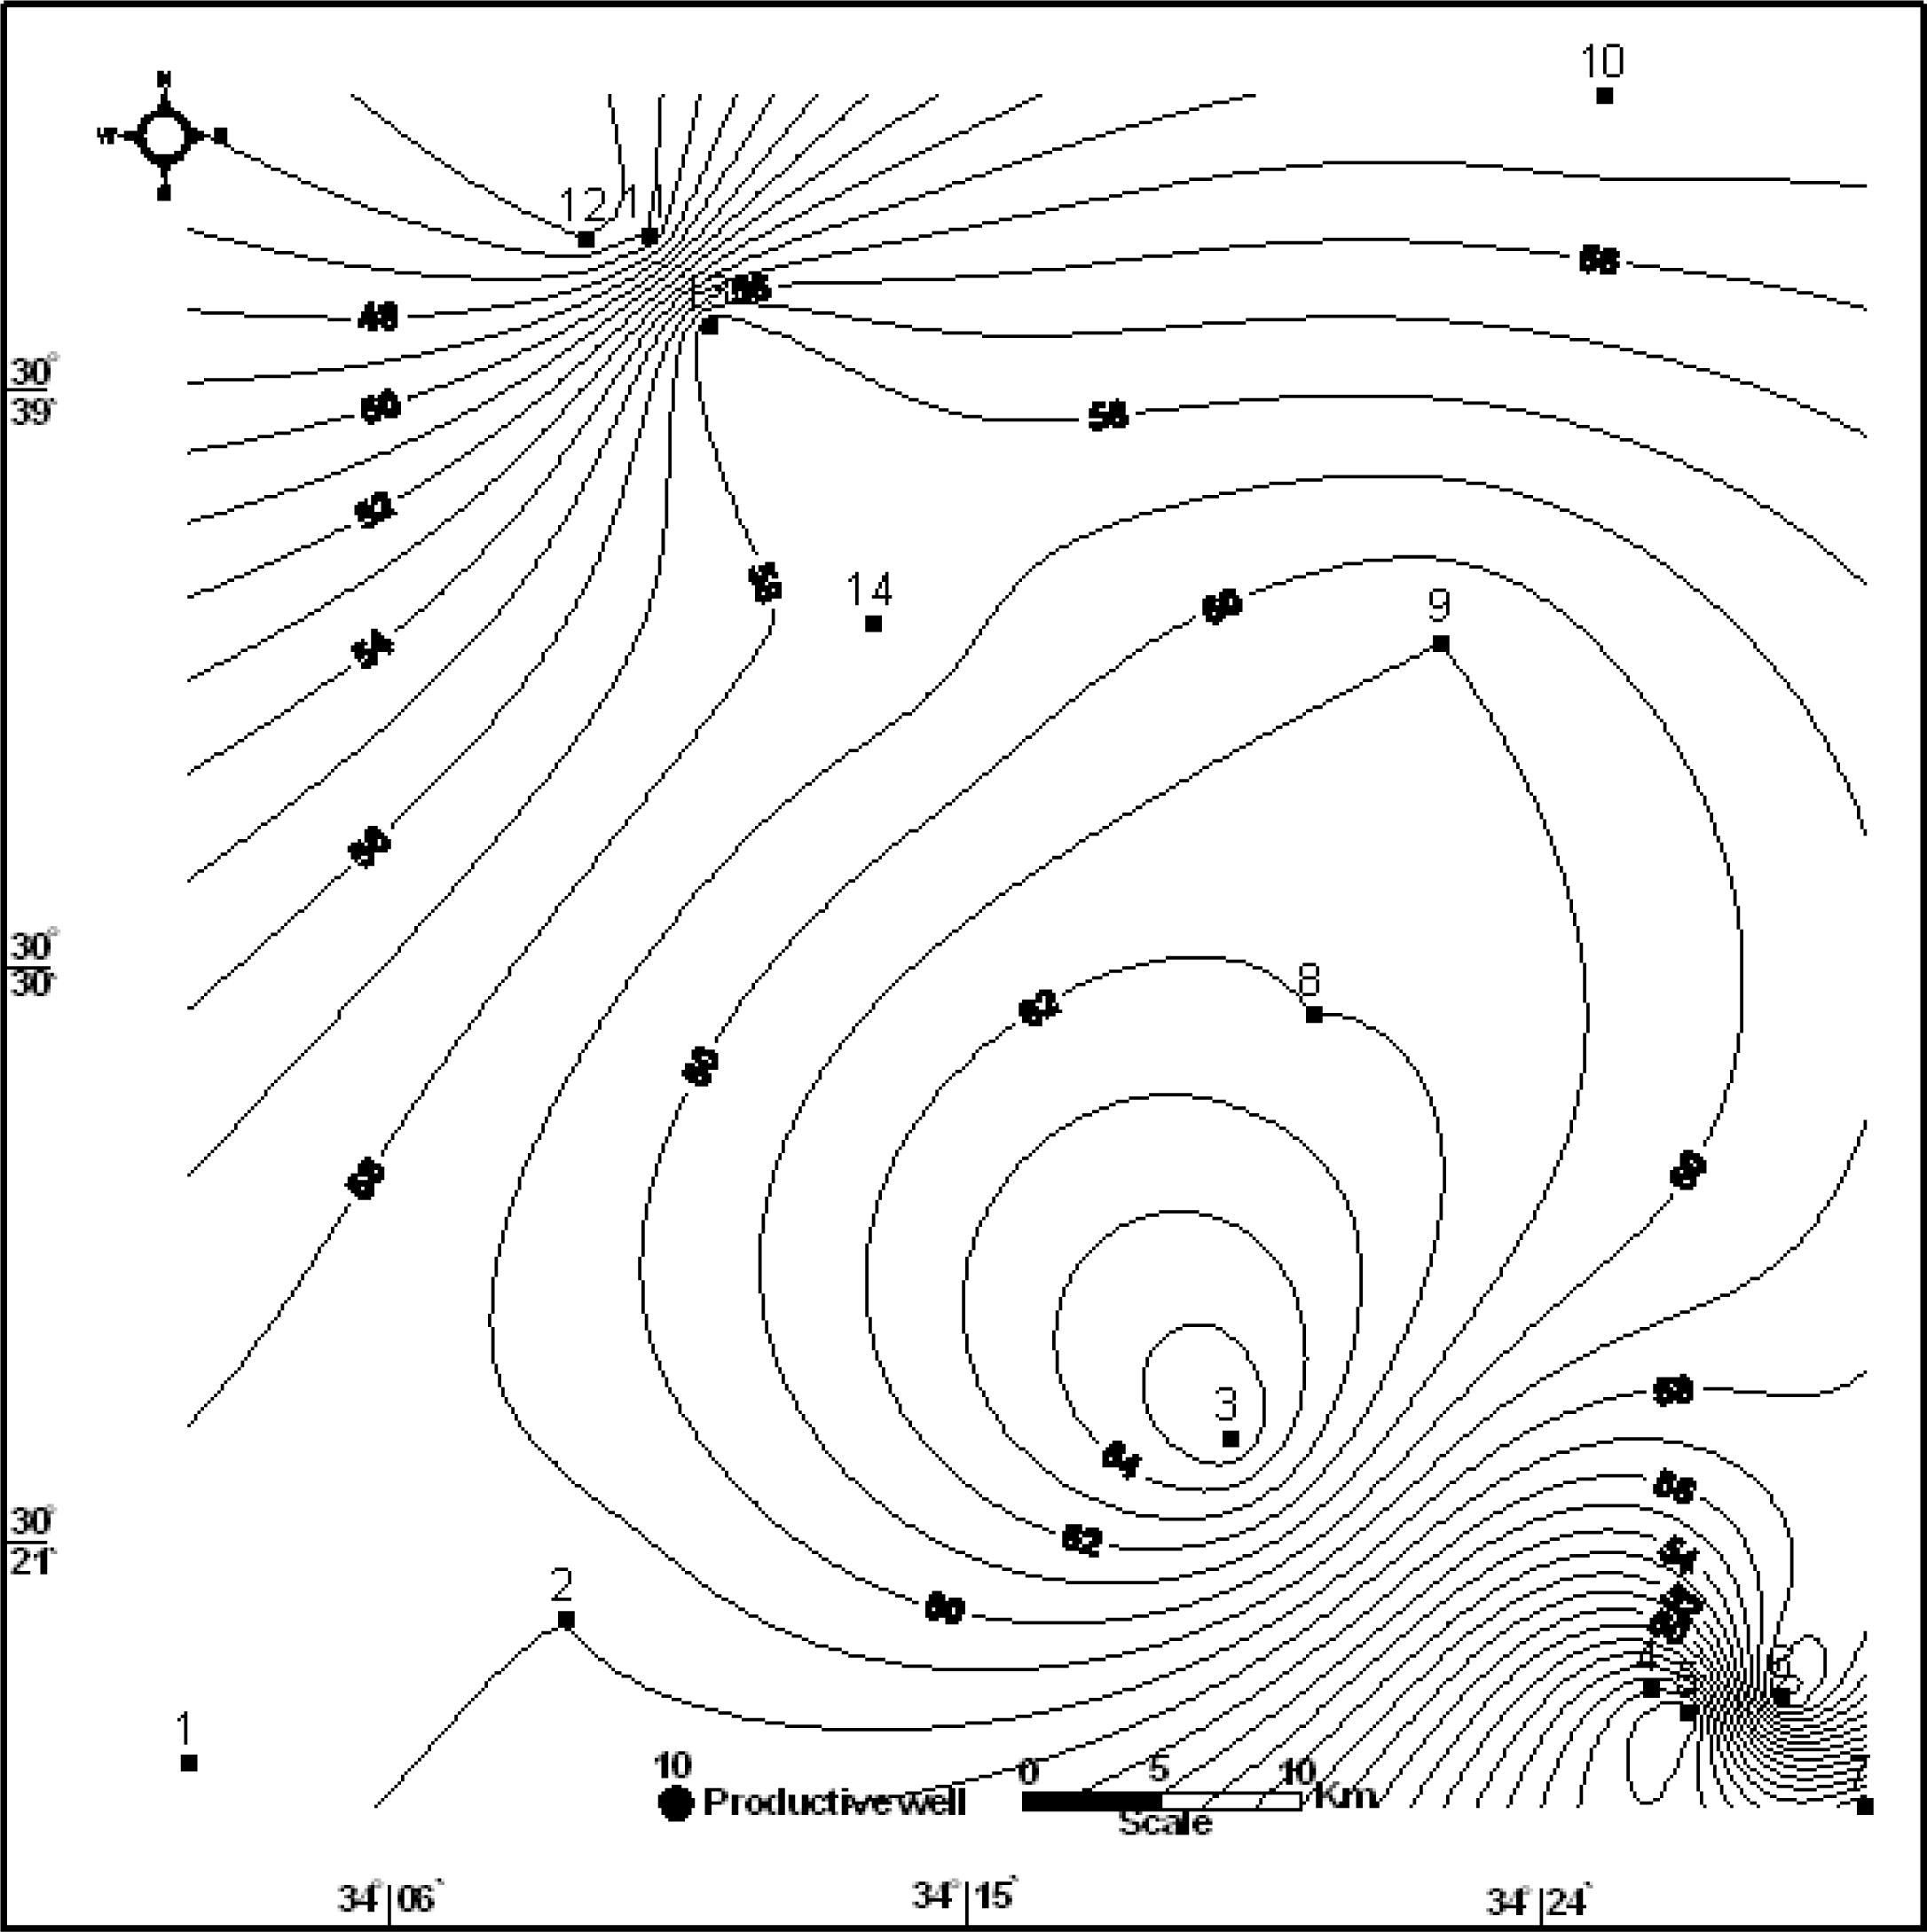
Sand percent contour map of the Lower Cretaceous.
Well No.
Well name
Total depth (m)
Water level (masl)
Screen interval (m)
Thickness (m)
Sand (%)
Top surface Lower Cretaceous aquifer (masl)
Salinity (ppm)
From
To
1
Khream
1375
174
1130
1375
245
59
−875
5283
2
El-Batohy
1032
165
820
1032
212
58
−503
2794
3
El-Biraq
973
700
970
270
66
−265
3828
4
Arif El-Naqa1
877
550
877
327
44
−15
2809
5
Arif El-Naqa2
870
550
870
320
42
−25
6
Khareza
902
155
650
902
252
60
−101
7
Arif El-Naqa19a
900
154
600
900
300
45
−101
8
Grur
860
150
660
860
200
62
−190
3653
9
Gaifi
842
140
690
830
140
60
−150
5285
10
Sabha
900
151
700
900
200
54
−192
2510
11
Halal 1
850
163
550
850
300
46
−187
12
Halal 2
850
550
850
300
45
−150
2880
13
Monbateh
1004
750
1004
254
59
−464
14
Hodaybia
850
115
620
850
222
58
−210
4697
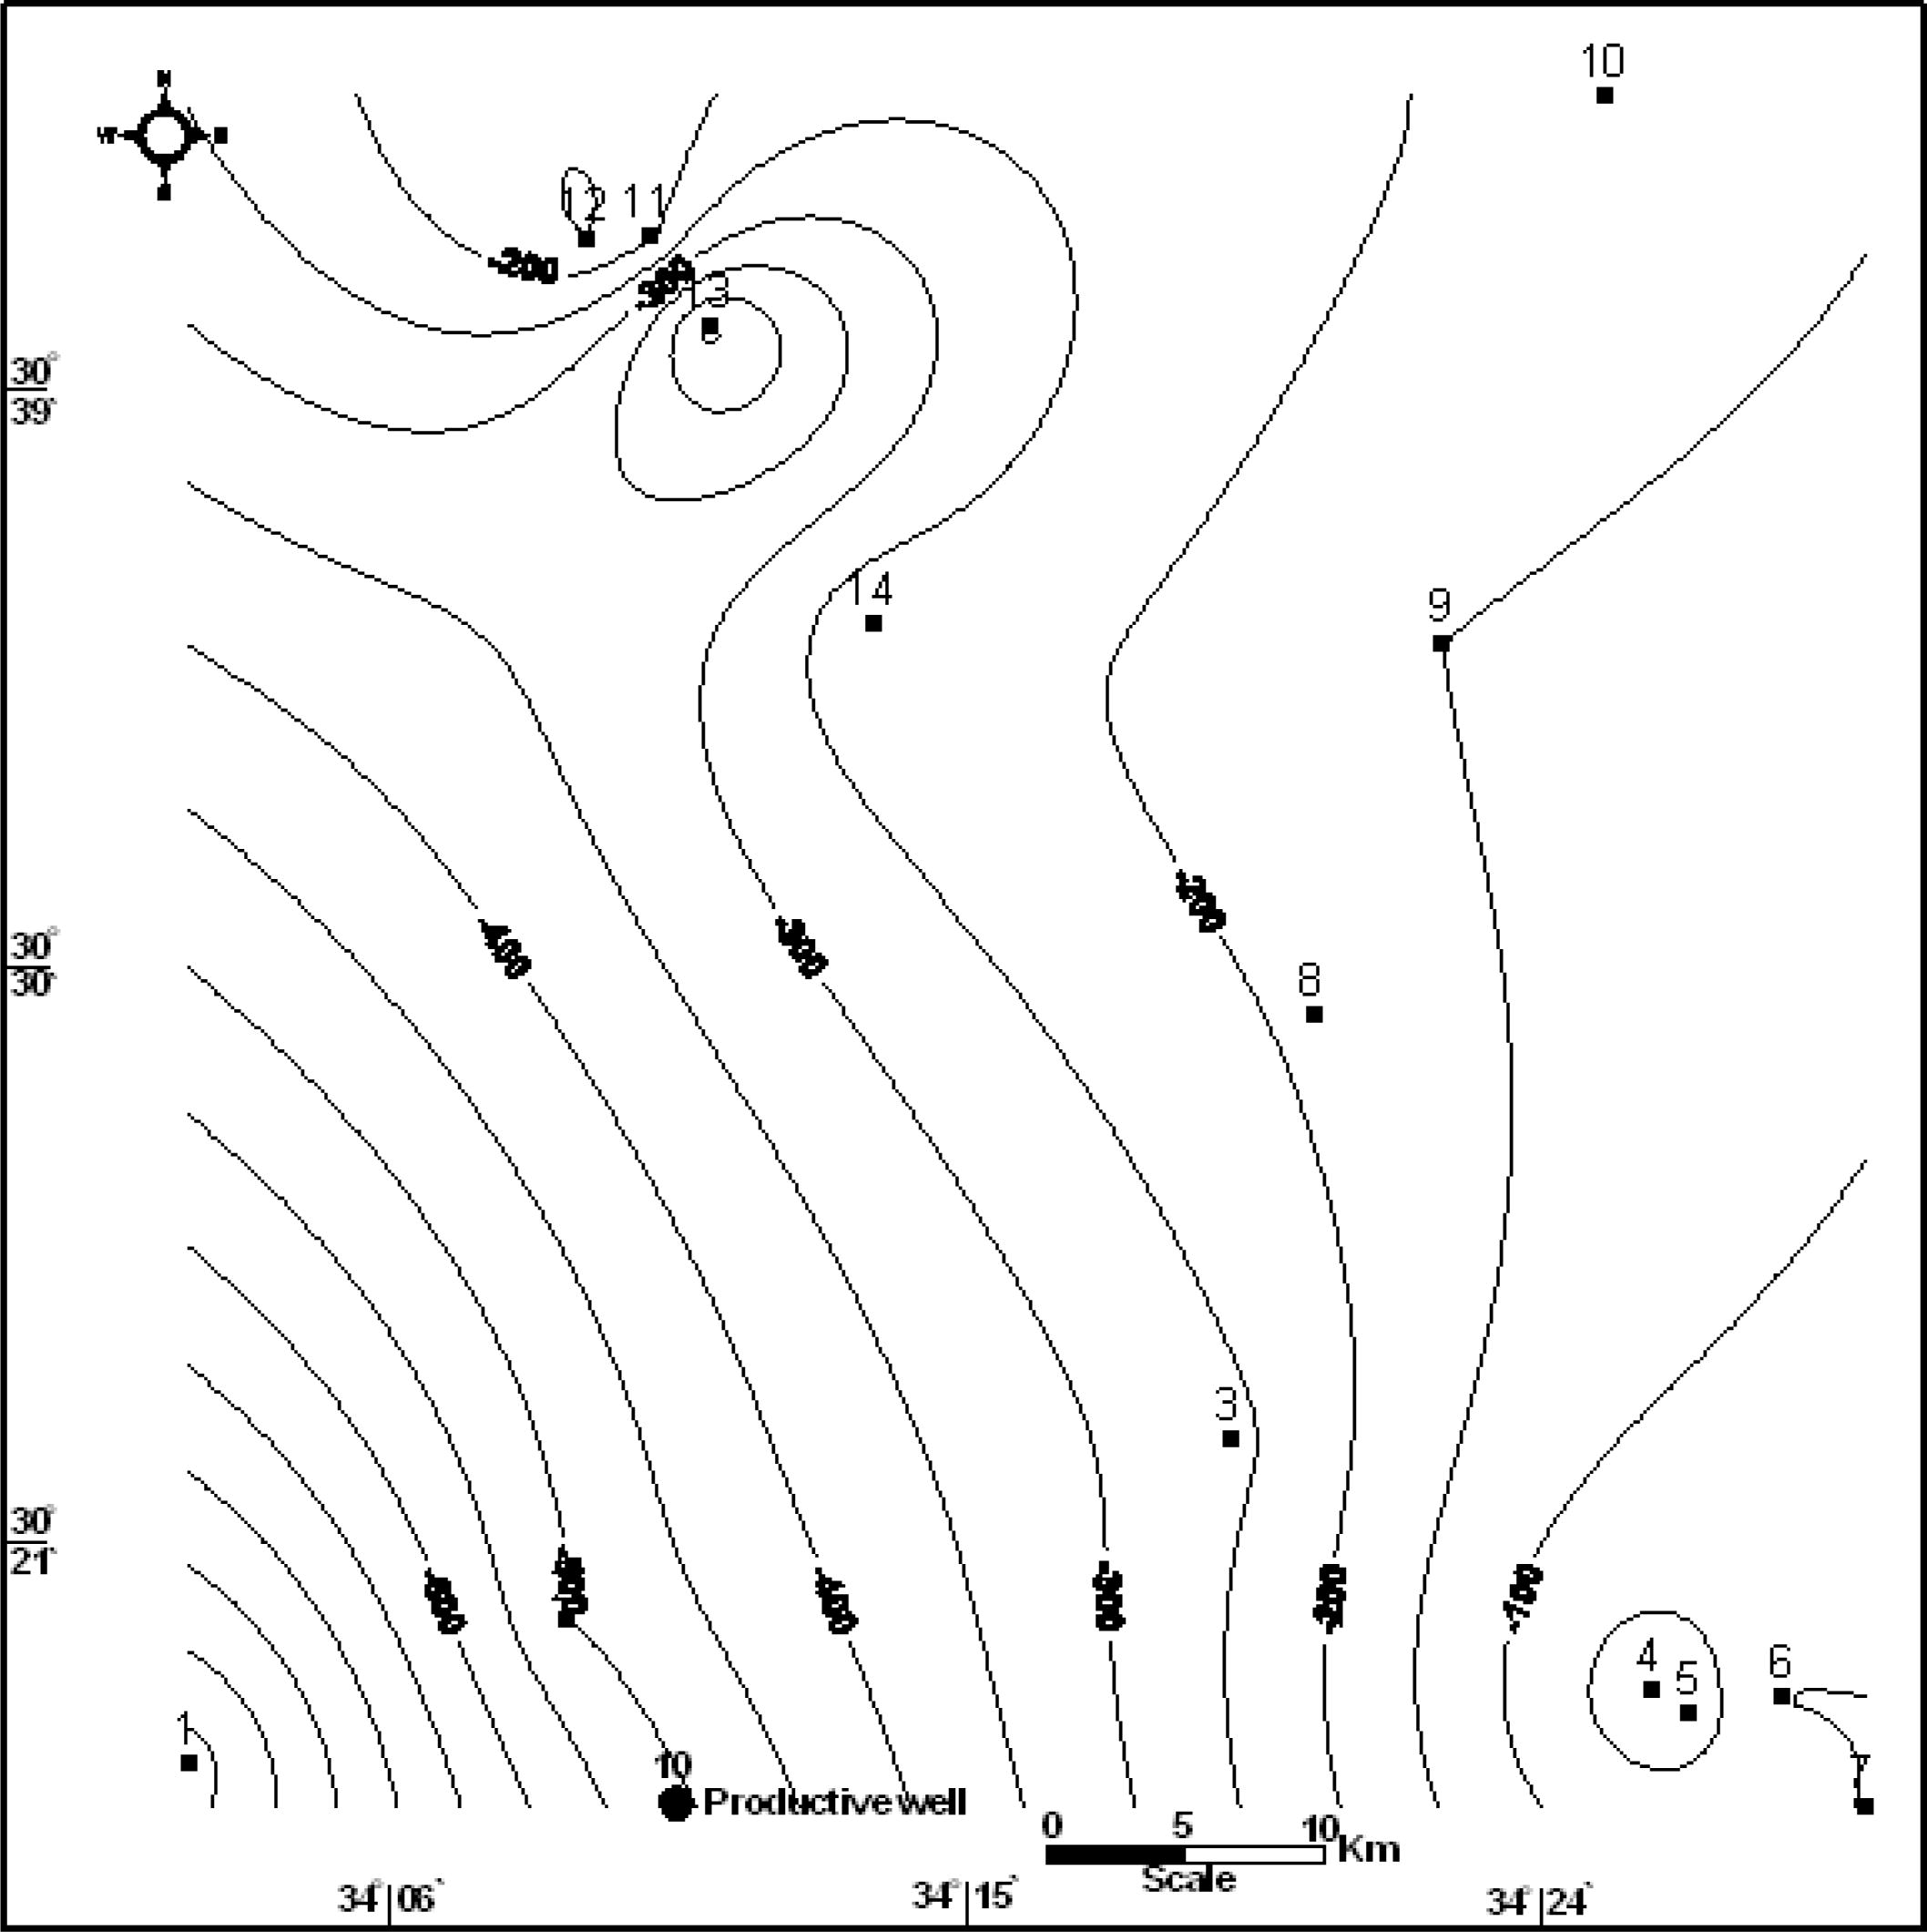
Top surface map of Lower Cretaceous aquifer related to Sea Level.
The groundwater of Lower Cretaceous aquifer exists under confined conditions. This aquifer is hydraulically connected with both the underlying Jurassic sandstone aquifer and overlying post-Nubia. This is attributed to the faulting, where the present aquifer comes in contact with each other as a result of faulting displacement (Fig. 8). The productivity of the wells tapping Lower Cretaceous sandstone aquifer varies from 20 m3/h (well no. 7) to 75 m3/h (well no. 4). The drawdown of the concerned aquifer ranges from 1.23 m (well no. 8) to 47.57 m (well no. 1) as shown in Table 2. The higher drawdown is attributed to the aquifer in this well has low effective porosity. On the other hand, the lower drawdown in well no. 8 is related to the aquifer in this well has high sand percentage and effective porosity.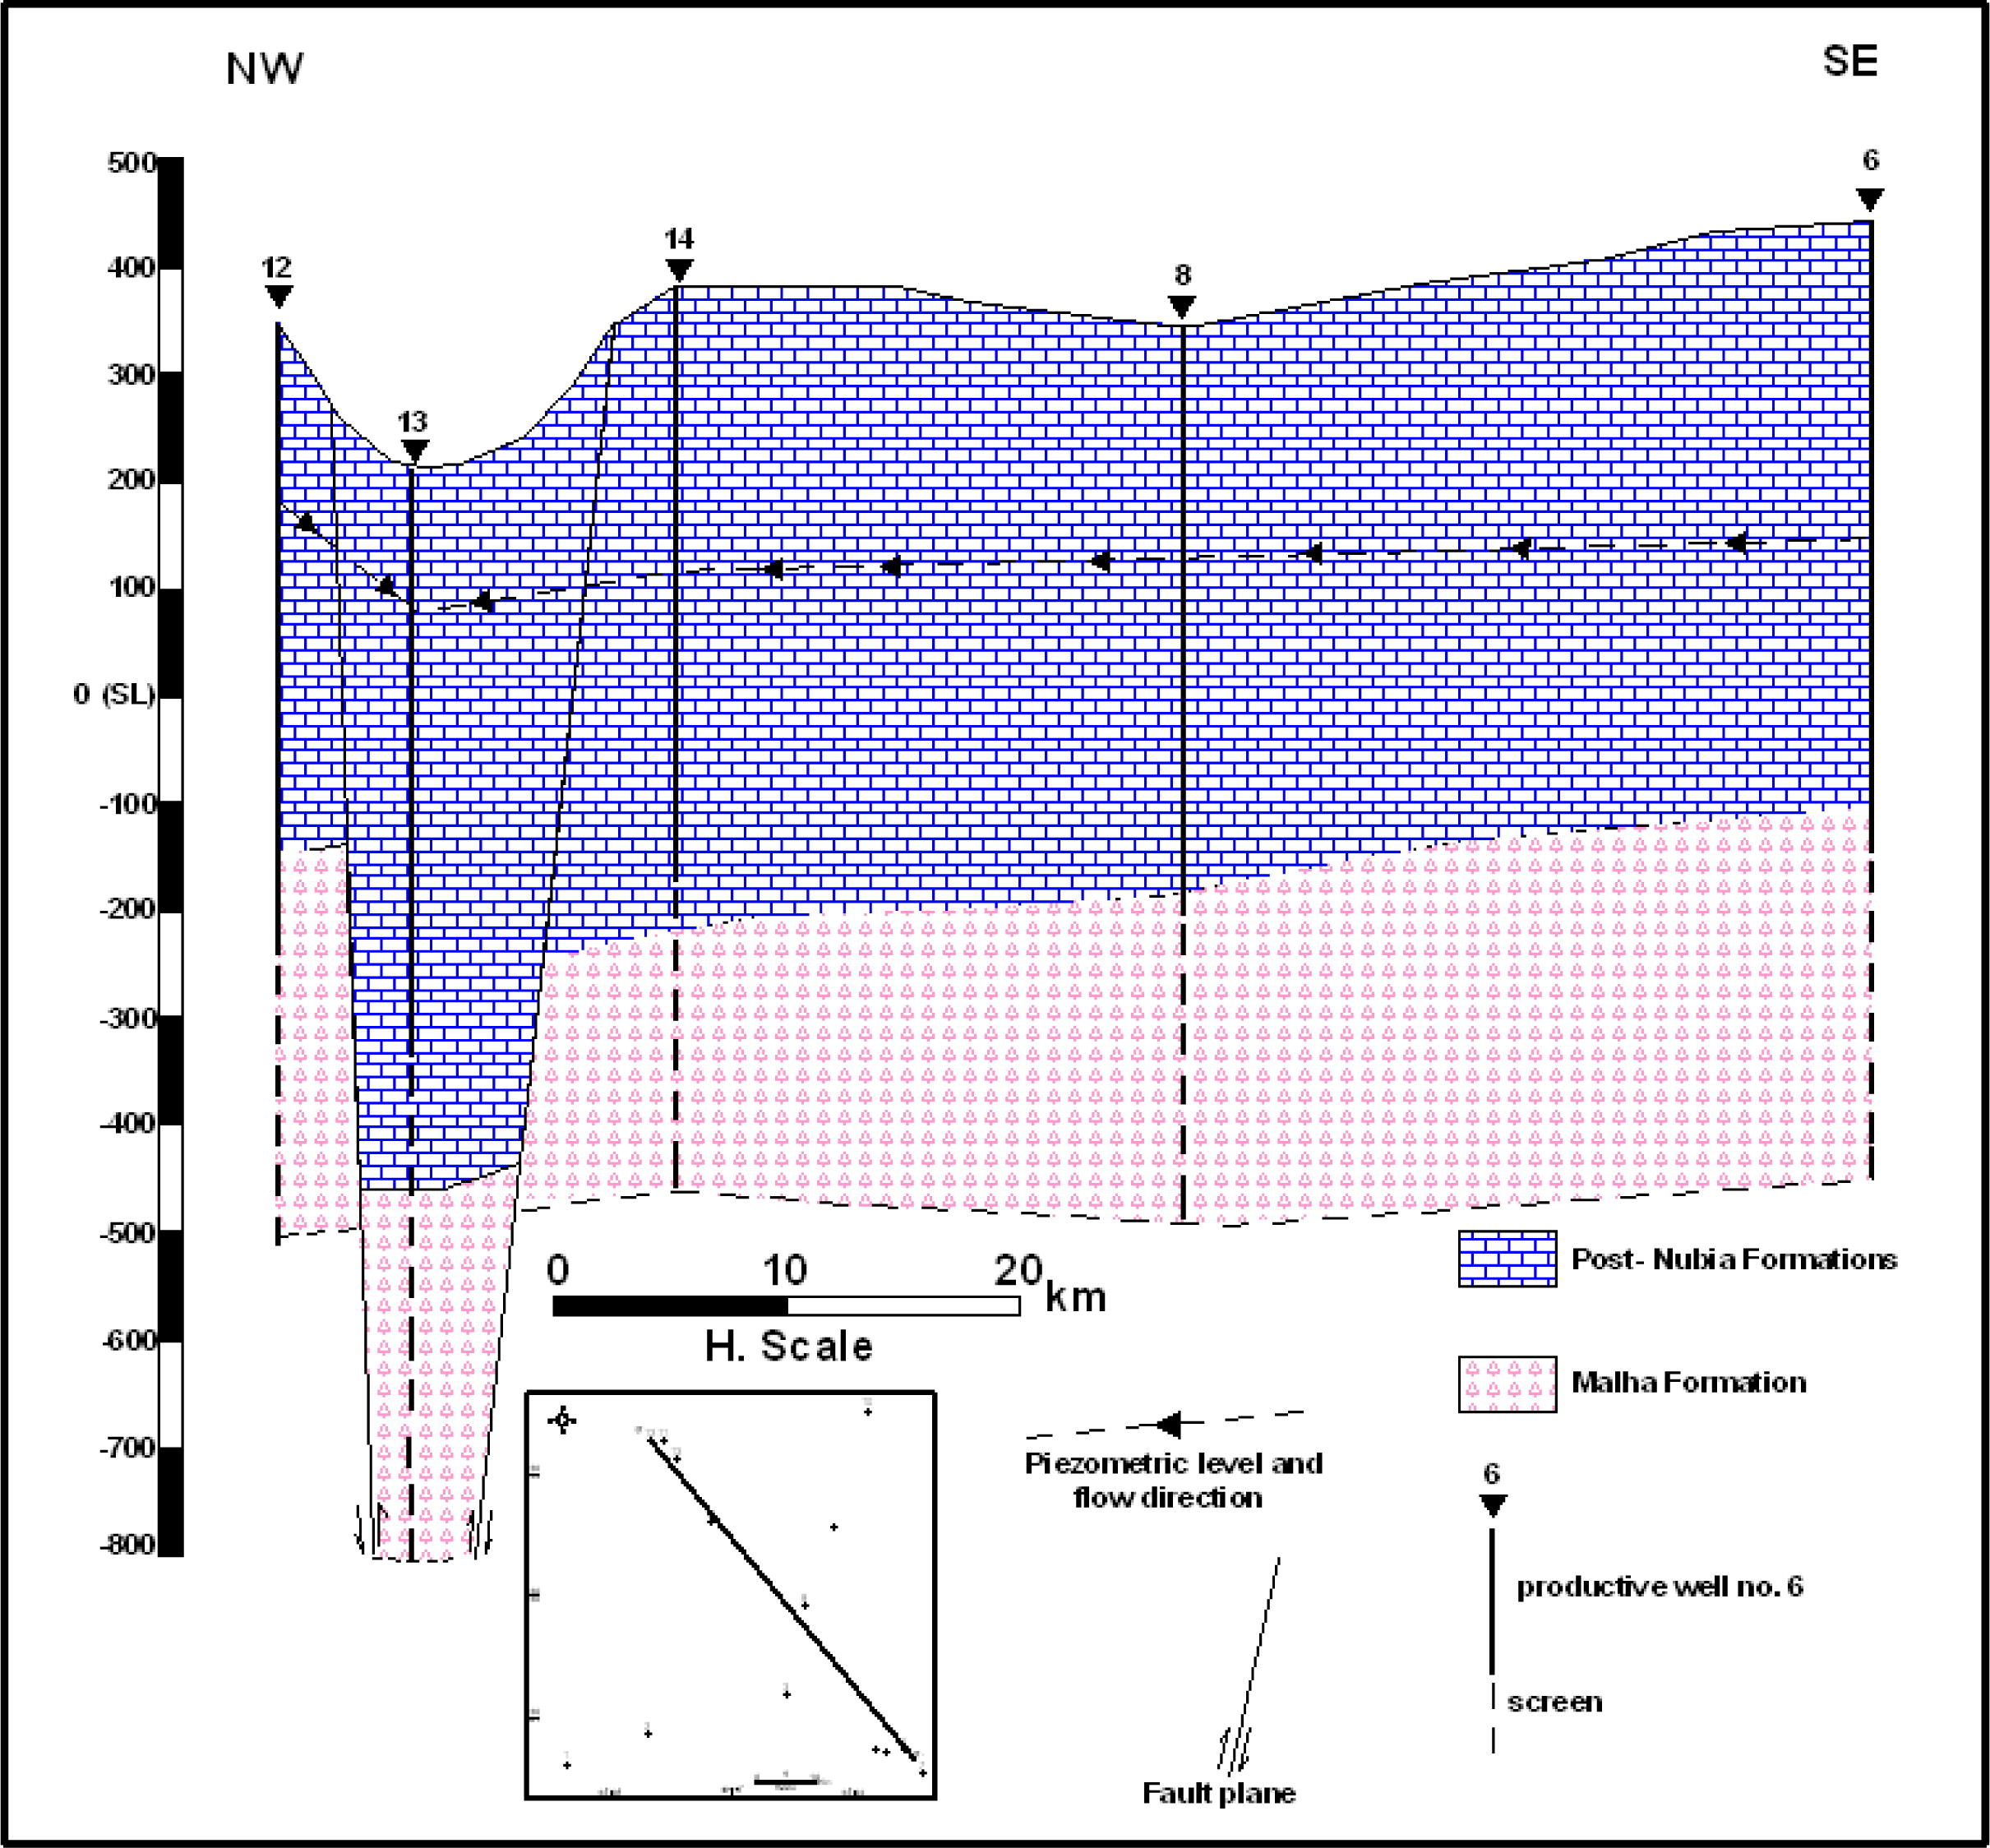
Hydrogeological cross-section in study area.
Well No.
Drawdown (m)
Transmissivity (m2/day)
Hydraulic conductivity (m/day)
Effective porosity (%)
Productivity (m3/h)
1
47.57
110
0.94
15.5
39
2
4.12
1.2
16.5
50
3
1.3
17
4
3.87
414
1.5
17.5
75
5
1.3
17
6
1.5
17.5
7
399
1.64
18
20
8
1.23
575
1.64
18
39
9
1.5
493
2.05
19
45
10
8.5
488
1.5
17.5
44
11
1.3
17
12
13.12
1.53
17.7
50
13
1.3
17
14
2.47
1.3
17
51
3.1 Groundwater flow
The Lower Cretaceous sandstone aquifer is detected in all the drilled wells in the study area and represents the main exploitable aquifer. The piezometric surface of the present aquifer ranges between 174 m (asl) in well no. 1 at southwestern portion of the study area and 115 in well no. 14 at central portion of the investigated area. The piezometric contour map reveals that the groundwater flow directions are concentric to the center of the study area (Fig. 9). This is attributed to the influence of the graben block (Fig. 8). The general hydraulic gradient reaches 0.0011 in southwestern portion, while it reaches 0.0028 in central portion of the study area. The steep hydraulic gradient of Lower Cretaceous sandstone aquifer in the central area than other areas is attributed to the influence of graben block.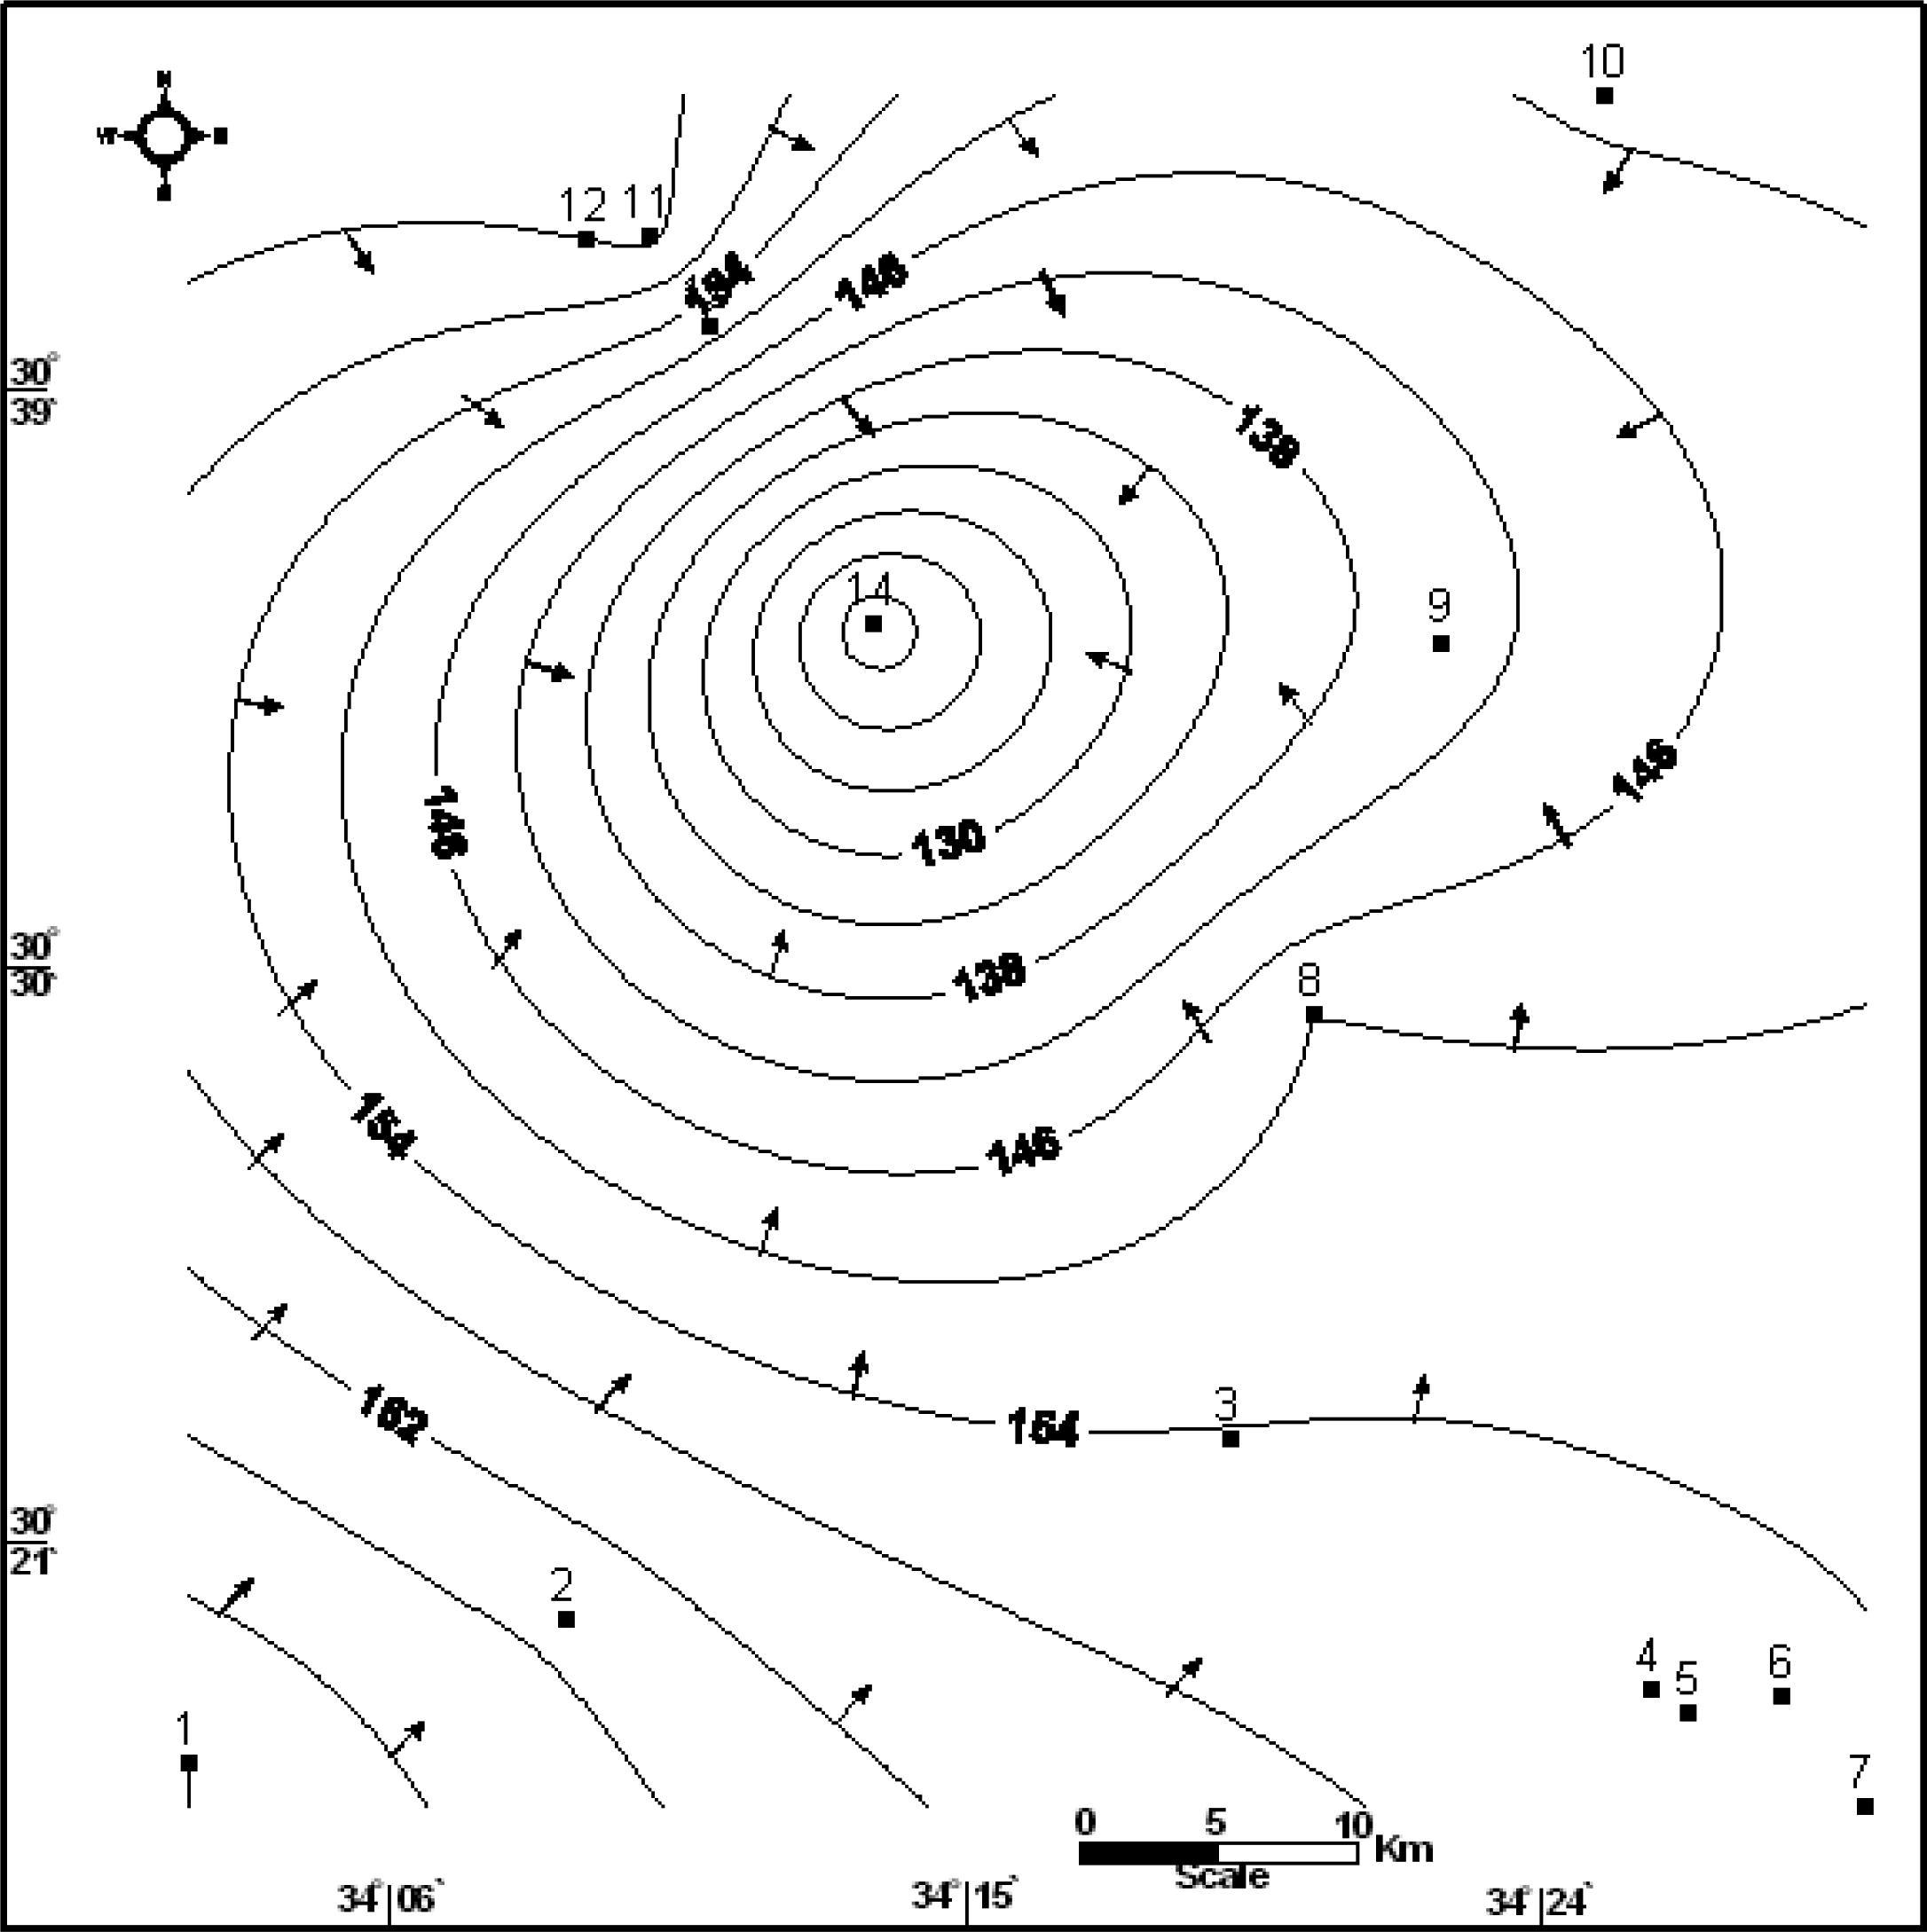
Piezometric level map of the Lower Cretaceous aquifer.
3.2 Hydrologic properties
The hydrologic properties of the Lower Cretaceous aquifer in east Central Sinai area are determined based on laboratory techniques. They comprise the following (Table 2):
3.2.1 Effective porosity (Фeff)
The effective porosity of the investigated aquifer is determined from the geophysical well logging data applying Archie equation (1942). The effective porosity is obtained by the following equation: where Фeff is the effective porosity in percent, Rt is the true resistivity in Ω m and Rw is the formation of water resistivity in Ω m.
The true resistivity (Rt) is determined by correction of the long resistivity log(R64″) or (RLLD) and short normal resistivity log(R16″) or (RLLS). The true resistivity (Rt) is obtained by the following equation: Rt = 1.7RLLD − 0.7RLLS (if RLLD > RLLS). The effective porosity of the investigated aquifer varies from 15.5% (well no. 1) to 19% (well no. 9) as shown in Table 2, with an average effective porosity reaches 17.3%. The effective porosity of the studied aquifer increases towards the northeast direction with increasing of the sand percentage as shown in Fig. 10.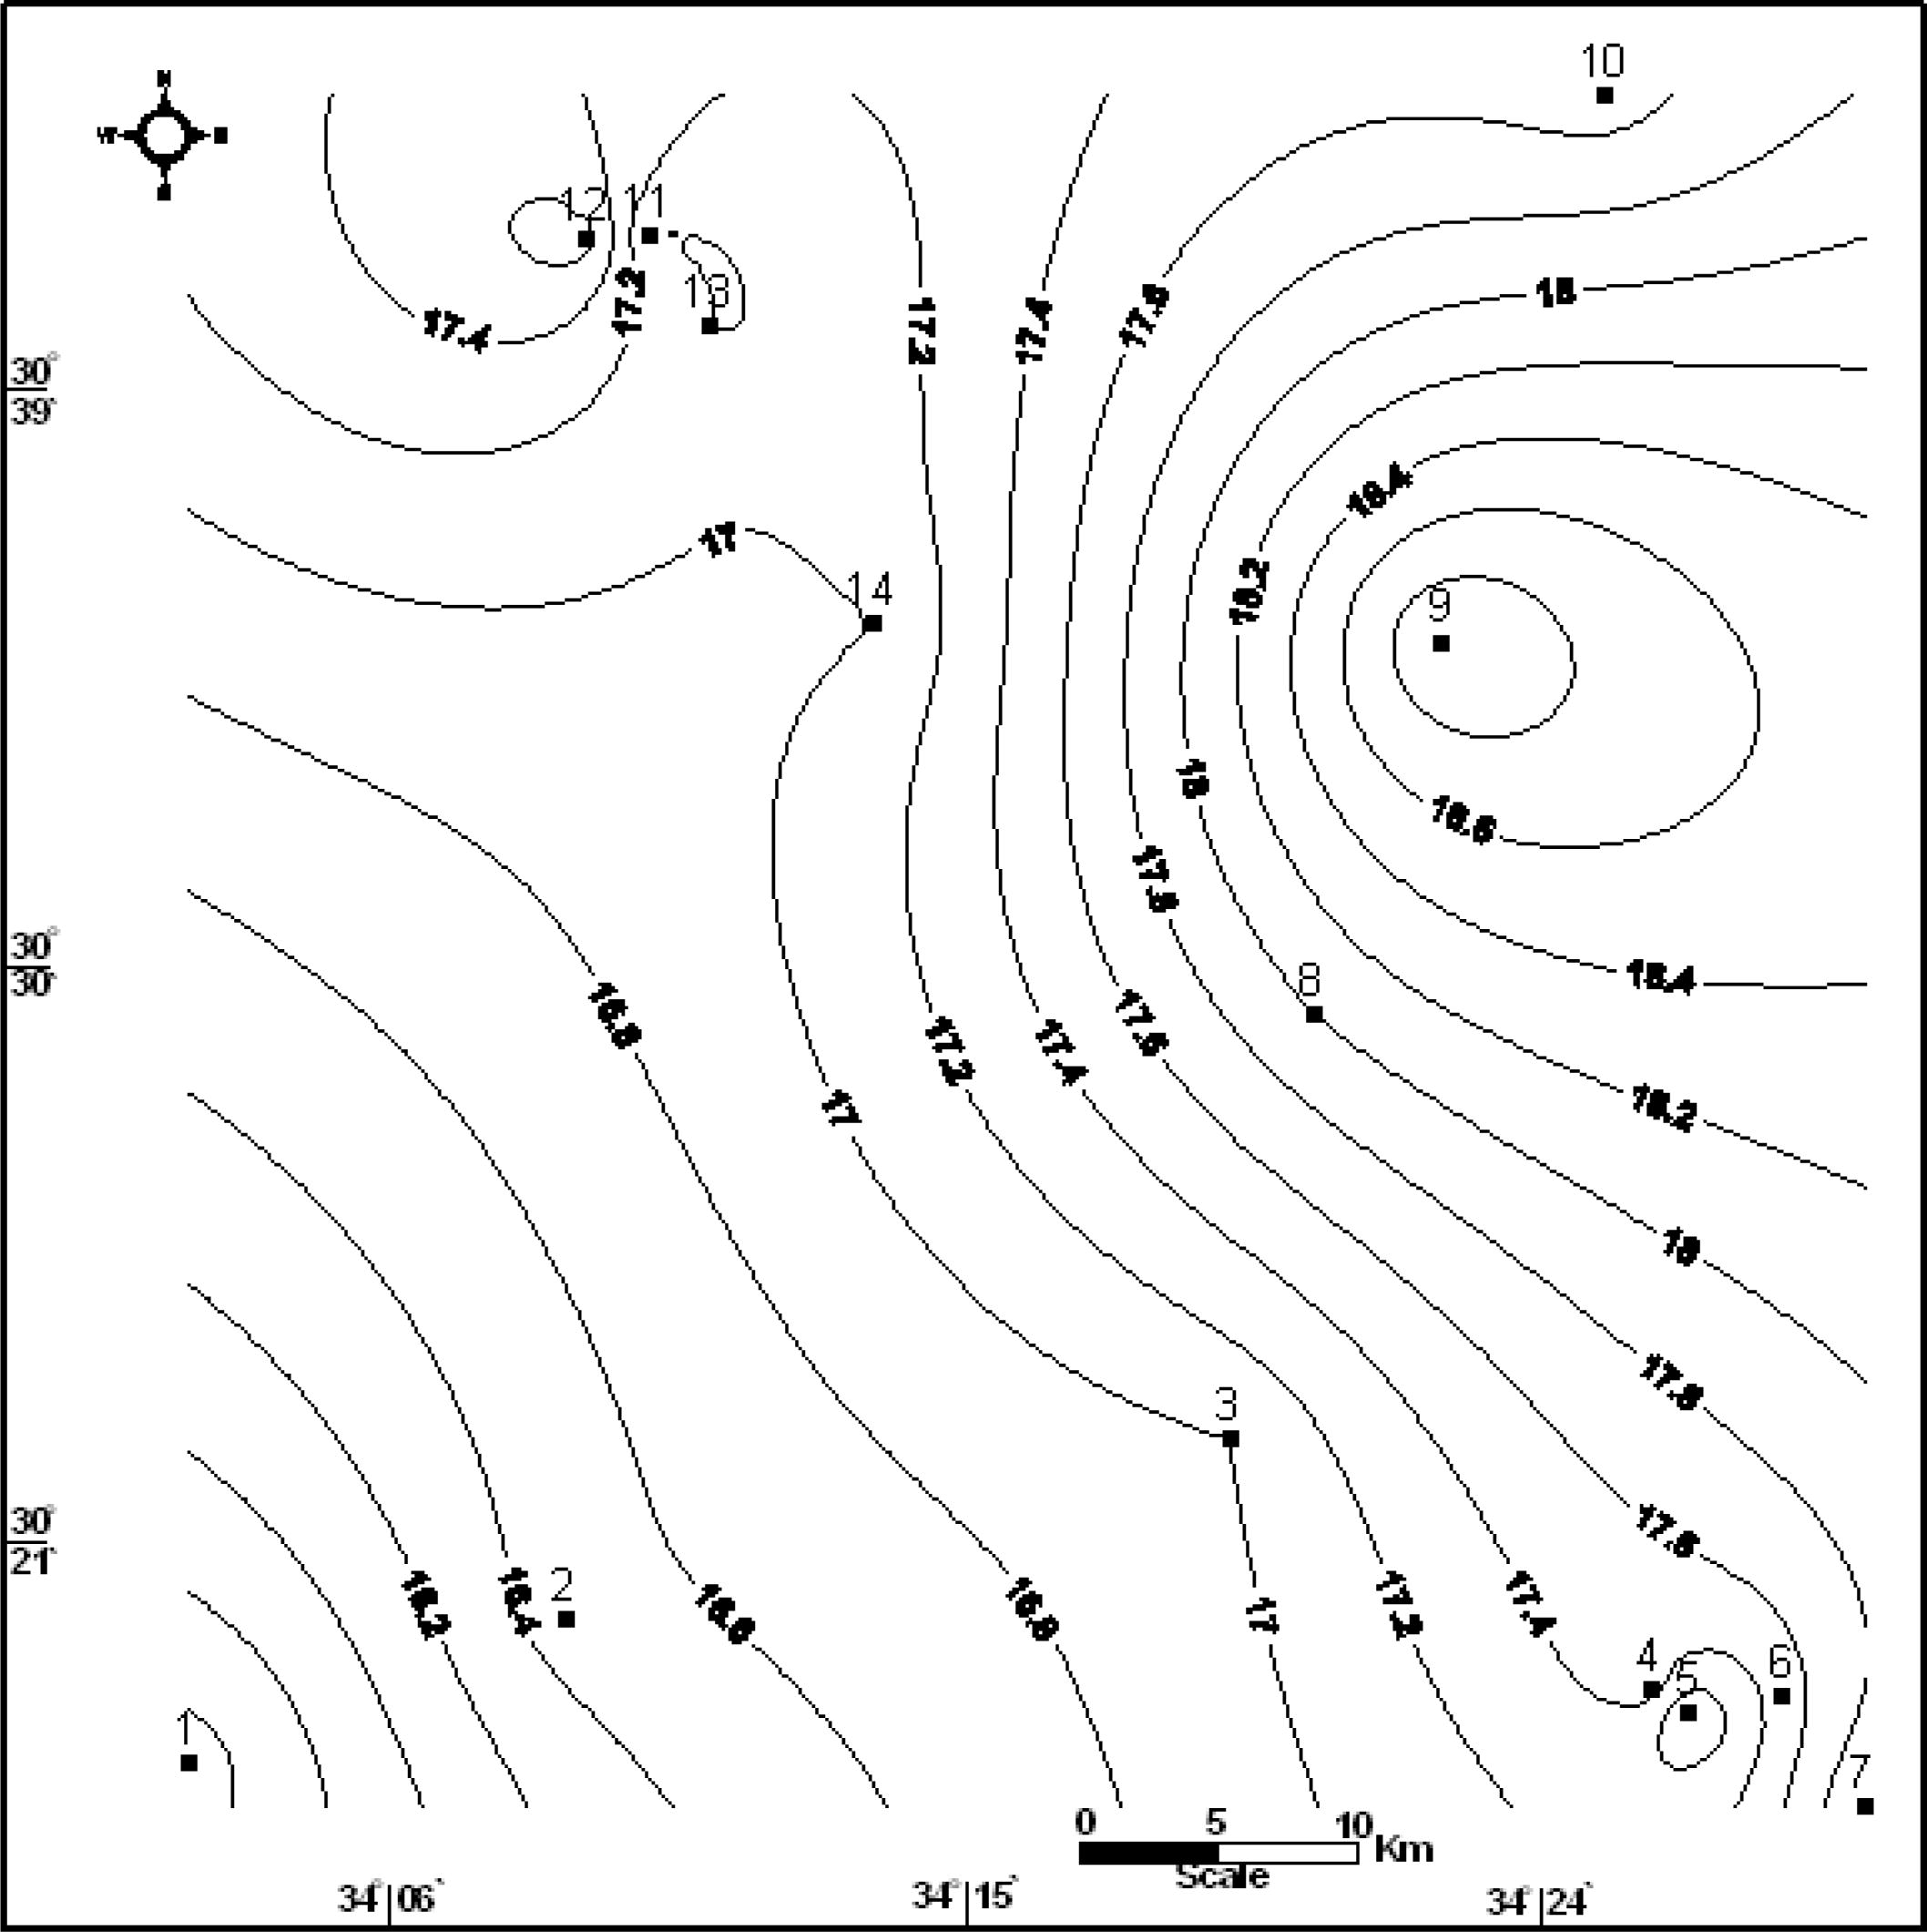
Porosity contour map of the Lower Cretaceous aquifer.
3.2.2 Transmissivity
The transmissivity of the concerned aquifer is estimated by the analyses of the obtained data of the pumping test (WRRI, 2001). The original raw data of pumping test which are obtained through the present work are analyzed by using Cooper and Jacob method (1946) and GWW computer program. Transmissivity of the investigated aquifer is calculated for five wells distributed in the study area (Table 2). The analysis of constant discharge test was executed using Cooper and Jacob method. This method was presented by Cooper and Jacob (1946) and discussed by Kruseman and de Ridder (1990). The assumptions of this method are satisfied by the present hydrogeological conditions in the studied area.
The calculated transmissivity of the concerned aquifer ranges between about 110 m2/day (well no. 1) and 575 m2/day (well no. 8) as shown in Table 2 with averages of about 416 m2/day. The low transmissivity of well no. 10 is attributed to this well have low sand percent. On the other hand, the high transmissivity of well no. 8 is due to this well has high saturated thickness and sand percent. Distribution transmissivity map is compiled for the Lower Cretaceous sandstone aquifer (Fig. 11). It reveals that the transmissivity of the concerned aquifer increases towards the northeast direction with increasing of sand percent and effective porosity.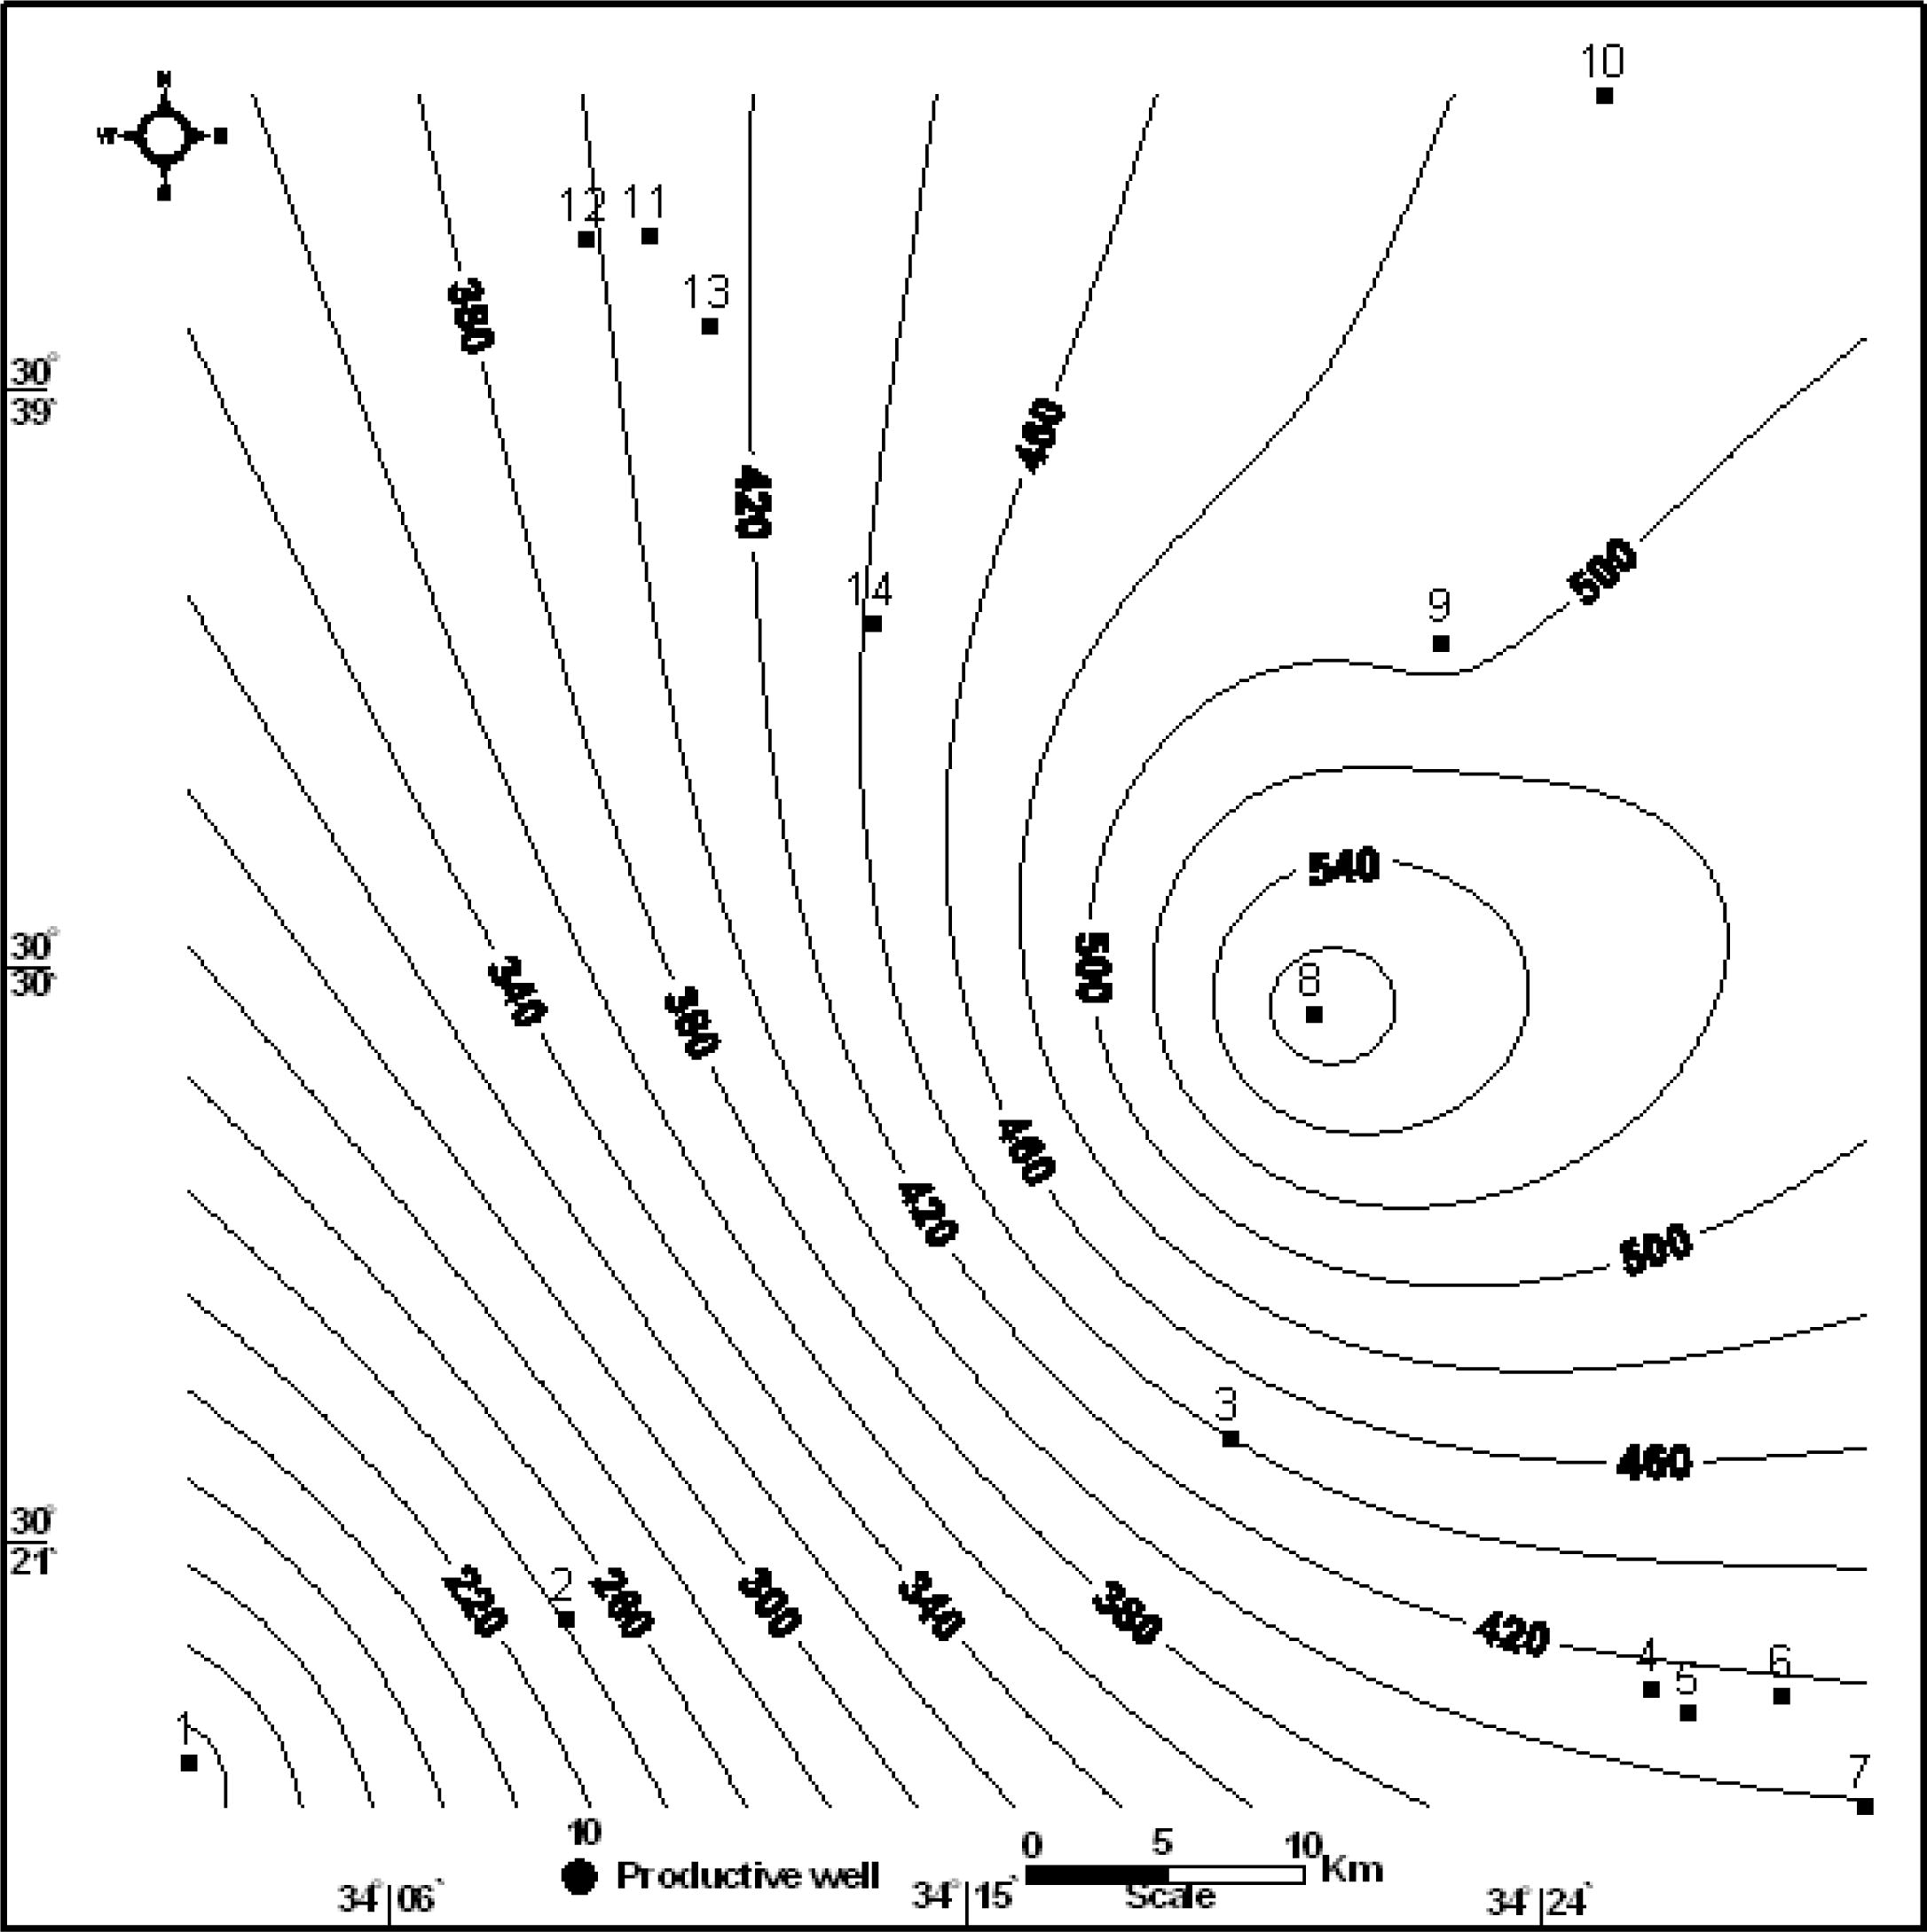
Transmissivity distribution map of Lower Cretaceous aquifer.
3.2.3 Hydraulic conductivity
The hydraulic conductivity (K) of the aquifer is determined by the substitution of effective porosity in Marotz equation (1968). The effective porosity is calculated by using Arachi equation. The hydraulic conductivity is obtained by the following equation: where Φeff is the effective porosity in decimal and K is the hydraulic conductivity in cm/s.
The hydraulic conductivity of the investigated aquifer ranges from 0.94 m/day in well no. 1 (southwestern portion) to 2.05 m/day in well no. 9 (northeastern portion) and its average attains 1.4 m/day. It increases due northeast (Fig. 12) with increasing of effective porosity and sand percentage.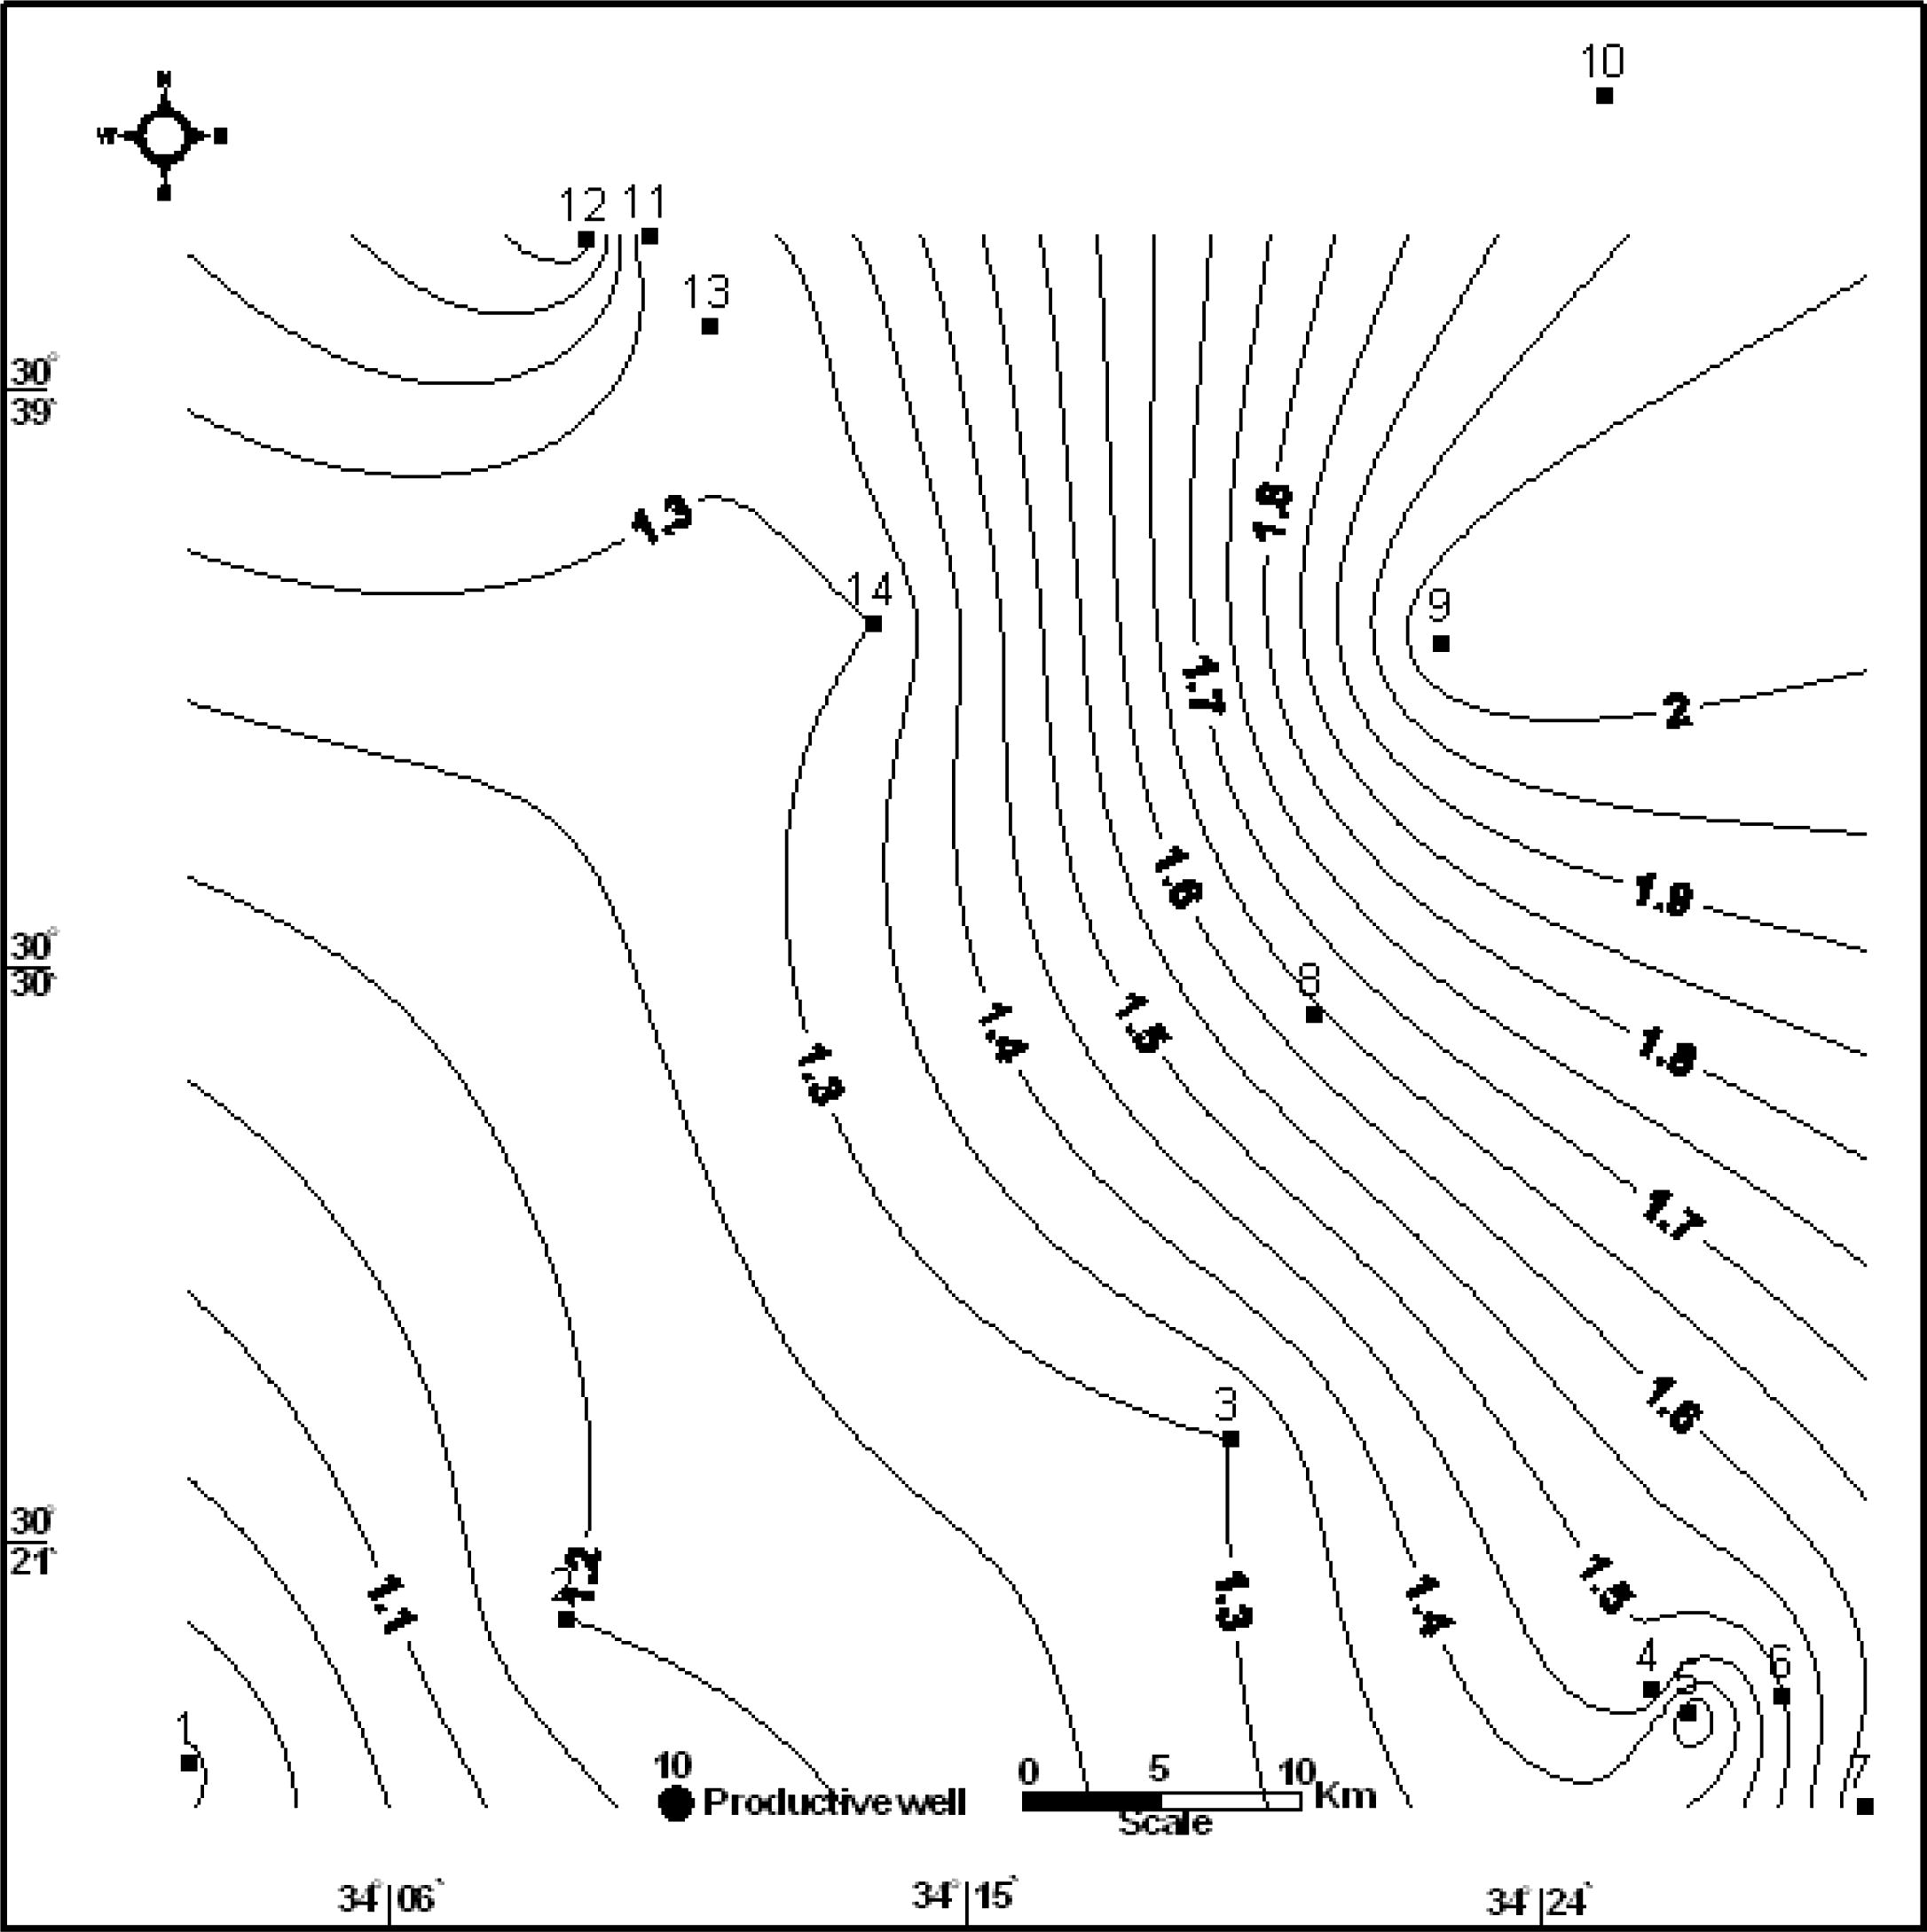
Hydraulic conductivity map of Lower Cretaceous aquifer.
4 Hydrochemical characteristics
The hydrochemical characteristics of Lower Cretaceous aquifer depend on the analyses of nine groundwater samples (Table 3). Those will be described herein through the following.
Well No.
EC (μmhos/cm)
TDS (ppm)
Units
Cations
Total (epm)
Anions
Total (epm)
Ca2+
Mg2+
Na+
K+
Cl−
1
8800
4364
ppm
660
109.4
1021
38
87.3
152
1000
2379
90.4
epm
32.93
9
44.4
0.97
2.49
20.82
67.09
epm %
37.72
10.31
50.86
1.11
2.76
23.03
74.21
2
4650
2694
ppm
204
196.95
460
60
47.91
426
500
1060
47.19
epm
10.18
16.2
20
1.54
6.89
10.41
29.89
epm %
21.25
33.81
41.74
3.2
14.6
22.06
63.34
3
6200
3778
ppm
420
328
400
56
66.75
248
1000
1450
65.77
epm
20.96
26.97
17.39
1.43
4.06
20.82
40.89
epm %
31.4
40.4
26.05
2.15
6.18
31.65
62.17
4
4550
2809
ppm
201
70.1
675
23
47.73
302.6
739
950
47.14
epm
10.03
5.77
29.35
0.59
4.96
15.39
26.79
epm %
21.93
12.61
64.18
1.29
10.52
32.64
56.84
5
5656
3242
ppm
272
106
760
20
55.84
398.9
380
1505
56.89
epm
13.57
8.72
33.04
0.51
6.54
7.91
42.44
epm %
24.3
15.62
59.17
0.91
11.49
13.9
74.61
8
6200
3634
ppm
320
225
640
20
62.81
220
1000
1318.76
61.62
epm
15.97
18.5
27.83
0.51
3.61
20.82
37.19
epm %
25.42
29.46
44.31
0.81
5.86
33.79
60.35
9
9100
5256
ppm
380
364.8
996
20
92.77
172
1050
2360.46
91.24
epm
18.96
30
43.3
0.51
2.82
21.86
66.56
epm %
20.44
32.34
46.67
0.55
3.09
23.96
72.95
10
4250
2510
ppm
224
87.58
560
40
43.75
228
525
960
41.74
epm
11.18
7.2
24.35
1.02
3.74
10.93
27.07
epm %
25.55
16.46
55.66
2.33
8.95
26.19
64.86
12
4850
2880
ppm
78
76.4
878
40
49.37
332
435
1207.4
48.55
epm
3.89
6.28
38.18
1.02
5.44
9.06
34.05
epm %
7.88
12.73
77.32
2.07
11.20
18.66
70.14
4.1 The groundwater salinity
The groundwater salinity of the studied aquifer reveals a great variation reflecting the effect of the facies changes, the structural effect and the hydrochemical processes. It varies from 2510 ppm (well no. 10) to 5256 ppm (well no. 9), where it is brackish water. The low groundwater salinity is related to this well which is located in the upthrown side of the fault (Fig. 8), where the faults are generally accompanied by the presence of best groundwater especially on their upthrown sides (Youssef and El-Saady, 1964). The high salinity of well no. 9 is essentially attributed to this well which is located in graben block, where the groundwater moves due graben and increases salinity with flow direction. The constructed groundwater salinity for this aquifer reveals an increase of groundwater salinity due central of the study area with groundwater flow direction (Fig. 13).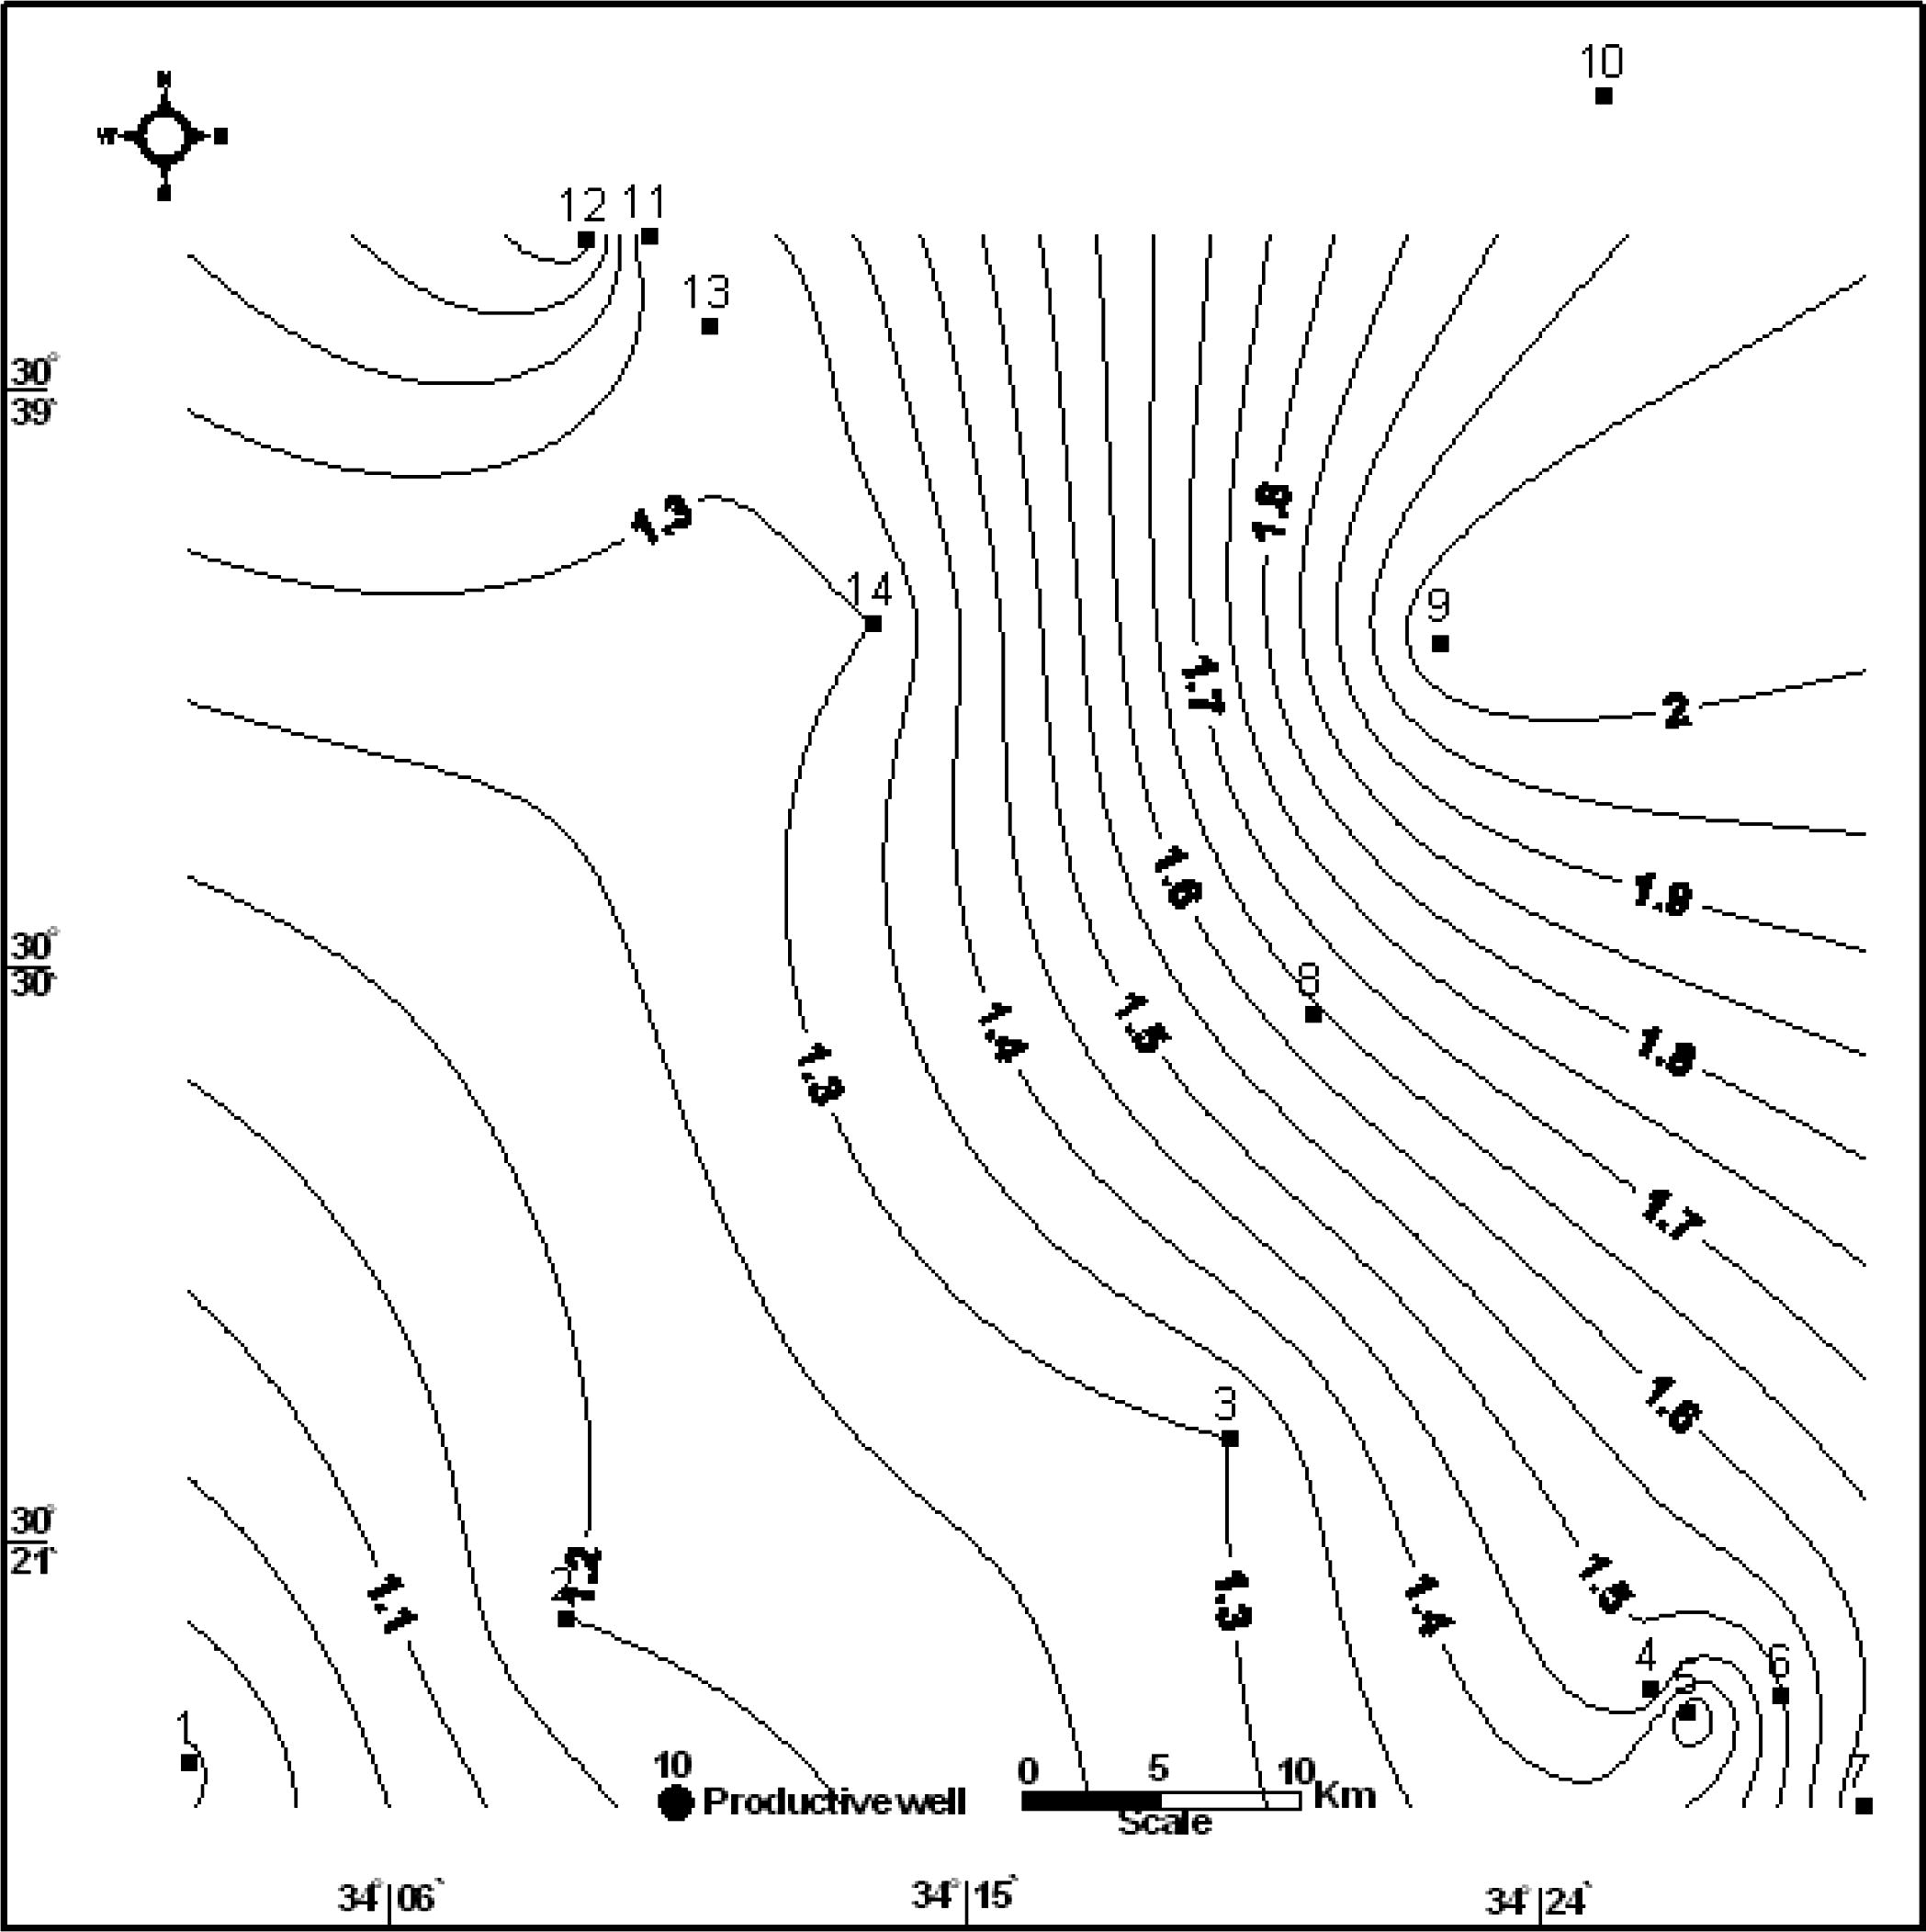
Distribution map of groundwater salinity of Lower Cretaceous aquifer.
4.2 Ion dominance
The ion concentrations, the sodium and chloride dominate the other ions in the majority of the groundwater samples. The sequence of ion dominance of both cations and anions in the water follows the order Na+ > Mg2+ (Ca2+) > Ca2+ (Mg2+) and . So, the chemical water type is sodium chloride. The magnesium and calcium exceed the sodium ions only in well no. 3 with the abundance of the chloride among the anions. Consequently, the water chemical type in this case becomes magnesium chloride in well no.
4.3 The hypothetical salt
The hypothetical salt assemblages: the dissolved salts in the groundwater of the studied aquifer are grouped into two assemblages of hypothetical salts combinations as the following (Table 4):
Group I: NaCl, MgCl2, CaCl2, CaSO4 and Ca(HCO3)2. This assemblage has been encountered in the majority of the wells.
Group II: NaCl, MgCl2, MgSO4, CaSO4 and Ca(HCO3)2. Such salts are only found in wells nos. 1 and 4.
| Well No. | Hydrochemical coefficients hypothetical salts | |||||||
|---|---|---|---|---|---|---|---|---|
| NaCl | MgCl2 | ClCl2 | MgSO4 | CaSO4 | Ca(HCO3)2 | Mg(HCO3)2 | Na2SO4 | |
| 1 | 51.97 | 10.31 | 11.93 | – | 23.03 | 2.76 | – | |
| 2 | 44.94 | 18.4 | – | 3.66 | 21.25 | 11.75 | ||
| 3 | 28.2 | 33.97 | – | 6.43 | 25.22 | 6.18 | – | |
| 4 | 56.84 | – | – | 12.61 | 11.4 | 10.52 | 8.63 | |
| 5 | 60.08 | 14.53 | – | 1.09 | 12.81 | 11.49 | – | – |
| 8 | 45.12 | 15.23 | – | 14.23 | 19.56 | 5.86 | – | – |
| 9 | 47.22 | 25.73 | – | 6.61 | 17.35 | 3.09 | – | – |
| 10 | 57.99 | 6.87 | – | 9.59 | 16.6 | 8.95 | – | – |
| 12 | 70.14 | – | – | 9.41 | – | 7.88 | 3.32 | 9.25 |
It is noticed that the above two groups comprise MgCl2 and CaCl2 salts of marine origin. This is attributed to the present aquifer which is hydraulically connected with post-Nubia limestone aquifers rich in marine salts.
4.4 Hydrochemical facies
Durov's diagram (Durov, 1948) gives more information on the hydrochemical facies and the evolution of groundwater quality. It helps in identifying hydrochemical facies or water types and can indicate mixing of different water types, ion-exchange and reverse ion- exchange processes. The expanded Durov's diagram (Fig. 14) was used to help in classifying groundwater types and identifying hydrochemical facies in the study area.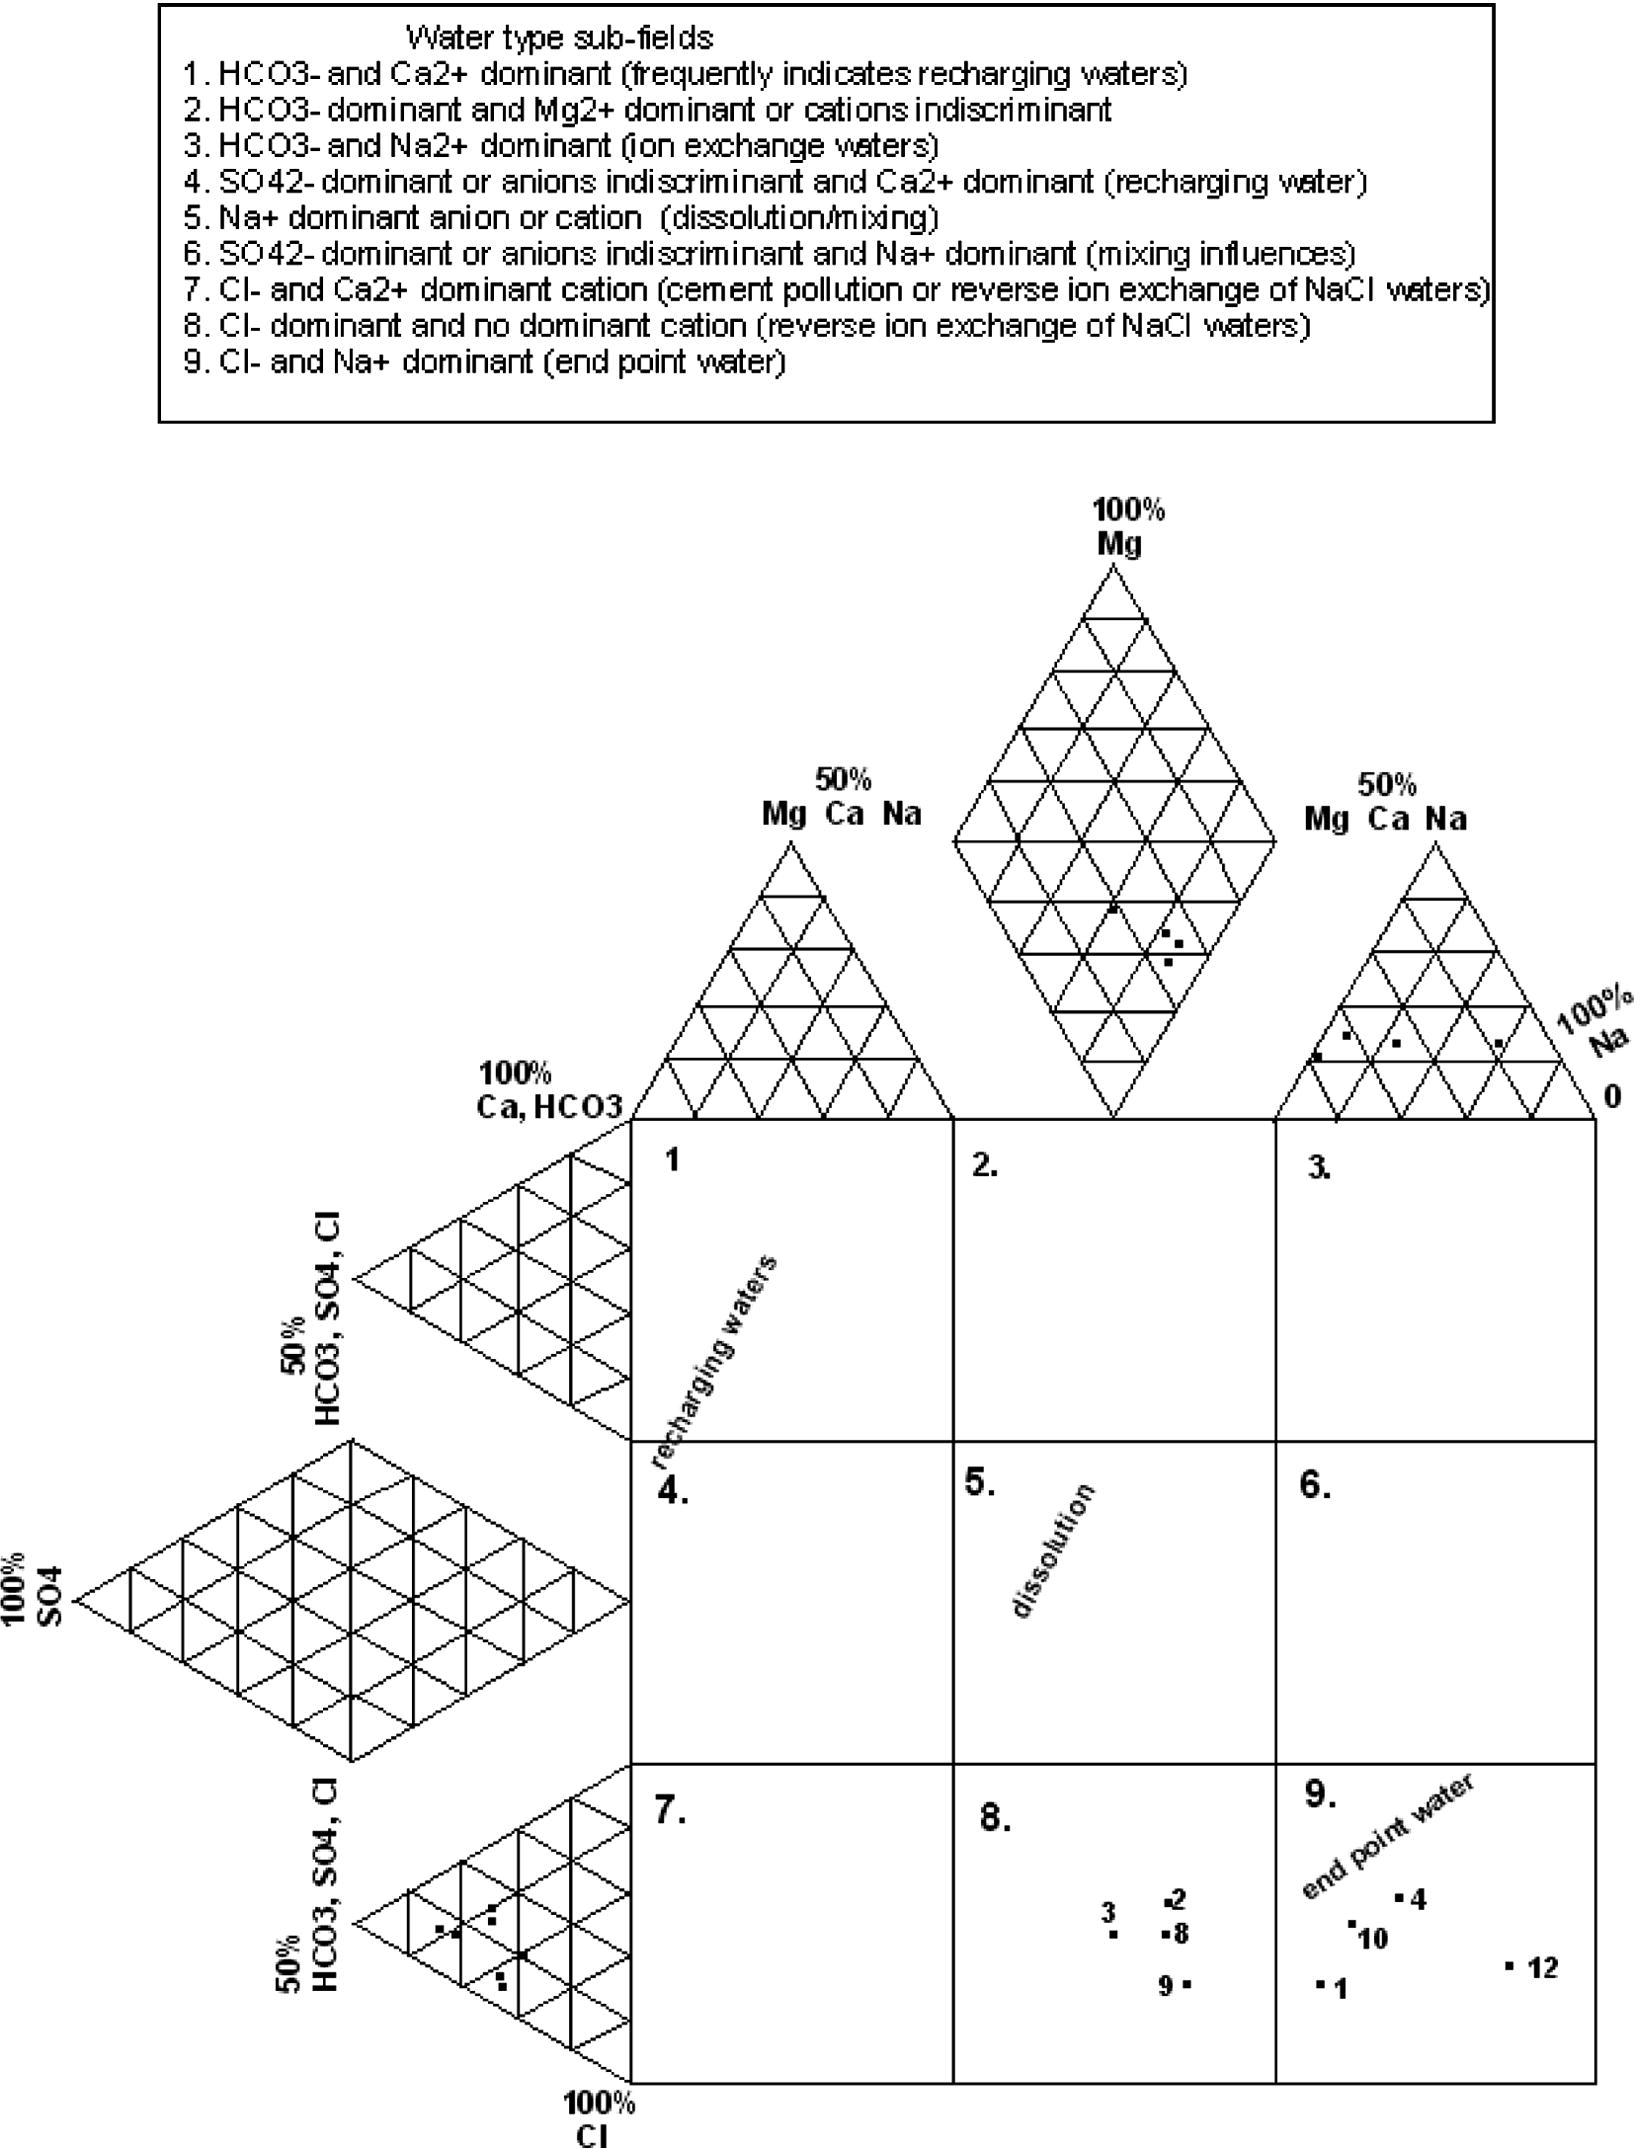
Durov diagram (expanded) of groundwater samples.
The groundwater types of the Lower Cretaceous aquifer were formed to belong to two hydrochemical facies, according to their order of importance; the types were 8 and 9. Type 8 is chloride anion, and has no dominant cation (wells 2, 3, 8 and 9). The last type 9 is chloride and sodium ions as dominant (wells 1, 4, 10 and 12) indicating the end point water.
4.5 Groundwater quality
Different chemical quality standards have been established for evaluating the water suitability for drinking, domestic, livestock and irrigation uses (Table 5). In the present study the groundwater suitability for different uses is based on the concentration of its major ion constituents.
Well No.
EC (mmohs/cm)
TDS (ppm)
SAR (epm)
Na (%)
Evaluation for
Drinking
Livestock and poultry
Irrigation by US salinity
1
8800
5284
9.9
52
Unsuitable
Excellent
C3S1
2
4650
2644
5.9
45
Unsuitable
C2S1
3
6200
3778
3.8
28
Unsuitable
C2S1
4
4550
2809
10.6
63
Unsuitable
C3S1
5
5656
3242
10
60
Unsuitable
C2S1
8
6200
3654
6.8
45
Unsuitable
C3S1
9
9100
5285
8.8
47
Unsuitable
C3S1
10
4250
2510
8.4
58
Unsuitable
C2S1
12
4850
2880
17.4
79
Unsuitable
C3S1
4.5.1 Groundwater quality for drinking and domestic uses
The evaluation of groundwater quality for drinking and domestic uses is attempted depending on some international standards, suggested by the World Health Organization (WHO, 1993). The groundwater samples have total dissolved solids (TDS) that exceed the safe limits for drinking use. So, the groundwater in the area is not suitable for drinking.
4.5.2 Groundwater quality for livestock and poultry uses
The evaluation of the groundwater for livestock and poultry uses is based on the National Academy of Science (1972) limitations. According to the classification of National Academy of Science (1972), the groundwater in the study area can be classified into two main categories: (a) very satisfactory (TDS 1000–3000 mg/l) for the groundwater in the wells nos. 2, 4, 10 and 12. (b) Satisfactory water for livestock and poor for poultry (TDS 3000–5000 mg/l) in wells nos. 3, 5 and 8. On the other hand, the groundwater in wells nos. 1 and 9 can be used with reasonable safety for livestock and not acceptable for poultry.
4.5.3 Groundwater quality for irrigation purposes
Several chemical constituents affect water suitability for irrigation from which the total concentration of the soluble salts and the relative proportion of sodium to calcium and magnesium. Moreover suitability of water for irrigation is depended on the effect of some mineral constituents in the water on both the soil and the plant.
The groundwater quality in the area is evaluated also taken both the TDS and SAR values in consideration based of the irrigation water which based in turn on EC or TDS and SAR. The analyzed samples were plotted on US Salinity Laboratory Staff Method (1954) as shown in Fig. 15. The groundwater in the study area can be classified into three categories: (a) water of very high salinity and medium sodium (C4S2); this class includes groundwater sample no. 2, which presents an appreciable sodium hazard in the fine-textured soils especially under low-leaching conditions. This water category is satisfactory for salt tolerant crops and soils of good permeability with special leaching. (b) Water of very high salinity and high sodium (C4S3); this class includes groundwater samples nos. 4 and 10. These groundwater samples are unsuitable for irrigation in most soils and require special soil management, good drainage, high leaching and organic matter additions. (c) Water of very high salinity and very high sodium (C4S4); this class includes groundwater sample no. 12. It is unsuitable for irrigation in most soils and requires special soil management, good drainage, high leaching and organic matter additions.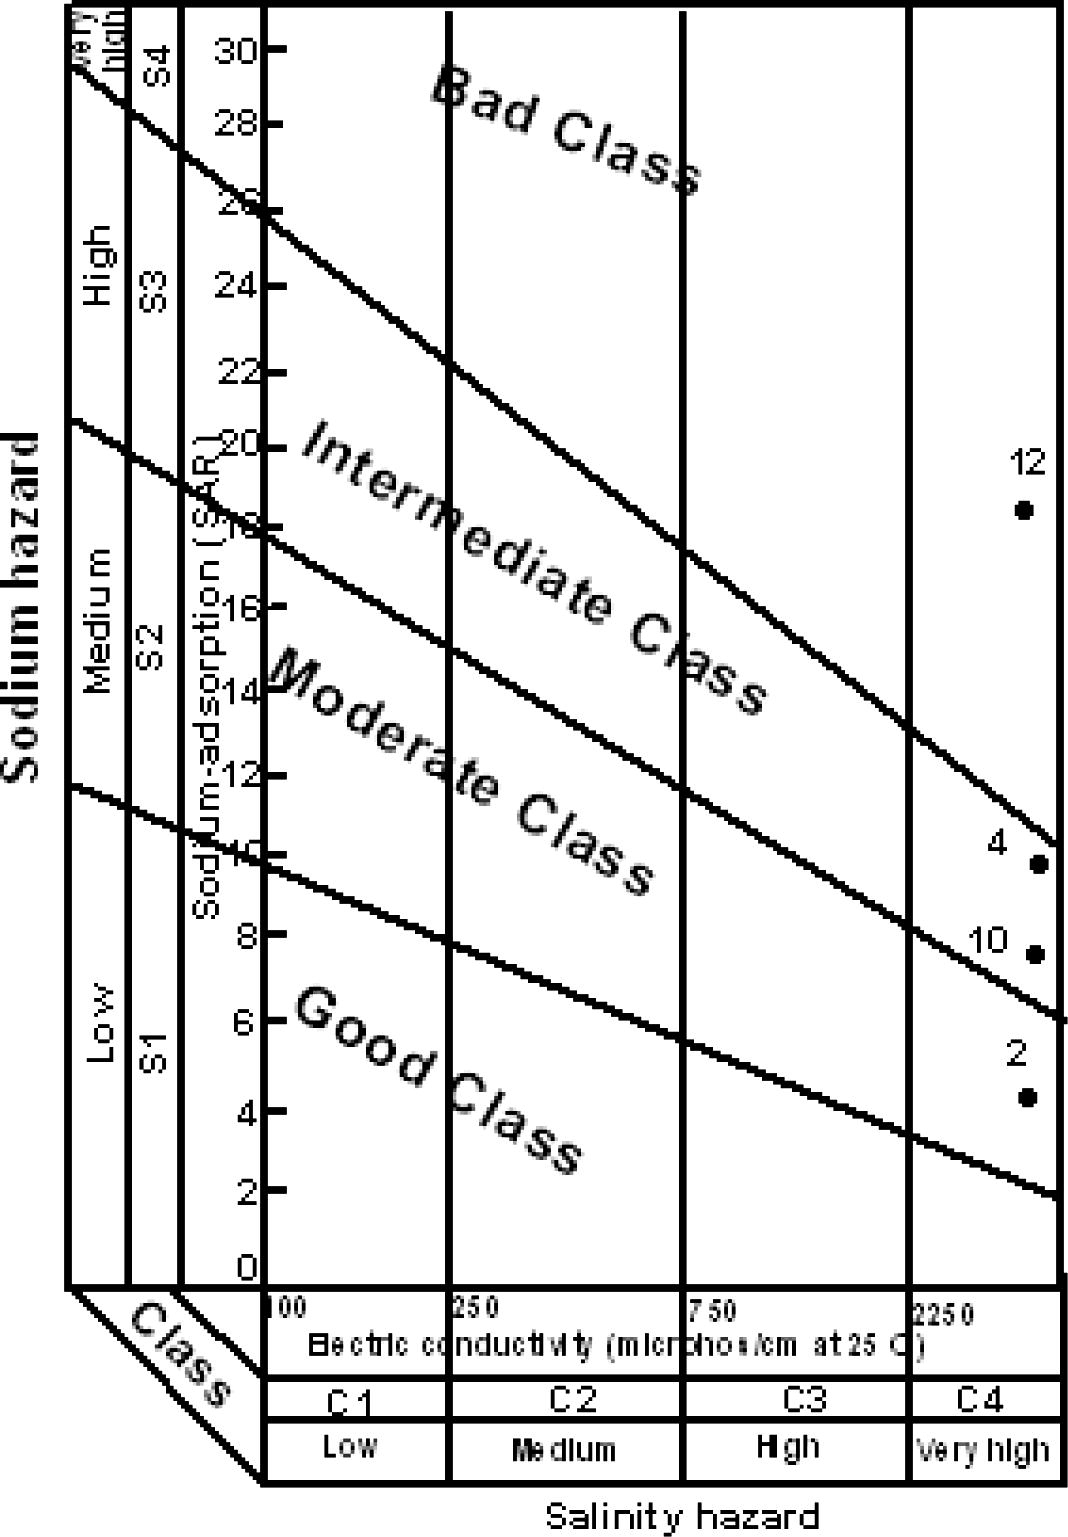
Classification of groundwater for irrigation (according to US Salinity Laboratory Staff Method, 1954), Lower Cretaceous aquifer.
On the other hand, the remaining groundwater samples nos. 1, 3, 5, 8 and 9 having high salinity and their EC are more than 5000 (μmohos/cm). So these samples lie out of the diagram.
4.6 Conclusions
-
In the study area, the Lower Cretaceous sandstone aquifer (Malha sandstone aquifer) is main source for groundwater.
-
The aquifer parameters (effective porosity, transmissivity and hydraulic conductivity) increase due northeast with an increase of the sand percentage.
-
The groundwater salinity for this aquifer reveals an increasing of groundwater salinity due central of study area coinciding with groundwater flow.
-
Evaluation of the concerned aquifer is achieved in the present work depending upon the new hydrogeological data for 14-drilled wells as well as hydrochemical analyses of some groundwater samples.
4.7 Recommendations
The cost of the extracted groundwater from the Lower Cretaceous sandstone aquifer is very expensive due to the pumps being installed at high depth ranging from 200 to 300 m below ground surface. It is recommended putting this groundwater to the best uses.
References
- Ali, O.F., 2006. Hydrogeological studies on Lower Cretaceous rocks (Nubia sandstone aquifer) in Central Sinai, Egypt. Ph.D. Thesis, Fac. Sci., Azhar University, Egypt, 282pp.
- The electric resistivity logs and an aid in determine some reservoir characteristics. Petrol. Technol.. 1942;5:54-62.
- [Google Scholar]
- Continental Oil Company (CONOCO), 1987. Geologic map of Egypt (Scale 1:500,000).
- A generalized graphical method for evaluating formation constants and summarizing well history. Geophys. Union Trans.. 1946;27:526-534.
- [Google Scholar]
- Natural waters and graphic representation of their compositions. Dokl. Akad. Nauk. SSSR. 1948;59:87-90.
- [Google Scholar]
- El-Ghazawi, M.M., 1989. Hydrogeological studies in northeast of Sinai, Egypt. Ph.D. Thesis, Fac. Sci., Mansoura Univ., Egypt, 290pp., York, 377pp.
- El-Shazly, E.M., Abdel Hady, M.A., El Ghawaby, M.A., El Kassas, I.A., El Shazly, M.M., Salman, A.B., El-Rakaiby, M., 1974. Geology of Sinai Peninsula from ERTS-1 Satellite Images. ASRT, Remote Sensing Project, Cairo, Egypt, 20pp.
- Geomorphological and hydrogeological aspects of Sinai Peninsula. Ann. Geol. Surv. Egypt. 1980;10:807-817.
- [Google Scholar]
- Hassanin, A.M., 1997. Geological and geomorphological impacts on the water resources in Central Sinai. Ph.D. Thesis, Fac. Sci., Ain Shams Univ., Egypt, 373pp.
- Analysis and Evaluation of Pumping Test Data (second ed.). The Netherlands: Inter. Instit. Land Recl. Improv.; 1990. 377pp.
- Marotz, G., 1968. Techische grundlageneiner wasserspeicherung imm naturlichen untergrund habilitationsschrift. Universitat Stuttgart.
- Water Quality Criteria. Washington, DC: Protection Agency; 1972. 594pp.
- The Geology of Egypt. Amsterdam, New York: Elsevier Publishing Co.; 1962. 377pp.
- Said, R., 1971. Explanatory notes to accompany the geological map of Egypt. Egypt Geol. Surv. Paper 56, 123pp.
- Said R., ed. The Geology of Egypt. Rotterdam: A.A. Balkema Pub.; 1990. 734pp.
- Structural development of Sinai Peninsula, Egypt. Bull. Inst. Desert Egypte. 1956;6(2):117-157.
- [Google Scholar]
- The geology and geomorphology of El-Qusaima area. Bull. Soc. Geograph. Egypte 1960:95-146.
- [Google Scholar]
- US Salinity Laboratory Staff, 1954. Diagnosis and improvement of saline and alkali soils. Handbook No. 60. U.S. Dept. Agr., Washington, DC, 160pp.
- Guidelines for Drinking Water Quality. Geneva: World Health Organization; 1993.
- Water Resources Research Institute (WRRI), 1995. Annual Hydrological Report, Internal Report, El-Qanater El Khayria, Cairo, Egypt.
- Water Resources Research Institute (WRRI), 2001. Annual Hydrological Report, Internal Report, El-Qanater El Khayria, Cairo, Egypt.
- Relation between ground-water composition and geology of Dakhla Oasis. Bull. Geogr. Egypt. 1964;T:101-112.
- [Google Scholar]


